Monitor temperature and humidity with Grafana and Raspberry Pi
There are a lot of reasons you might need to monitor temperature and humidity — from data center storage to preserving valuable artwork to making sure your plants thrive in that greenhouse you just installed.
Fortunately, you can pair multiple sensor types with Grafana to monitor and protect whatever you care about most from the elements — computers, Picassos, or tomatoes.
In the first part of this blog, Antonio Calero, developer advocate here at Grafana Labs, will walk through how to use Grafana to monitor temperature and humidity with a DHT22 sensor.
In the second part of this blog, Laura Fernández Fernández, software engineer at Grafana Labs, will explore how to monitor temperature and humidity using Grafana and another sensor type: RuuviTag sensors.
In both cases, we will also use a Raspberry Pi computer and Prometheus.
Part 1: Using DHT22 sensors to track temperature and humidity
Note: Part 1 of this blog, by Antonio Calero, was updated in December 2024 to reflect the most recent set of steps to complete this project.
Before you begin
In this project, we leverage a Python script to simulate sensor data and use Docker to containerize the entire setup. The data is exposed via an HTTP endpoint, which is then scraped by Prometheus. Prometheus collects these metrics and stores them in its time-series database, where they can be queried. Grafana is used to visualize this data, offering real-time dashboards to track sensor metrics like temperature or humidity.
This setup can be entirely run within Docker, making it portable and easy to deploy.
All the code for this section of the blog can be found in the dedicated GitHub repository.
Requirements
To get started, you will need to meet a few hardware and software requirements.
Hardware:
- Raspberry Pi. I used a Raspberry Pi 4 B+ with the Raspberry Pi OS, but any Raspberry Pi model should work. You will also need a DHT22 sensor.
Software (detailed installation steps are in the repo):
- Docker and Docker Compose
Connect the sensor to Raspberry Pi
After meeting the requirements above, our first step is to connect our DHT22 sensor with the Raspberry Pi computer.
The DHT22 sensor comes with three pins that we will connect to the Raspberry Pi pins with jumper wires that have female ends. On the DHT22 sensor, the power supply is represented with the positive symbol “+,” the data output as “out,” and the ground wire with the negative symbol “-.”
To connect the sensor to the Raspberry Pi board, we need to:
- Connect the power supply (+) to pin 1 (3v3 power)
- Connect the data output wire to pin 7 (GPIO 4)
- Connect the ground (-) wire to pin 6 (Ground)
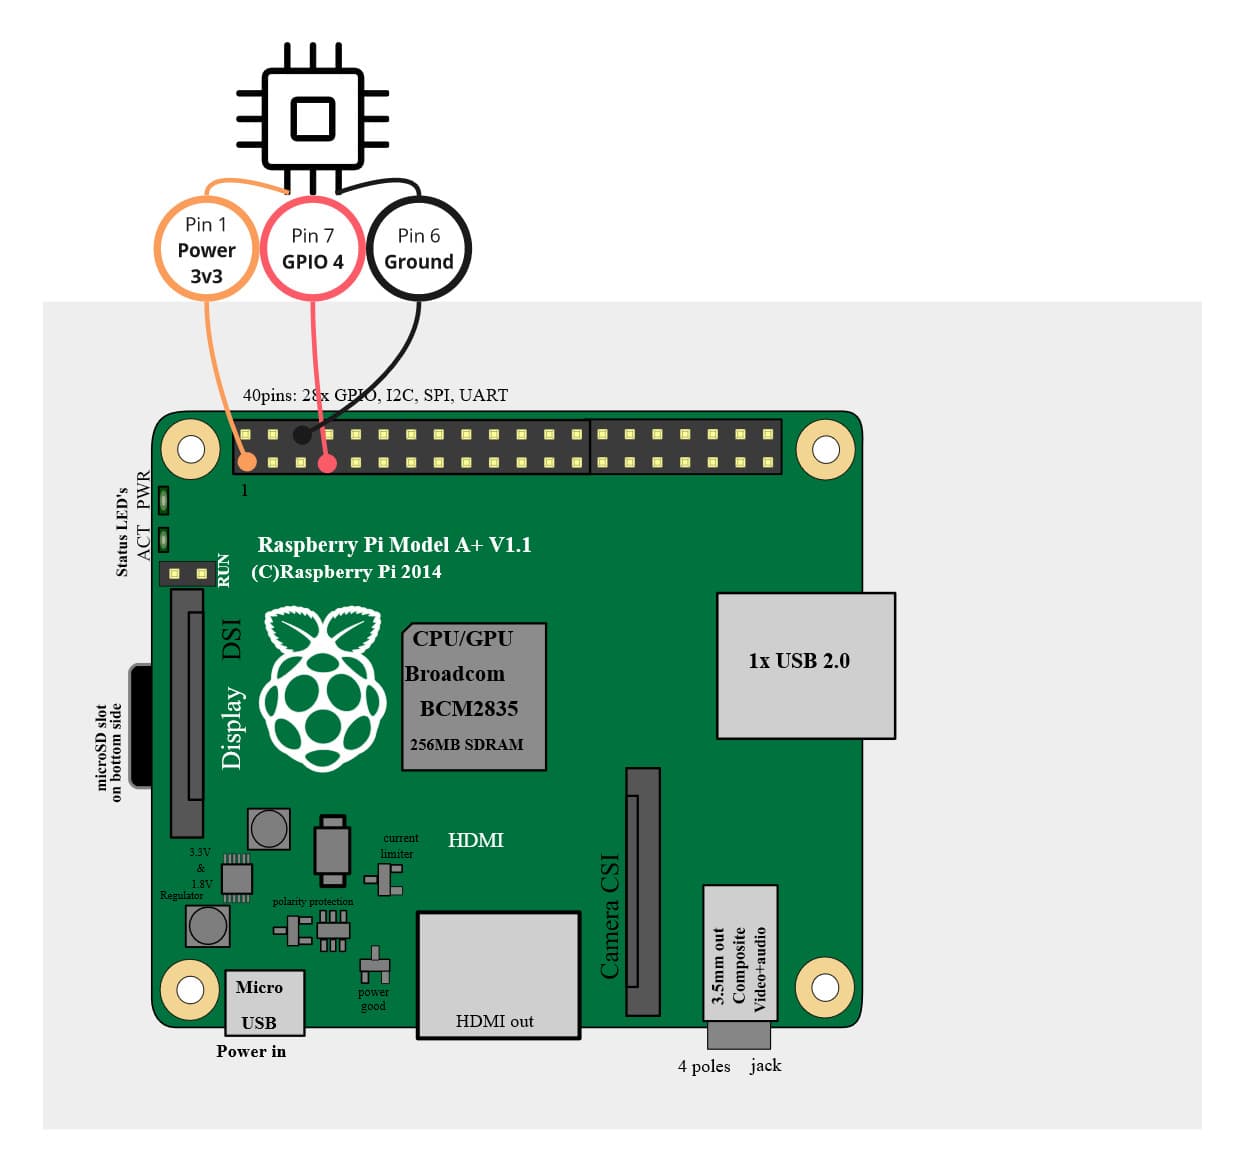
(Tip: The pins on the Raspberry Pi board can be easily identified by counting. Place the Raspberry Pi in front of you, so you see two rows of pins at the top. The bottom row is numbered with odd numbers — 1,3,5, etc. — and the row above it is numbered with even numbers — 2,4,6, etc.)
Set up the Grafana stack
To demonstrate the observation of data using the Grafana stack, download and run the following files.
- Clone thetutorial environment repository:
- Change to the directory where you cloned the repository:cd sensor-data-monitoring-grafana
- Run the Grafana stack:docker compose build
- Bring up the containers:docker compose up -d
The first time you run docker compose build and docker compose up -d, Docker will rebuild the images and then bring up the containers. This might take a few minutes, depending on your internet connection.
Note: If you already have Grafana, or Prometheus running on your system, you might see errors, because the Docker image is trying to use ports that your local installations are already using. If this is the case, stop the services, then run the command again.
With Docker, the application can run continuously in the background as a service within a container. Since the container has been configured to automatically restart if stopped, it ensures that the application remains active without manual intervention.
How does it work?
To visualize this data in Grafana, we need time-series metrics that we can collect and store to see how they vary over time. We can do that with Prometheus. However, we first need a way to export the data through a port. For that, we use a Python application based on Flask, a web framework for Python that can run using a single file.
This is the main application, which is the exporter of our data.
import Adafruit_DHT as dht_sensor
import time
from flask import Flask, Response
from prometheus_client import Counter, Gauge, start_http_server, generate_latest

content_type = str('text/plain; version=0.0.4; charset=utf-8')

def get_temperature_readings():
    humidity, temperature = dht_sensor.read_retry(dht_sensor.DHT22, 4)
    humidity = format(humidity, ".2f")
    temperature = format(temperature, ".2f")
    if all(v is not None for v in [humidity, temperature]):
        response = {"temperature": temperature, "humidity": humidity}
        return response
    else:
        time.sleep(0.2)
        humidity, temperature = dht_sensor.read_retry(dht_sensor.DHT22, 4)
        humidity = format(humidity, ".2f")
        temperature = format(temperature, ".2f")
        response = {"temperature": temperature, "humidity": humidity}
        return response

app = Flask(__name__)

current_humidity = Gauge(
        'current_humidity',
        'the current humidity percentage, this is a gauge as the value can increase or decrease',
        ['room']
)

current_temperature = Gauge(
        'current_temperature',
        'the current temperature in celsius, this is a gauge as the value can increase or decrease',
        ['room']
)

@app.route('/metrics')
def metrics():
    metrics = get_temperature_readings()
    current_humidity.labels('study').set(metrics['humidity'])
    current_temperature.labels('study').set(metrics['temperature'])
    return Response(generate_latest(), mimetype=content_type)

if __name__ == '__main__':
    app.run(host='0.0.0.0', port=5000)
The important line of code here is dht_sensor.read_retry(dht_sensor.DHT22, 4). The 4 represents the GPIO 4 pin (physical pin 7 in the Raspberry Pi pin header), which is the data pin we wired to the sensor.
In summary, we have created a web application based on Python in a single file, which can do a number of things, including:
- Get indoor temperature and humidity readings by interacting with your sensor
- Enable metrics that can be counted, measured, and exposed over HTTP, and to be read by the Prometheus server via the exposed port 5000
Our Python app should be already running in the background. If you send a request to http://localhost:5000/metrics or visit http://{you-raspberry-pi-IP-address}:5000/metrics from another machine in your network, you should be able to see the exported metrics:
curl http://localhost:5000/metrics
(...)

current_humidity{room="study"} 54.0
# HELP current_temperature the current temperature in celsius, this is a gauge as the value can increase or decrease
# TYPE current_temperature gauge
current_temperature{room="study"} 27.0
Monitor your temperature and humidity data from Grafana
Now that we understand how metrics are exported by our Python app, stored, and collected by Prometheus, we can move on to monitoring sensor data in Grafana.
- From your machine, access your Raspberry Pi by entering the IP address into the browser: http://{you-raspberry-pi-IP-address}:3000.
- You should be automatically logged in to Grafana.
- Open the side menu.
- Click Explore.
- Select Prometheus from the dropdown menu at the top left corner.
- Click Metrics browser and select
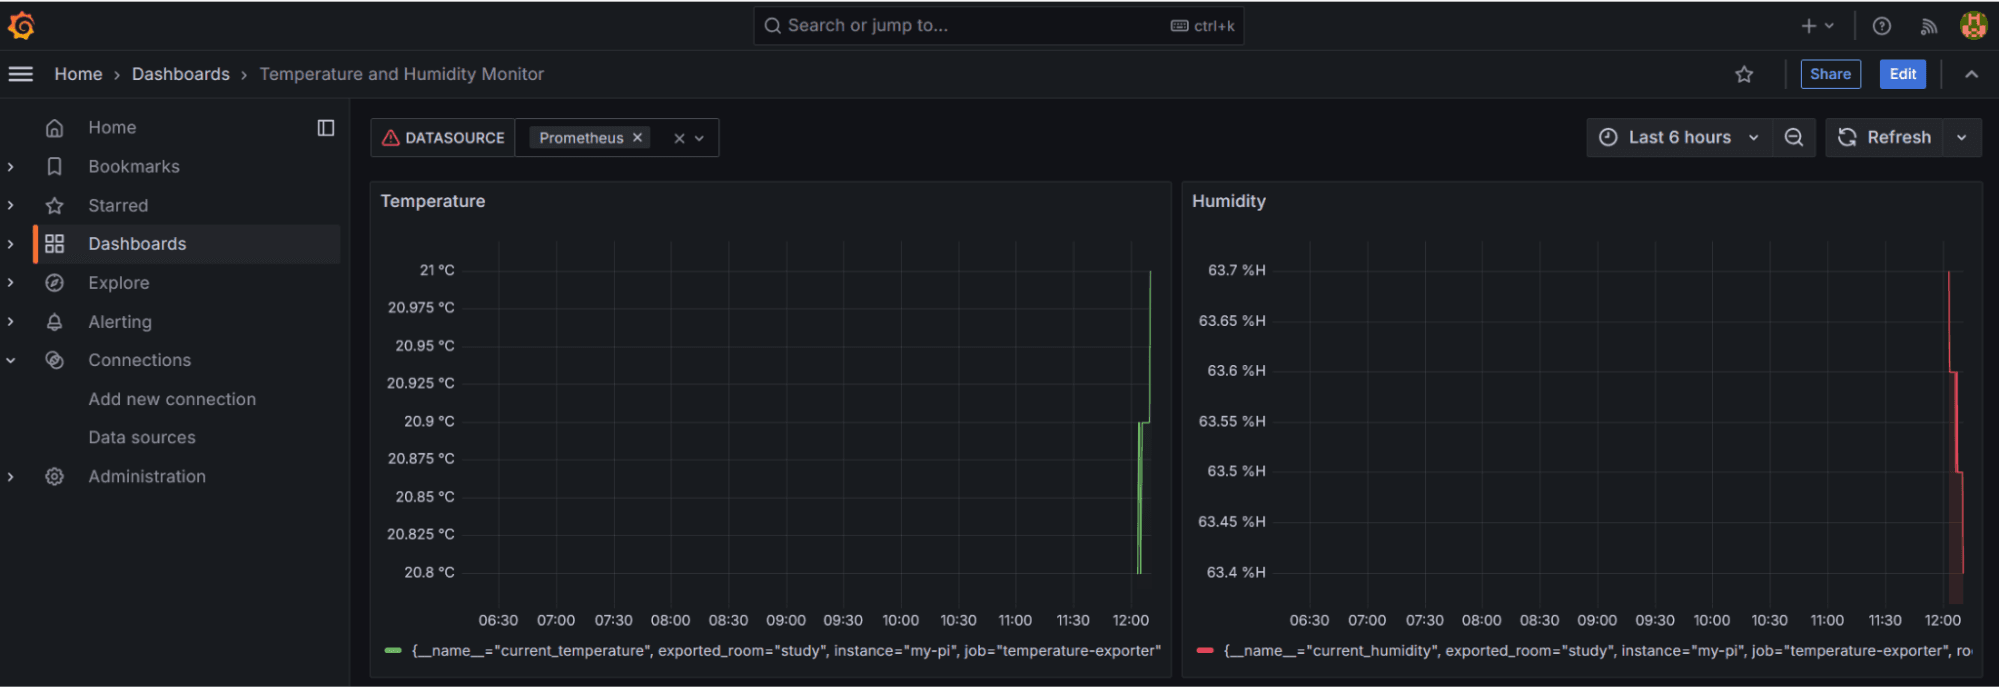
current_temperature. - Click the run query button at the top right corner. You should see temperature data graphed.

- Click Add > Add to dashboard > Open dashboard. This will take the query that you’ve been working on and save it as a panel on a Grafana dashboard.
You made it!
From here you can create a second panel to monitor the current_humidity .
For inspiration or reference, import the sample dashboard provided for this tutorial by using its ID. In Grafana, go to Home > Dashboards > Import, enter the ID 22406, and click Load. Adjust it to fit your needs.

Note: You can also check out this blog to learn how to use Grafana’s built-in alerting system to receive notifications from your sensor data.
Part 2: Using RuuviTag Sensors to track temperature and humidity
Note: Part 2 of this blog is by Laura FernándezFernández.
Galicia is commonly known as a green land, with lots of rivers, beaches, and cliffs facing the Cantabrian Sea and the Atlantic Ocean — but it also has its rainy days. This leads to issues with humidity, and my flat is no exception.
As the rooms next to my terrace can become moldy during winter, I want to track temperature and humidity so I know when to turn on the dehumidifier.
To follow along with this part of the blog, you will need:
- RuuviTag sensors (I used two, because I wanted to monitor the temperature and humidity in two different rooms)
- Raspberry Pi (I used the Raspberry Pi 4 advanced kit to be sure I have all the necessary components)
Set up Raspberry Pi and the Ruuvi Prometheus scraper
First, you will need to build the Raspberry Pi and install the OS. If you are using the Raspberry Pi 4 advanced kit, as I did, you just have to insert the MicroSD that has NOOBs pre-installed, choose the software, and follow the instructions.
Next, set up the Ruuvi Prometheus scraper. According to the Read.me file, run:
curl -fsSL "https://raw.githubusercontent.com/arimkevi/ruuvi-prometheus-scraper/master/install.sh" | sudo bash
You won’t need to clone the repo, as this command will install the necessary packages, download the repo in “/home/ruuvi/…,” create a virtual environment with the dependencies, and kick-start the service.
Add the MAC address of your RuuviTag sensors in /home/ruuvi/ruuvi-prometheus-scraper/config.json. Your sensor’s MAC can be found in the Ruuvi Station mobile app > Sensor settings > More info.
With the sensor turned on, check if the Ruuvi Prometheus scraper is working through a browser by looking at localhost:8000.
You should check that it not only shows some data, but also has these three metrics with some value: #HELP ruuvi_temperature_c Temperature in Celsius #TYPE ruuvi_temperature_c gauge ruuvi_temperature_c{location=”your sensor name”} 29.59
#HELP ruuvi_humidity_percent Humidity % #TYPE ruuvi_humidity_percent gauge ruuvi_humidity_percent{location=”your sensor name”} 0.3979
#HELP ruuvi_pressure_hpa Air pressure hPa #TYPE ruuvi_pressure_hpa gauge ruuvi_pressure_hpa{location=”your sensor name”} 1006.63
(Note: If you try to run main.ly and it triggers a ‘ModuleNotFound,’ you can install the prometheus_client: pip install prometheus_client)
Run Prometheus
To start, clone the Prometheus repository.
Modify the prometheus.yml file by adding the Ruuvi sensors to the scrape_configs:
# A scrape configuration containing exactly one endpoint to scrape:
# Here it's Prometheus itself.
scrape_configs:
  # The job name is added as a label `job=<job_name>` to any timeseries scraped from this config.
  - job_name: "prometheus"
    # metrics_path defaults to '/metrics'
    # scheme defaults to 'http'.
    static_configs:
      - targets: ["localhost:9090"]

  # Ruuvi sensors
  - job_name: "ruuvi"
      static_configs:
        - targets: ["localhost:8000"]
You can start Prometheus by following the ‘Read.me’ instructions or running this in the repo:
sudo ./prometheus –-config.file=prometheus.yml
As we did with the Ruuvi scraper, we should check if Prometheus is working as expected. Open localhost:9090 in your browser. In localhost:9090/graph, look for the Ruuvi metrics, as ruuvi_temperature_c, and execute it to visualize them. You can also see the data in a table format in localhost:9090/table.
Visualize data in Grafana
Now that we have both the Ruuvi Prometheus scraper and Prometheus running, we should clone the Grafana repo so we can start visualizing our data.
Open Grafana in the correspondent port, which will be localhost:3000 by default, and log in with “admin” as the user and password keys. You can modify these later.
Create a dashboard by importing the one from the Ruuvi Prometheus scraper and you will be able to visualize your data in Grafana. Adjust the thresholds and other settings, as needed.
You’ve done it! Congratulations!
What I’ve learned
As a final thought, here are a few of the key things I learned about the process of getting data from the sensors and then visualizing it on a Grafana dashboard.
The scraper exposes the RuuviTag sensors’ data on localhost:8000. Prometheus pulls the metrics from that address — this is why its config should be modified to add this target as a new scrape config block — and stores them in a time-series database.
Also, Grafana uses Prometheus as the data source, pointing at localhost:9090. The user should get the specific data from the RuuviTag sensors running the correspondent queries, such as ruuvi_temperature_c{location=”your location”} and then the metrics will be displayed in the visualization previously chosen.
Grafana Cloud is the easiest way to get started with metrics, logs, traces, and dashboards. We have a generous forever-free tier and plans for every use case. Sign up for free today!