
New in Grafana k6: The latest OSS features in v0.47.0 and more efficient performance testing in Grafana Cloud k6
Grafana k6 v0.47.0 has been released, featuring gRPC’s binary metadata support, new authentication methods, and tons of other improvements for Grafana k6 OSS.
Here’s a quick overview of the latest features in Grafana k6 v0.47.0, as well as some other exciting updates related to Grafana Cloud k6 and the k6 community.
Grafana k6 v0.47.0 release
The new release includes:
- Binary metadata support in the k6 gRPC module: The k6 gRPC modules (
k6/net/grpcandk6/experimental/grpc) now support binary metadata that uses the-binpostfix, according to the gRPC specification. Thanks to @sapphire-janrain for the contribution!
let resp = client.invoke(
	"grpc.testing.TestService/EmptyCall",
	{},
	{ metadata: { "X-Load-Tester-bin": new Uint8Array([2, 200]) } }
);
- Reflection metadata support in the k6 gRPC module: The k6 gRPC modules (
k6/net/grpcandk6/experimental/grpc) now support adding metadata to reflection requests by using a new connection parameter,reflectMetadata. - Higher precision for Trend metrics in Grafana Cloud k6: Grafana Cloud k6 is now able to store and visualize Trend metrics up to 3 digits of precision for decimal numbers.
- Docker images for ARM64 architecture: The k6 release process now builds and pushes dedicated Docker images for ARM64. Check k6’s tags page on Docker Hub for details.
- New authentication methods and HTTP headers API for Prometheus remote write output: The experimental Prometheus remote write output now supports two new authentication methods: Bearer token and TLS certificates. Learn how to define them in our documentation. We’ve also added the
K6_PROMETHEUS_RW_HTTP_HEADERSthat defines a new and more convenient way to set custom HTTP headers to pass through each flush metric’s request.
The v0.47.0 release includes more internal improvements, minor changes, and fixes from the k6 team and the community. Check out the full list in the k6 release notes.
k6 browser updates
k6 browser lets you automate browser actions and collect web performance metrics for your k6 tests.
In the k6 0.47.0 release, apart from a few bug fixes and internal improvements, the team introduced a feature to improve and stabilize the browser module’s Cookie API. We have introduced a new Cookie class to represent a cookie in a BrowserContext. There were also bug fixes made around adding and clearing cookies. A sample code snippet for creating and managing cookies can be found below:
const context = browser.newContext();
context.addCookies([
	{ name: "foo", value: "bar", url: "https://test.k6.io" },
	{ name: "baz", value: "qux", url: "https://grafana.com" },
]);

const cookies = context.cookies("https://test.k6.io");
console.log(cookies.length); // 1
console.log(cookies[0].name); // foo
console.log(cookies[0].value); // bar

context.clearCookies();
console.log(context.cookies.length); // 0
You can check out our k6 browser API documentation for more examples related to cookies.
We’ve also added support for the page.on(‘console’) event, which is emitted when the page calls one of the console API methods, such as console.log or console.error. For example, if you need to assert any logs or errors from the console, you can now achieve this through the following code snippet:
page.on("console", (msg) => {
	check(msg, {
		assertConsoleMessageType: (msg) => msg.type() == "log",
		assertConsoleMessageText: (msg) =>
			msg.text() == "this is a console.log message 42",
		assertConsoleMessageArgs0: (msg) =>
			msg.args()[0].jsonValue() == "this is a console.log message",
		assertConsoleMessageArgs1: (msg) => msg.args()[1].jsonValue() == 42,
	});
});

page.evaluate(() => console.log("this is a console.log error", 42));
Finally, there is now Docker support for browser-based tests. We now have official images that include a Chromium-based browser, so you can run browser tests without installing a browser.
Make sure to read the full release notes for k6 0.47.0 for all the latest information, and, as always, ask in the Community forum if you need our help!
New in Grafana Cloud k6
This year, we announced the general availability of Grafana Cloud k6, our managed performance testing solution in Grafana Cloud. If you want to try it out, Grafana Cloud has a forever-free plan with 500 virtual user hours per month and more. Sign up for free today!
Note: Existing k6 Cloud customers will not be impacted — they will be migrated to the new experience at a later date.
We continue to add more features to Grafana Cloud k6. Some of the latest additions include:
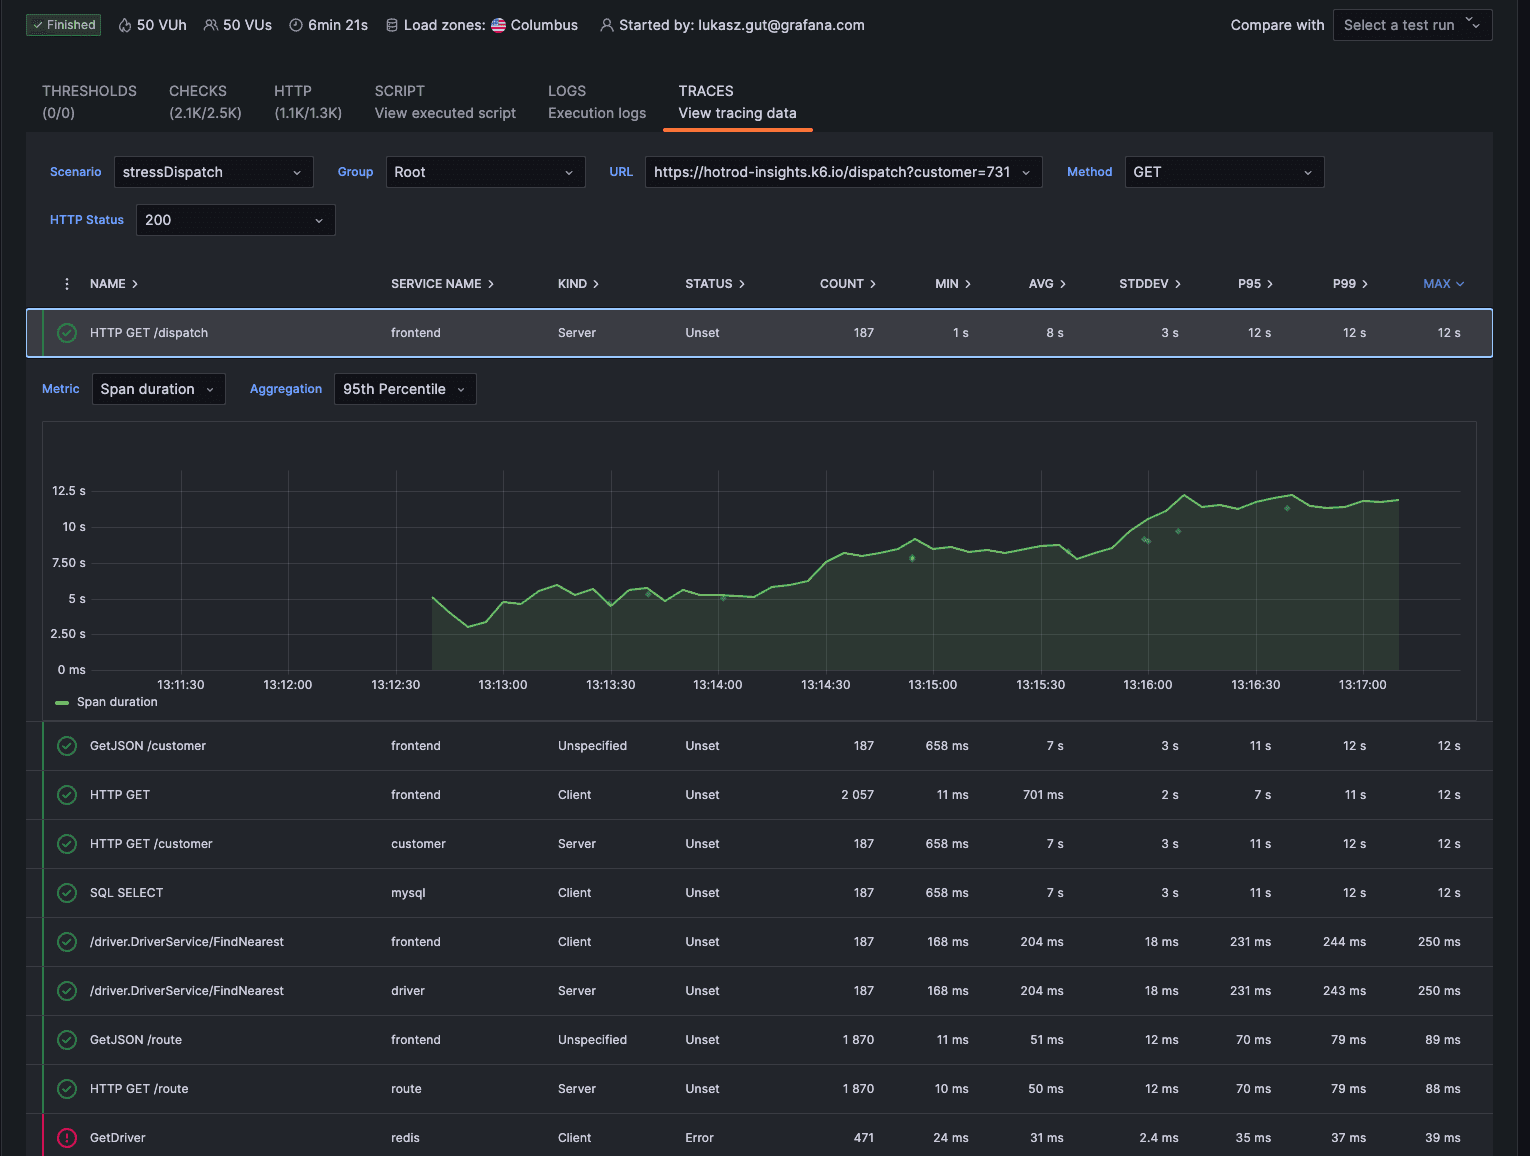
- Distributed Tracing in Grafana Cloud k6 (Generally Available): Correlate performance test results with server-side tracing data to debug failed performance tests faster than ever. To learn more, refer to the Integration with Grafana Cloud Traces documentation and Distributed Tracing in Grafana Cloud k6 blog post.
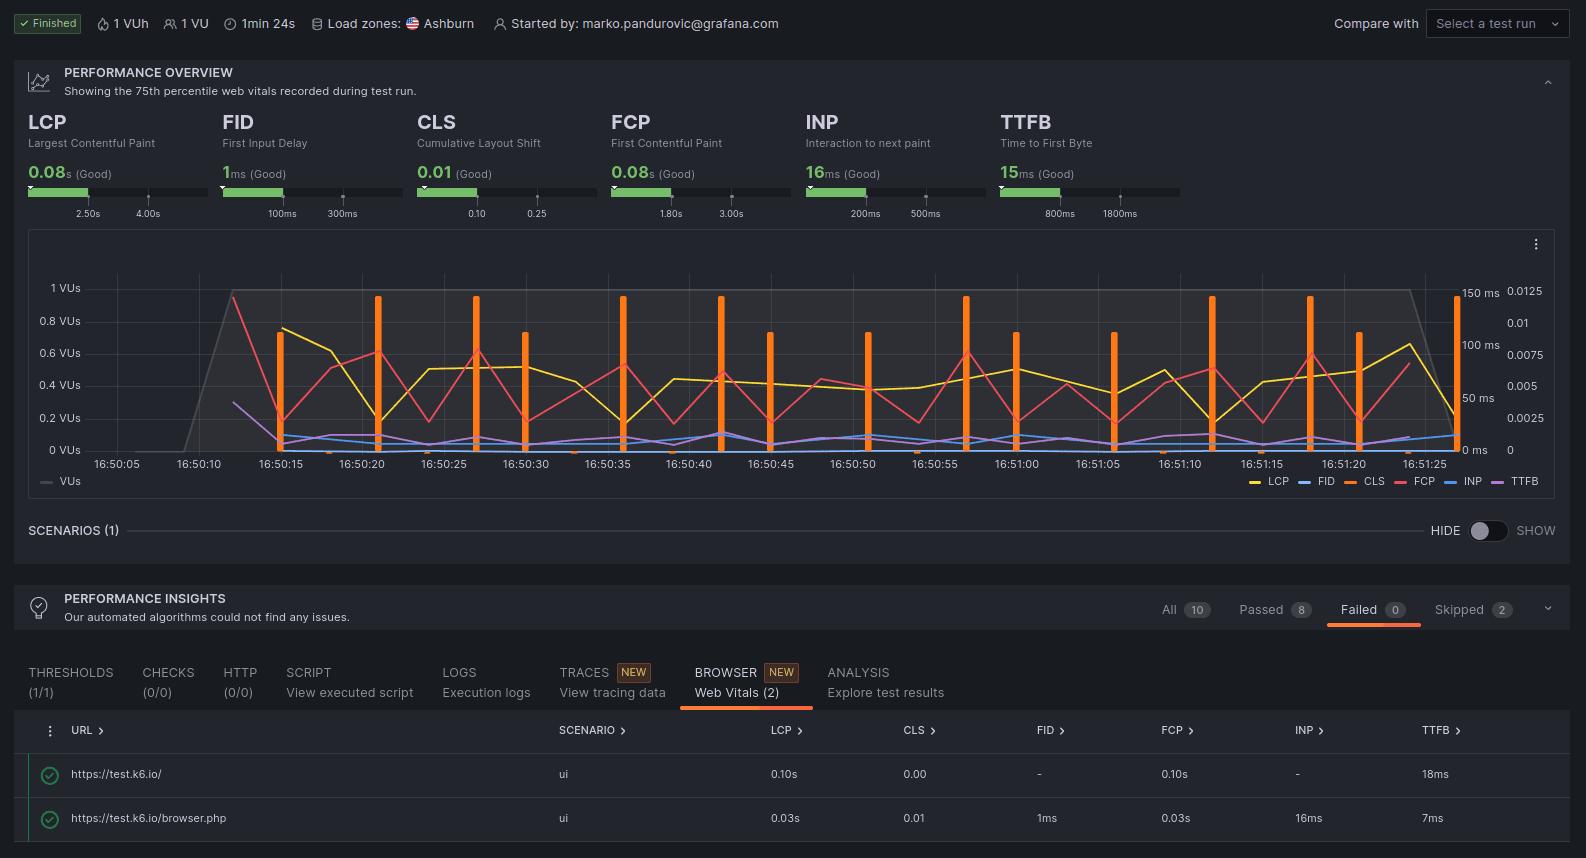
- Browser testing in Grafana Cloud k6 (Public Preview): Run cloud-based browser tests on top of your existing k6 protocol tests to measure web performance metrics and find issues difficult to catch on the protocol level. To learn more, refer to our documentation.
- Analysis tab (Generally Available): Easily view any custom metric generated by k6 tests in Grafana Cloud k6 and open them in Explore for further analysis and correlations.

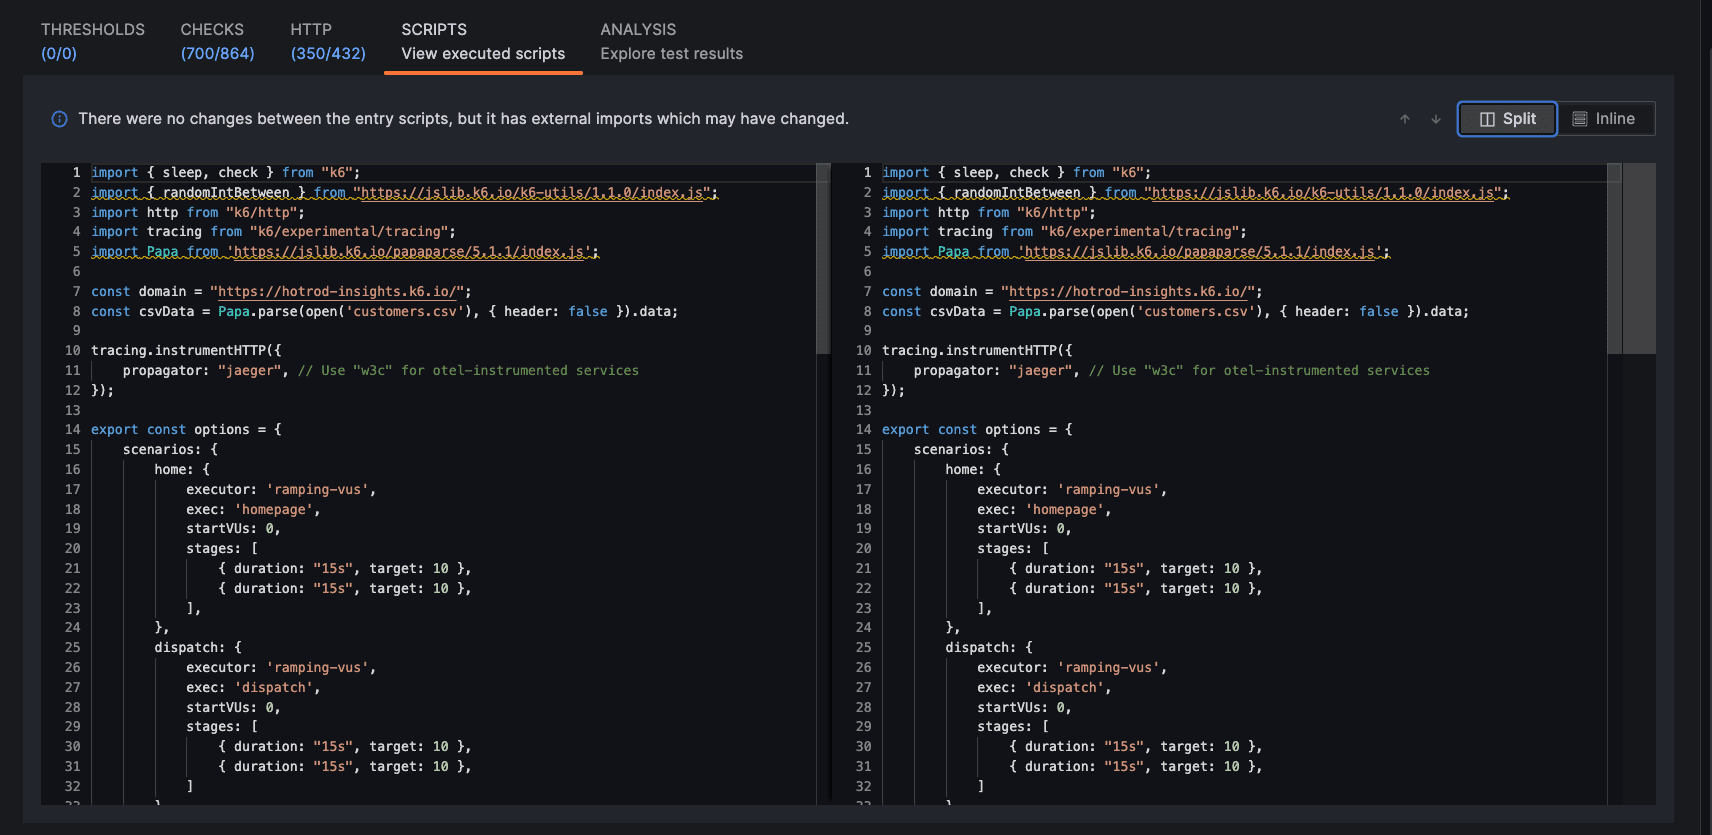
- Test script comparison (Generally Available): When comparing test results in Grafana Cloud k6, now you can compare the test scripts to see if there are meaningful differences.
- Private load zones v2 (Public Preview): This enhancement of the k6-operator makes it even easier for customers to create “load generators” in their K8s cluster to test interval services. Learn more about how to set up private load zones in our documentation.
k6-operator
During this release cycle, the k6-operator published a new pre-release candidate, v0.0.11rc3.
This early release provides the long-awaited Helm chart option for deploying the operator. Huge thanks to @knmsk for his initial contribution and perseverance with updates, as this change did take some time to incorporate into the codebase.
This release also introduces the new TestRun resource as a replacement for the K6 resource, which will be removed in a future release.
A breaking change has been introduced within the K6 API. “nodeselector“ has been changed to “nodeSelector“ to improve user experience with a standardized naming convention.
Other updates include:
- Ensuring resource cleanup after running with
PrivateLoadZone. - Preparations for publishing Helm charts to Grafana chart repository.
The latest on k6 extensions
As usual, there has been much activity in the extensions ecosystem!
A special shout-out to our own Iván Szkiba. In a productive first quarter as a Grafanista, Iván produced the new xk6-dashboard, an officially supported extension to enable a browser-based metrics dashboard with live updates from a locally running test. This also allows you to save test results as a PDF file.
In addition, there are several new features and bug fixes:
- xk6-kubernetes v0.8.0: Includes a fix for in-cluster configuration, thanks to @JorTurFer.
- avitalique/xk6-file v1.4.0: Includes new functionality to rename files from within a test script.
- kubeshop/xk6-tracetest v0.1.6: Contains a concurrency fix for issues encountered during startup.
- deejiw/xk6-gcp v0.3.0: Supports Google PubSub messaging.
Additional updates have continued to trickle in, as extension authors address the transitive dependency issue announced last release, as well as bump other dependencies. Updates include:
Of course, the extension community continues to grow! The following new extensions have been added to the registry:
- JorTurFer/xk6-input-prometheus: Allows you to query metrics from a Prometheus instance.
- oleiade/xk6-kv: Provides a persistent key-value store to enable shared state across VUs. This implementation is now the recommended extension over the now-deprecated dgzlopes/xk6-kv extension.
- szkiba/k6x: An exciting new utility for running custom extensions on the fly. With k6x, your custom k6 binary will be created automatically to execute with extensions referenced by your test script; no pre-build is required.
Other changes in the k6 ecosystem include two new dashboards for visualizing your Prometheus-based test results in Grafana:k6 Prometheus dashboard and k6 Prometheus (Native Histograms) dashboard.
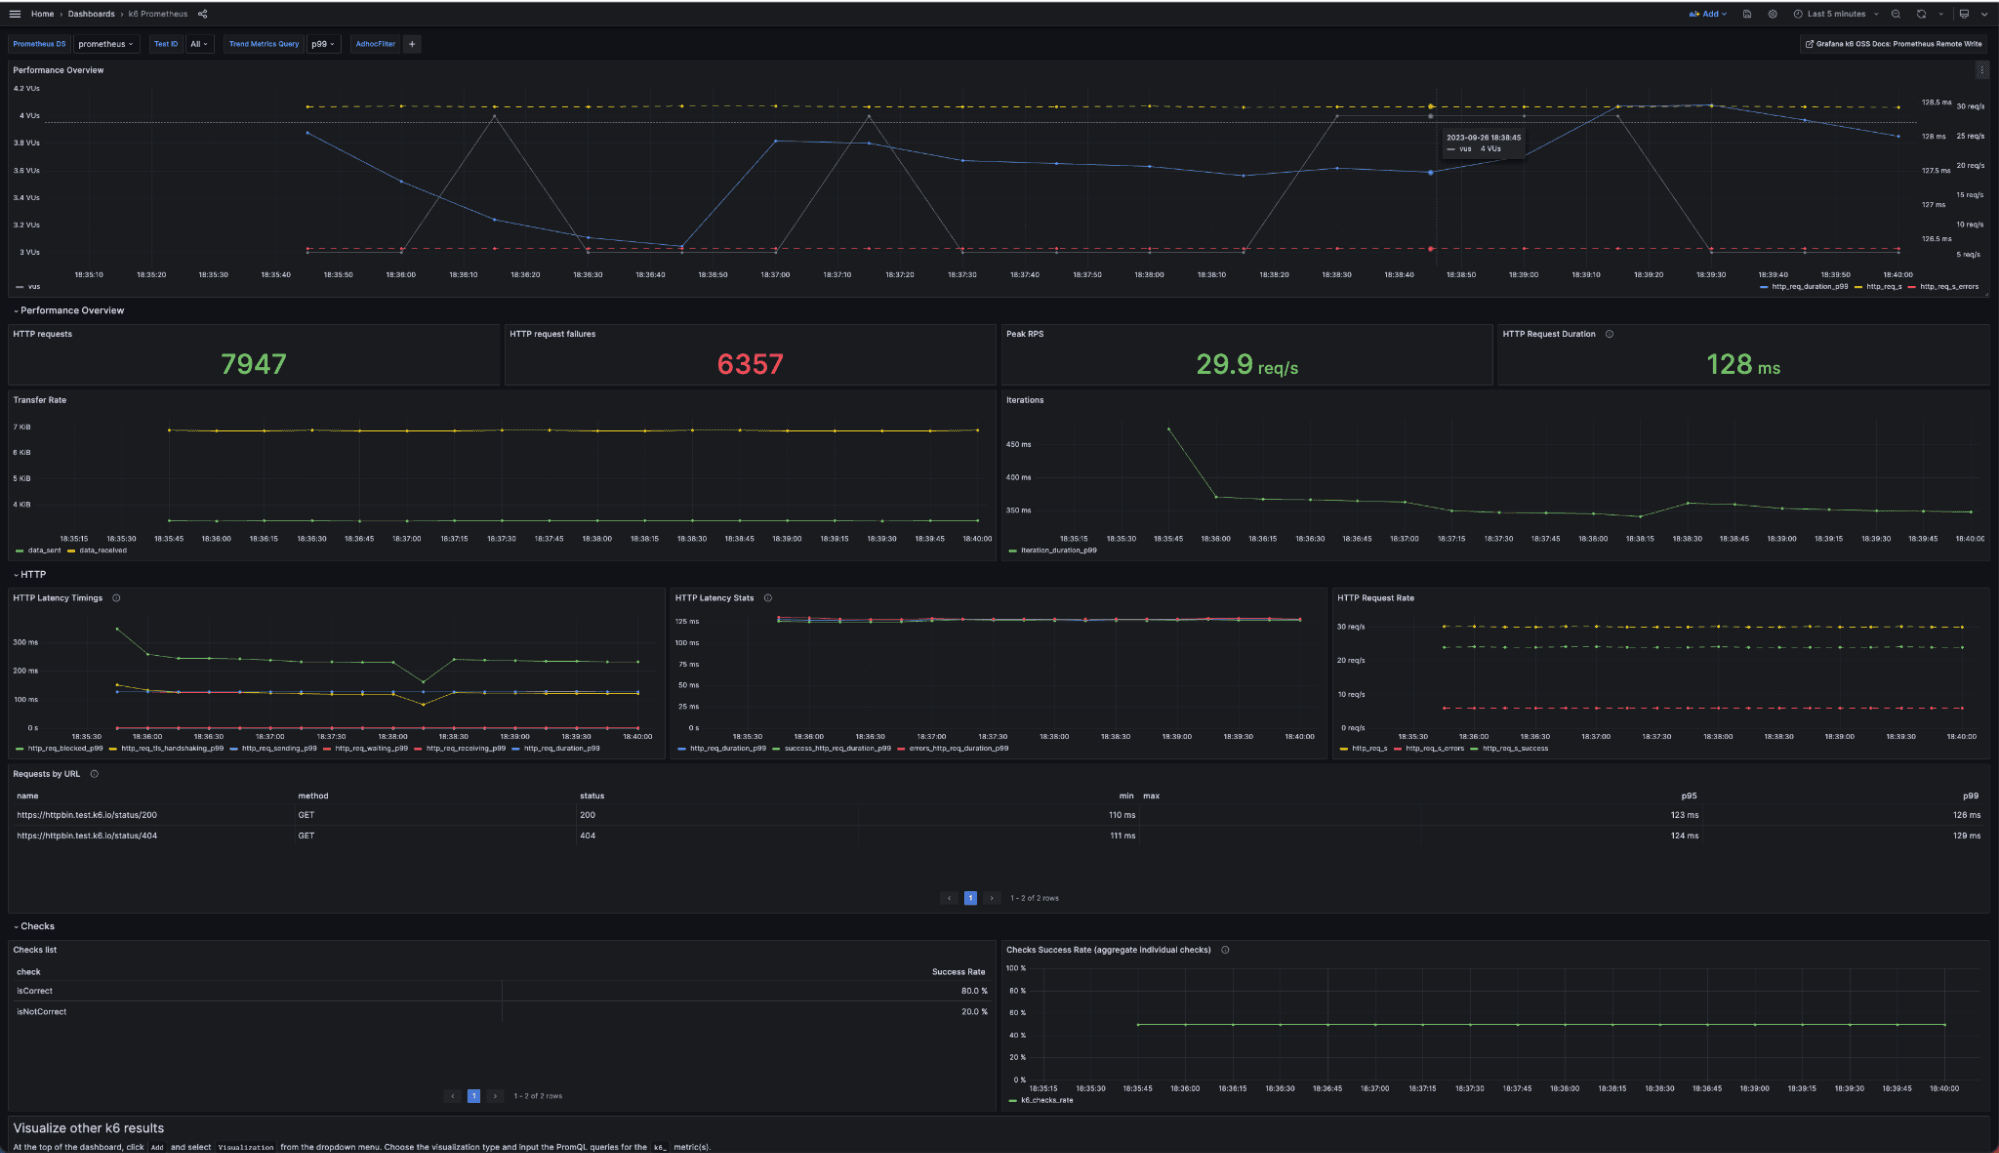
Using either of these “official” dashboards provided by k6 maintainers, you can stream k6 test-result metrics to a Prometheus remote write endpoint, then visualize them in Grafana. Learn more about sending k6 metrics to Prometheus in the k6 OSS documentation.
As always, a huge thank you to our community! We look forward to celebrating more contributor successes!
k6 Champions
The Grafana k6 Champions Program aims to recognize experts within our community to amplify their contributions and partner with the k6 team.
We have some fantastic news again! We have accepted three more contributors to the program:
Huzaifa, Bartosz, and Monish have been big advocates of k6, making contributions such as video content, blog posts, and in-person workshops.
We look forward to seeing how our new Champions continue to engage and get involved with the community! 🙌
Our existing k6 Champions have also been busy within the community:
- Enes Kühn spoke about hybrid performance testing virtually at the GeoSTQB conference during International Tester’s Day.
- Ziv Kalderon spoke virtually at another conference, Hands-on Testing, where he shared how to shift performance testing to the left with k6.
- Carlos Gauto and José Wenceslao (“Wen”) Castilloattended the Nerdearla 2023 conference to do a talk and host a workshop about k6, respectively. Wen also conducted a free performance testing and k6 course/workshop for 18 hours!
- Ioannis Papadakis spoke at WeTest Athens about how you can go “from zero to k6 hero” when it comes to performance testing. He also hosted a live event where he spoke about building SLOs with k6.
- Donald Le has published not one, but two, comprehensive articles! His first article was about integrating k6-browser with LambdaTest, and the second is about implementing and debugging load tests for Go applications running in Kubernetes.
- Yusuf Tayman also wrote an article about mastering Redis performance with xk6-redis. He also shared with us how his company uses the 80/20 rule regarding its observability strategy and the important role that k6 plays. In addition, Yusuf became the first k6 champion to also be a Grafana Champion!
- Grzegorz Piechnik wrote a guest post in the Grafana blog about detecting anomalies with k6. He also started an eight-part series of blog posts about k6, and launched his YouTube channel to talk about performance testing.
- Marlo Henrique started a three-part blog post series about k6 metrics to help the students who took his k6 course understand more about the metrics that k6 generates.
We are incredibly grateful for all these amazing contributions from our k6 Champions!
If you love using k6 and have done advocacy and education work on behalf of the project, you can apply to be part of our growing program by filling out this Grafana k6 Champions application form.
And if you are interested in upcoming k6 news or want to connect with the k6 community, please join us on Slack, Twitter, LinkedIn, or YouTube. Happy testing!
Download the latest version of k6 OSS today, or get started with performance testing on Grafana Cloud, which has a generous forever-free tier that includes 500 Virtual User Hours (VUh) and plans for every use case. Sign up for free now!

