Kubernetes cost optimization: tips for a more efficient operation
Kubernetes offers unparalleled flexibility and scalability for containerized orchestration. However, this dynamism can also lead to unexpected costs if you don’t efficiently manage your corresponding cloud resources.
In this blog, we’ll outline a series of best practices for Kubernetes cost optimization that will help you keep your infrastructure running smoothly while staying within your budget. We’ll also provide examples in YAML so you can see how these techniques are implemented, and we’ll point you to additional resources so you can take a closer look at any of these topics. So let’s dive in!
Implement fine-grained resource quotas
In the world of Kubernetes, fine-grained resource quotas act as sentinels, guarding your resource allocation. Think of it as a way to allocate budgets to various departments in an organization to prevent overspending.
By defining precise CPU and memory limits, you prevent resource over-allocation and ensure more efficient utilization. This is particularly helpful when you have multiple teams sharing the same cluster. Assuming each one uses its own namespace, an administrator can attach a quota to each namespace, and the system then tracks any time a user creates new resources to ensure they don’t exceed their allotment. You can find more on resource quotas here.
Example YAML:
apiVersion: v1
kind: ResourceQuota
metadata:
  name: resource-quota-demo
spec:
  hard:
    requests.cpu: "2"
    requests.memory: 4Gi
Set up autoscaling for your Kubernetes pods
Custom, metric-based horizontal pod autoscaling (HPA) and vertical pod autoscaling (VPA) can be your dynamic runtime orchestration conductor.
HPA automatically adjusts the number of pod replicas based on application-specific metrics. This ensures optimal resource allocation and responsiveness to varying workloads, much like how you’d set a thermostat in your home so your heating system knows when to turn on and off in response to outdoor temperature fluctuations. For more details, check out this great article, which shows how to configure HPA and how you can get even more out of it using custom metrics and resource limits.
HPA example YAML:
apiVersion: autoscaling/v2beta2
kind: HorizontalPodAutoscaler
metadata:
  name: custom-hpa-example
spec:
  maxReplicas: 10
  metrics:
  - type: Pods
    pods:
      metricName: http_request_latency_ms
      targetAverageValue: 100m
  scaleTargetRef:
    apiVersion: apps/v1
    kind: Deployment
    name: example-app
Conversely, VPA dynamically adjusts CPU and memory resources for individual pods based on their actual usage. Think of it as a tailor adjusting clothing to fit perfectly for each wearer. This responsive allocation guarantees resource efficiency without overprovisioning. One of many examples can be found here.
VPA example YAML:
apiVersion: "autoscaling.k8s.io/v1"
kind: "VerticalPodAutoscaler"
metadata:
  name: "example-vpa"
spec:
  targetRef:
    apiVersion: "apps/v1"
    kind: "Deployment"
    name: "example-app"
  updatePolicy:
    updateMode: "Auto"
  resourcePolicy:
    containerPolicies:
    - containerName: "app-container"
      controlledResources: ["cpu", "memory"]
Note: While VPA and HPA can both help control costs, they should only be used together for custom and external metrics. They should not be used together on CPU or memory. If you’re looking for a single way to autoscale your cluster and you’re feeling adventurous, you could try
MultidimPodAutoscaler.
Add predictive capabilities to your autoscaling strategy
Add an orchestration virtuoso with predictive autoscaling, which leverages historical data to forecast resource demands. Just as you stockpile groceries before a holiday, this scales resources proactively based on predictions and ensures your applications always have the right resources when needed.
You can use several methods to predict CPU demand, such as Holt-Winters exponential smoothing and Long Short-Term Memory neural networks. Alas, the perfect read on predictive autoscaling doesn’t exist … no, wait a minute, here it is!
Example YAML:
apiVersion: autoscaling/v2beta2
kind: HorizontalPodAutoscaler
metadata:
  name: predictive-hpa-example
spec:
  maxReplicas: 10
  metrics:
  - type: Resource
    resource:
      name: cpu
      targetAverageUtilization: 70
  scaleTargetRef:
    apiVersion: apps/v1
    kind: Deployment
    name: predictive-app
Optimize storage costs dynamically
Dynamic storage optimization involves provisioning storage intelligently and implementing data lifecycle management policies. This approach reduces storage costs while maintaining data accessibility. It’s akin to having an organizer that periodically goes through your self-storage unit to maximize the use of the space and discard old or unwanted items — all based on your specifications.
To enable this, an admin needs to first create a StorageClass object, which defines the provisioner and parameters for users. To find out more, here is what the Kubernetes docs have to say about dynamic volume provisioning.

Fine-tune resource limits vs. resource requests
Resource requests declare a container’s minimum requirements, while resource limits prevent overconsumption. Admins can set limits and requests when building the environment or afterwards, but it’s crucial that they’re precise when setting these values.
Example YAML:
resources:
  requests:
    memory: "2Gi"
    cpu: "500m"
  limits:
    memory: "4Gi"
    cpu: "1"
In this example, resource requests ensure minimum resource availability, and limits prevent excessive usage.
If you need to dig deeper, check out this article, which goes into the details about what requests and limits are and how they’re enforced. The author also calls out important metrics to monitor and includes tips for calculating requests and limits.
Establish a culture of proactive cost governance
Proactive cost governance means conducting regular technical cost reviews with engineering teams and sharing knowledge on cost-efficient resource allocation practices. This culture fosters cost awareness and optimal resource allocation practices, similar to a think tank driving strategies and practices for cost governance.
There’s no cookie-cutter playbook for doing this successfully; it’s all dependent on the type of organization you’re in and the broader company culture. However, the more you can do to make your users aware of the financial impacts of their engineering decisions, the more likely it is that they’ll factor it into their future choices.
Analyze cost and efficiency with Grafana Cloud’s Kubernetes Monitoring solution
With most of the tips we’ve outlined here, you’re essentially creating resource guardrails for your users. But how do you make sure everything is working to plan? Moreover, how do you deal with the fact that you’ll likely need to revisit those guardrails over time in response to the changing needs of your Kubernetes cluster?
With Kubernetes Monitoring in Grafana Cloud, you can track your resource usage and your costs. Plus, it all comes packaged with cluster navigation, logging, and events, so you have full visibility into your cluster.
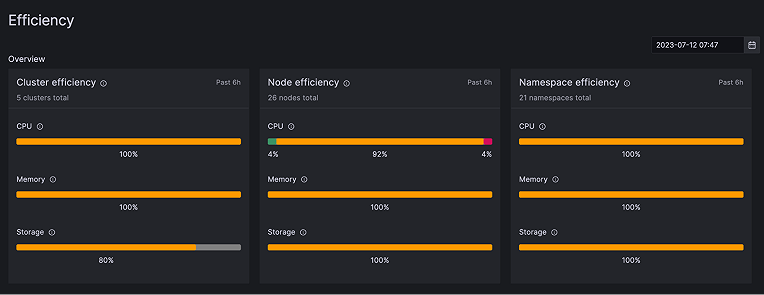
For example, you can use the efficiency view to clearly understand where your resource usage currently stands.This helps you identify the gap between allocated resource usage and actual usage, which you can then use to ensure stable performance. The Kubernetes Monitoring solution also has machine learning-based resource usage prediction to help you with those nasty Black Friday spikes that overtask resources. Check out this doc to find out more.

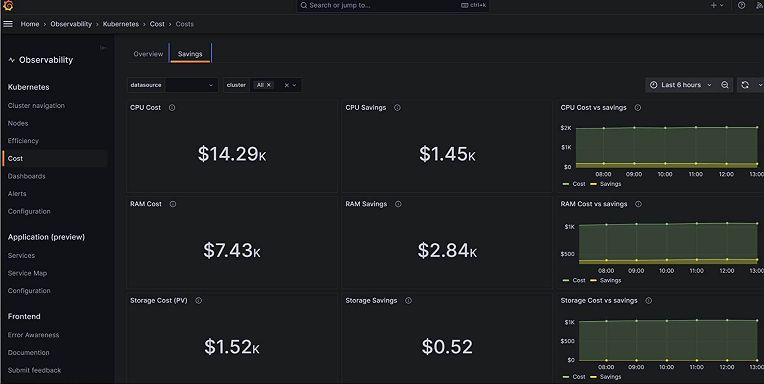
To complement this functionality, there’s also a cost monitoring feature you can use to identify resource and cost allocation. Cost monitoring, which is based on OpenCost, provides granular cost visibility and opinionated cost controlling observability aids based on best practices. The full blog on this feature can be found here.

Kubernetes cost optimization is a dynamic journey, demanding meticulous attention to detail and a commitment to efficient resource management. By following the tips outlined in this blog and revisiting them as needed, you’ll orchestrate a harmonious symphony of performance and cost-effectiveness within your Kubernetes environment. Stay vigilant, monitor resource usage, and adapt your strategies as your infrastructure evolves, and you’ll master the art of Kubernetes cost optimization!
Grafana Cloud is the easiest way to get started with metrics, logs, traces, and dashboards. We recently added new features to our generous forever-free tier, including access to all Enterprise plugins for three users. And there are plans for every use case. Sign up for free now!