
Why companies choose Grafana Cloud over self-hosted OSS stacks
While we all love open source technology and the community that comes with it, we don’t always have the time or resources to stand up, maintain, update, and troubleshoot a self-hosted OSS stack.
This is one of the (many) reasons companies choose to implement Grafana Cloud: you get all the goodness of the open source Grafana LGTM Stack (Loki for logs,Grafana for visualization,Tempo for traces,Mimir for metrics) in a fully managed, end-to-end observability platform.
“With Grafana Cloud, there is very little to no maintenance,” said Omar Lopez, Head of Observability at SailPoint, during a talk at ObservabilityCON 2024. “We let Grafana handle all the complexity that we were handling before, so we can spend that time on higher-priority initiatives.”
Grafana Cloud also provides out-of-the-box, cutting-edge observability solutions like Adaptive Metrics, a cardinality optimization feature that helps you identify and eliminate unused time series metrics to reduce overall observability costs.
But why just take our word for it? In this post, observability practitioners share the top reasons they chose Grafana Cloud, most of which fall into three broad categories, and the benefits that ensued:
1. Reducing the burden of managing an observability stack
2. Lowering observability costs
3. Supporting modern cloud architectures
Reducing the burden of managing an observability stack
Focus more on apps and strategic projects
The benefits of Grafana Cloud were almost instantaneous at The Trade Desk, a SaaS provider in the advertising and digital media space.
“Query time immediately improved and many, many developers seemed to notice. Also, our reliability improved quite a bit,” said Patrick O’Brien, now a Senior Staff Software Engineer, SRE, at The Trade Desk. “We have zero storage nodes, which were the most expensive piece of that stack. Now we just have three nodes and everything feeds back to Grafana Labs.”
In addition to saving the company money, the shift to Grafana Cloud spared the engineering department the headaches of troubleshooting. “Metrics usage frustration improved nearly overnight once we went with the hosted platform,” said Carl Johnson, now Senior Director, Production Engineering at The Trade Desk. “The reason we know it was a success is the complaints and frustrations internally stopped.”
Added Johnson: “I think most of the ROI is really coming from time and labor savings. We can all say that what was once a time-sink was removed from our radar altogether.”
Mux — a start-up that operates an API-first video platform designed to give development teams world-class video streaming and analytics capabilities — had a similar experience with Grafana Cloud.
After struggling for years to maintain an in-house OSS stack (Elasticsearch, Kibana, Prometheus, Jaeger, Grafana) that left the team feeling too reactive and largely in maintenance mode, they knew it was time for a change. They also needed the ability to scale dynamically to accommodate unpredictable usage demands for compute-, network- and storage-intensive workloads.
Ultimately, they turned to Grafana Cloud, in part because of their existing familiarity with Grafana OSS, but the payoff has been a lot more than an easy onramp.
They’ve cut their metrics volume by 60% while also greatly expanding their data retention time, going from seven days to 30 days for traces and from 14 days to 13 months for metrics. This has helped Mux reduce noise, improve long-term analysis, and take a more proactive approach to incident management — all while keeping their costs level and their engineers engaged with more high-impact work.
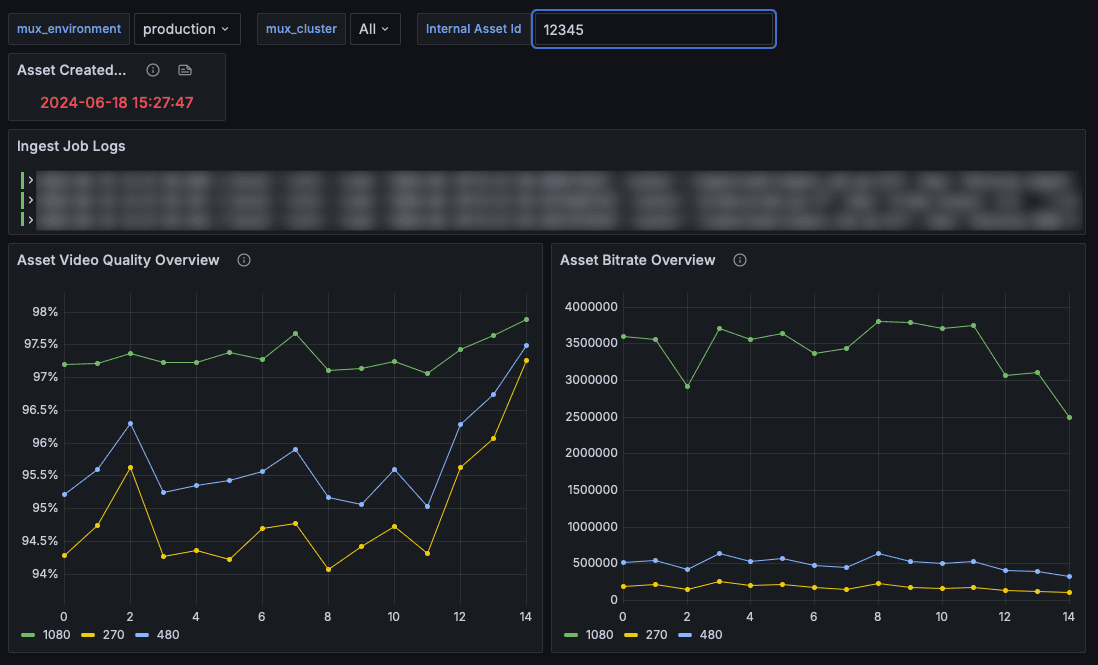
“Grafana Cloud probably saves us hundreds of engineering hours a year,” said Ryan Grothouse, VP, Engineering at Mux. “Our platform engineers don’t have to manage the stack any more, and our product engineers don’t have to work through multiple observability tools, which used to really slow down our response times.”
Read more about how Grafana Cloud has saved engineering hours at both Muxand The Trade Desk.
Increase security for customers
Sometimes you just want more of a good thing. That’s the case at Royal IHC, which used Grafana OSS to create dashboards for their customers as part of integrated solutions that improve operational efficiency for maritime fleets around the world.
Guus Derksen, a Royal IHC project leader, was so happy with the dashboards his team was able to create that he wanted to expand their offerings with Grafana Cloud Advanced, which provides built-in security and access features for their clients.

There are a lot more opportunities for growth and evolution at Royal IHC, which is possible because Grafana Cloud also maintains everything for their individual clients. “It was quite user-friendly,” said Derksen. “It definitely gave us the right direction to move in with the development we are going through in general.”
Learn more about Royal IHC’s observability journey with Grafana Cloud Advanced.
Lowering observability costs
Reduce metrics volume
Despite initial success with Prometheus and Grafana, SailPoint — a leader in identity management solutions — reached limits with scaling, leading to performance challenges and rising maintenance costs. After evaluating options through their internal DACI decision-making framework, SailPoint chose Grafana Cloud for its scalability, built-in support, and reduced maintenance overhead.
The company’s use of Grafana Cloud Adaptive Metrics, combined with the efforts of the engineering team, also helped SailPoint achieve a 50% reduction in active metric series — from 75 million to 37.5 million.
With Adaptive Metrics, “we could reduce metrics while we continue to grow,” said Omar Lopez, Head of Observability, at ObservabilityCON 2024. “We’re still starting up new customers, we’re still writing new features, deploying new microservices, and opening up new regions. All that growth is still happening, but at the same time, we’re reducing our metric count. It blows my mind.”
SailPoint is now exploring additional Grafana Cloud features, such as Synthetic Monitoring for performance testing and Asserts to enhance their monitoring capabilities.
TeleTracking, an integrated healthcare operations platform provider, has seen similar success with Adaptive Metrics. Despite some initial skepticism from the observability team, who feared that removing or aggregating metrics might disrupt critical services or hinder visibility, the company has reduced its telemetry costs by 50% — a reduction that has helped advance TeleTracking’s observability strategy in other significant ways.
“Thanks to 50% savings on our telemetry bill with Adaptive Metrics, we had room in our budget to fund Grafana IRM, and now we spend less time on our incident workflow, including post-mortems,” said Oren Lion, Director of Software Engineering, Productivity Engineering at TeleTracking at ObservabilityCON 2024.
Because of the wins they’ve seen with Adaptive Metrics, TeleTracking also became an early adopter of Adaptive Logs, a Grafana Cloud feature that helps you lower your observability costs by reducing the volume of unnecessary logs.
“Adaptive Logs helps reduce noise, making it easier to spot valuable logs and ultimately saves us costs,” said Andrew Qu, Software Engineer II at TeleTracking, who is already seeing a 50% reduction in log volumes.
Consolidate tools
Ultimate AI is an industry-leading customer support automation platform that helps companies improve customer satisfaction and increase efficiency with AI. Ultimate’s incident response, however, was anything but automatic prior to adopting Grafana Cloud.
Though they were already Grafana OSS users, it wasn’t heavily used because the company had dashboards, logs, and on-call information spread across multiple applications — and the same could be said for their observability bills. “We were spreading our money across multiple different tools and [the system] was indeed doing its job, but it took a lot of cognitive load for developers to actually understand all of those tools,” said a senior software engineer at Ultimate AI.
They eventually centralized on-call management in Grafana IRM, and then quickly built out their managed stack on Grafana Cloud to include Grafana Cloud Logs and Grafana Cloud k6.
Learn more about how Ultimate AI leverages Grafana Cloud.
Supporting modern cloud architectures
Optimize hybrid and multi-cloud deployments
Booking.com, one of the world’s leading digital travel companies, had a proprietary observability stack that consisted of multiple, disparate tools, redundant storage, and fragmented telemetry. While it served the company well for years, it couldn’t adequately support their complex multi-cloud and hybrid cloud infrastructure.
“We are a multi-cloud company,” said Murugesan Ramaiah, Solutions Architect at Booking.com, during a talk at ObservabilityCON on the Road in London. “Our applications are running on AWS, but also on Google, on-premises within Kubernetes, and on EKS. We have a machine learning platform, a gen AI platform, and a data platform. We are a technology-driven travel company, and there are a lot of telemetry agents.”
To modernize and centralize their observability strategy, the team moved to Grafana Cloud. They integrated Grafana’s centralized telemetry pipeline using OpenTelemetry, which simplified data gathering and enabled vendor-agnostic monitoring across environments.
For metrics and logging, Booking.com deployed Grafana Cloud Metrics and Grafana Cloud Logs, which now manage over 85 million metrics. The company also implemented Grafana Cloud Profiles to gain real-time visibility into application performance, helping them enhance both the customer experience and application performance.
“The reason we chose Grafana Labs is because they align with our strategy — they natively support OpenTelemetry, and we want to work with somebody who built a product born in the cloud, for the cloud,” Ramaiah said.
Enable easier migration to Prometheus
At Kambi, they had a “pretty standard” setup for Graphite that was based on Python. As the leading independent provider of premium sports betting technology and services within the global regulated betting and gaming industry, Kambi had an infrastructure that included around 500 services feeding into an HAProxy that divided the load between six instances of carbon-relay. Carbon-relay nodes then forwarded it to the carbon-cache nodes, which stored the actual data as whisper files.
Soon, however, issues began popping up. Their disk space, CPU, and even RAM were running out. Kambi SRE Frank Stengård’s team also discovered that in Graphite, many metrics were being sent at more frequent intervals than they were actually stored at, and the values were zeros or mostly zeros. As Stengård put it: “The house was burning now. We needed to fix it.”
To battle their three-alarm fire, Stengård and his team decided to modify Hadrianus, their own open source application-aware firewall load-balancer, to send Kambi data in a mirror replica to a third-party provider. Since Kambi was already a Grafana OSS fan, they decided to test sending all of the production data straight to Grafana Cloud — and to their pleasant surprise, the hosted platform was able to handle their telemetry load.
The company also decided they wanted to use Prometheus instead of Graphite because of its more popular support and the fact that it worked better in Kubernetes. Grafana Cloud was also a good fit because it not only supports Graphite; it also enabled an easy migration path to Prometheus, which the team did over time.
Watch Kambi’s deep dive into their Prometheus migration with Grafana Cloud.
Grafana Cloud is the easiest way to get started with metrics, logs, traces, dashboards, and more. We have a generous forever-free tier and plans for every use case. Sign up for free now!

