Send Lambda traces to Grafana Cloud with OpenTelemetry
AWS’s serverless technologies are popular because they provide cost effective scaling and great separation of concerns. However, observing serverless architectures like Lambda is challenging due to their transient nature and abstracted infrastructure. Unlike traditional systems with consistent hosts, serverless functions are ephemeral, often scaling rapidly and operating in isolation. This transient nature, combined with the inherent complexities of distributed serverless interactions, further complicate effective monitoring.
Fortunately, AWS recognized the growing need for monitoring early on and built integrated solutions such as Amazon CloudWatch and AWS X-Ray. Then, at some point they recognized their customers want to instrument apps and export observability data in a vendor-neutral way, primarily to avoid lock-in and ensure greater flexibility when users choose their observability tools and backends. The result was the AWS Distribution for OpenTelemetry (ADOT), which offers efficient, vendor-neutral instrumentation and ways to export the data not only to AWS offerings, but also to third-party vendors like Grafana Labs.
Lately, we’ve been hearing from lots of users who want to instrument Lambda functions with OpenTelemetry and send the data to Grafana using OpenTelemetry protocol (OTLP). You can take different approaches to send your OpenTelemetry data to Grafana. But if you’ve instrumented your applications using OpenTelemetry auto-instrumentation or SDKs, we recommend using Grafana Agent as an OTLP endpoint because it ensures both scalability and reliability as an outbound gateway. Consequently, all the OTLP data will flow towards Grafana Agent, which subsequently handles the task of writing to distinct telemetry databases hosted on Grafana Cloud.
In this article we’ll look into how you can use ADOT to export AWS Lambda traces to Grafana Cloud Traces with Grafana Agent as an OTLP endpoint.
For my sample Lambda application, I used Node.js but you can pick from other supported languages as well.
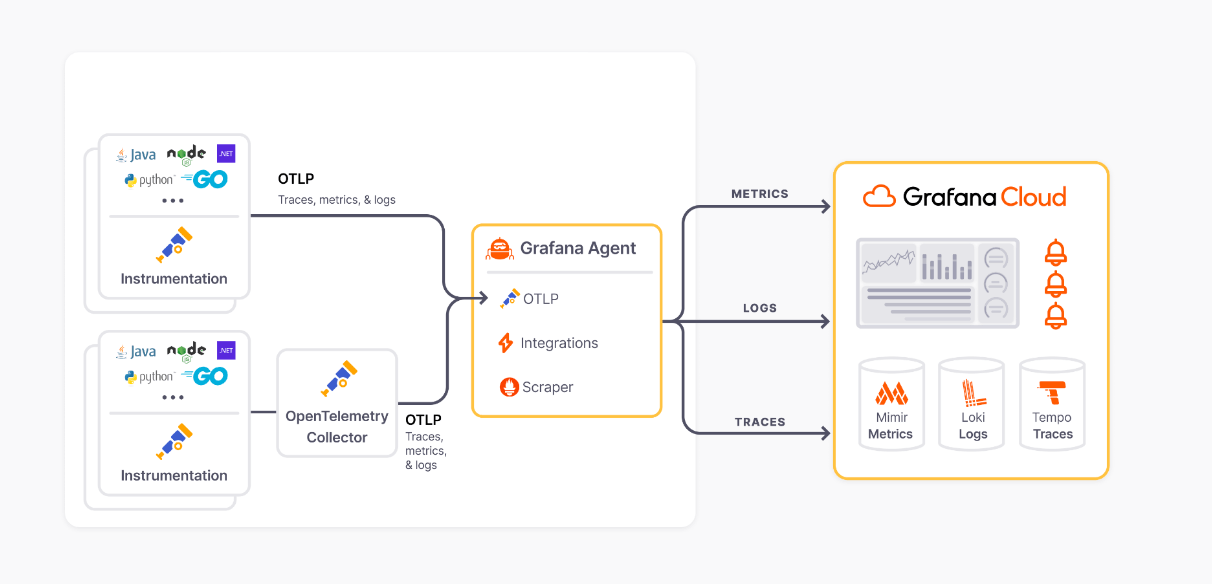
Below is an overview of the architecture we’ll be using in this setup:

Let’s get started!
Create a Node.js Lambda function from the Lambda UI
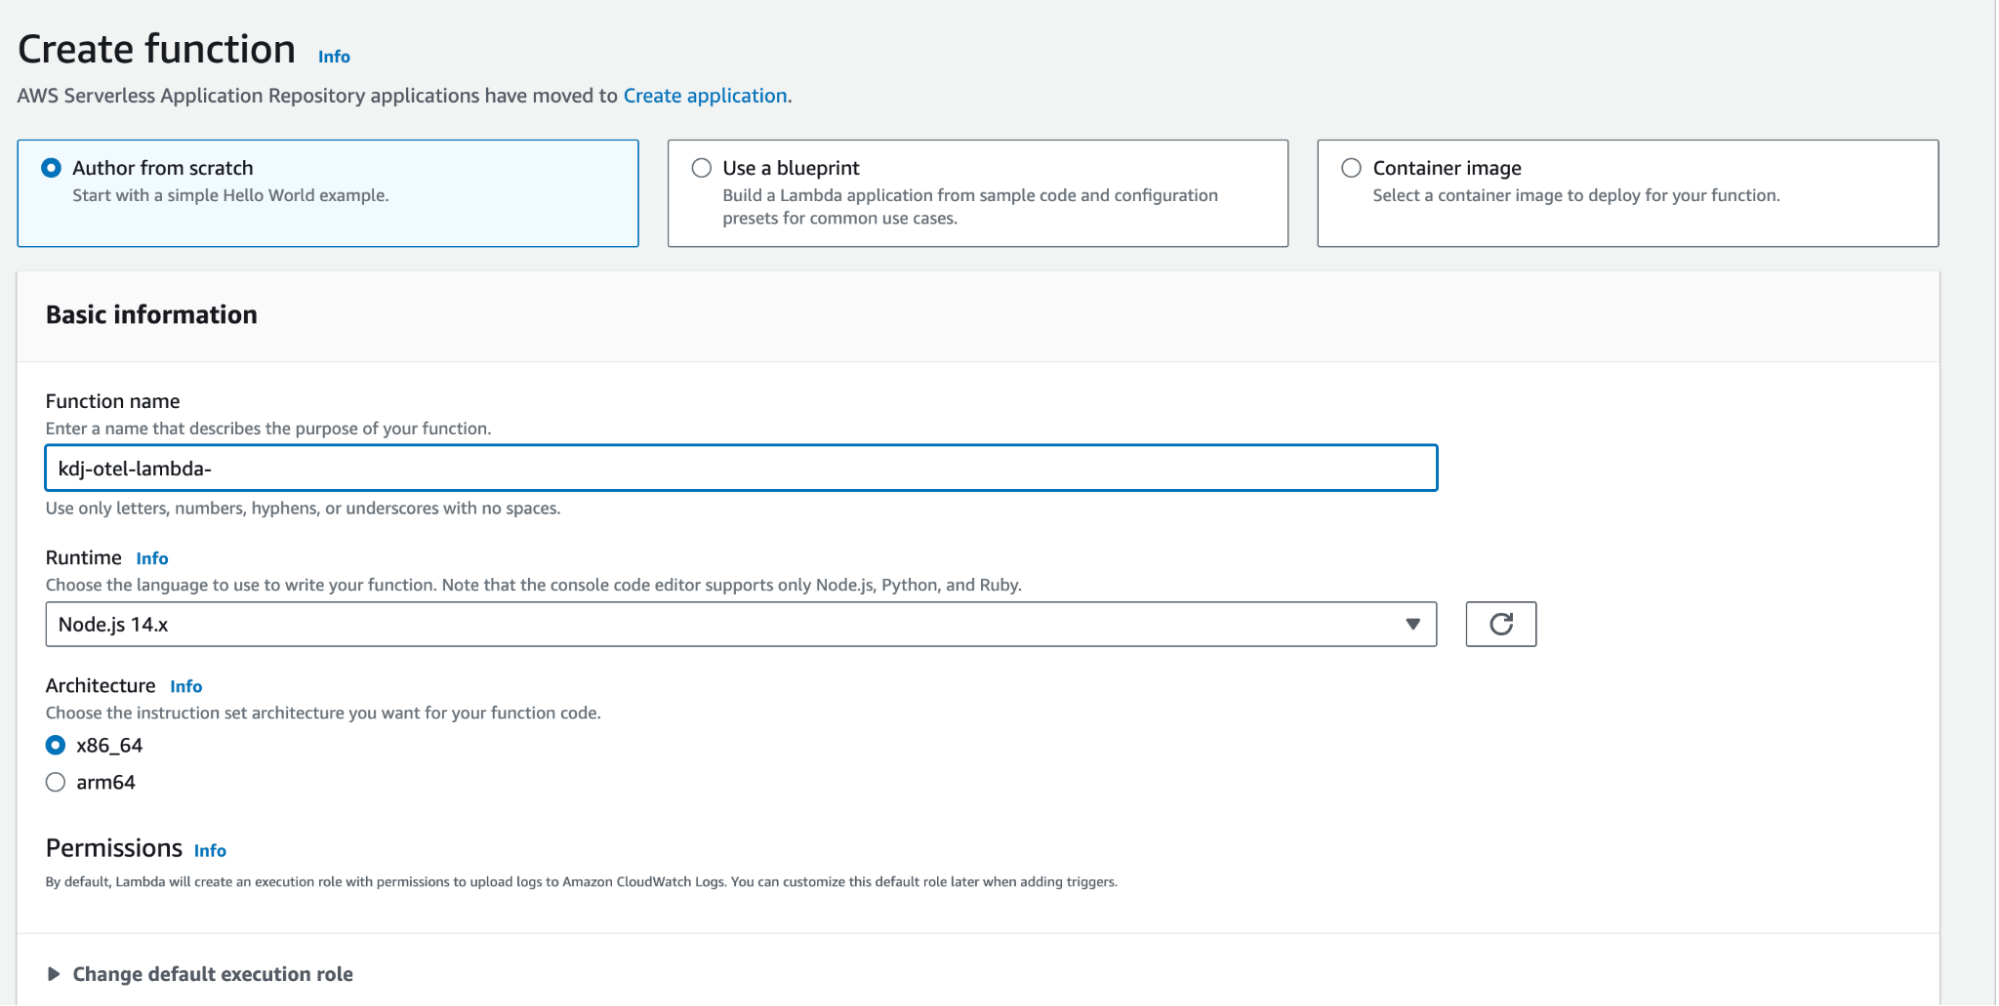
First, let’s create a sample Lambda function. Of course, you can use an existing blueprint or container image, but for the sake of simplicity, we’ll start from scratch. From the AWS Lambda UI, create a new Lambda function and enter the necessary information, including name, runtime, and architecture. As you can see from the screenshot below, we’re using Node.js 14.x, but as we’ve already discussed, pick the language that works for your needs.
Add instrumentation to our Lambda function
For AWS Lambda, the established deployment pattern is to add a layer that contains auto-instrumentation technology and then use the contents to wrap the handler. You can use the AWS_LAMBDA_EXEC_WRAPPER environment variable to simplify configuration.
Please refer to the ADOT documentation on Lambda with Node.js to learn more about the required Amazon Resource Name (ARN) for the ADOT Lambda layer in your region.
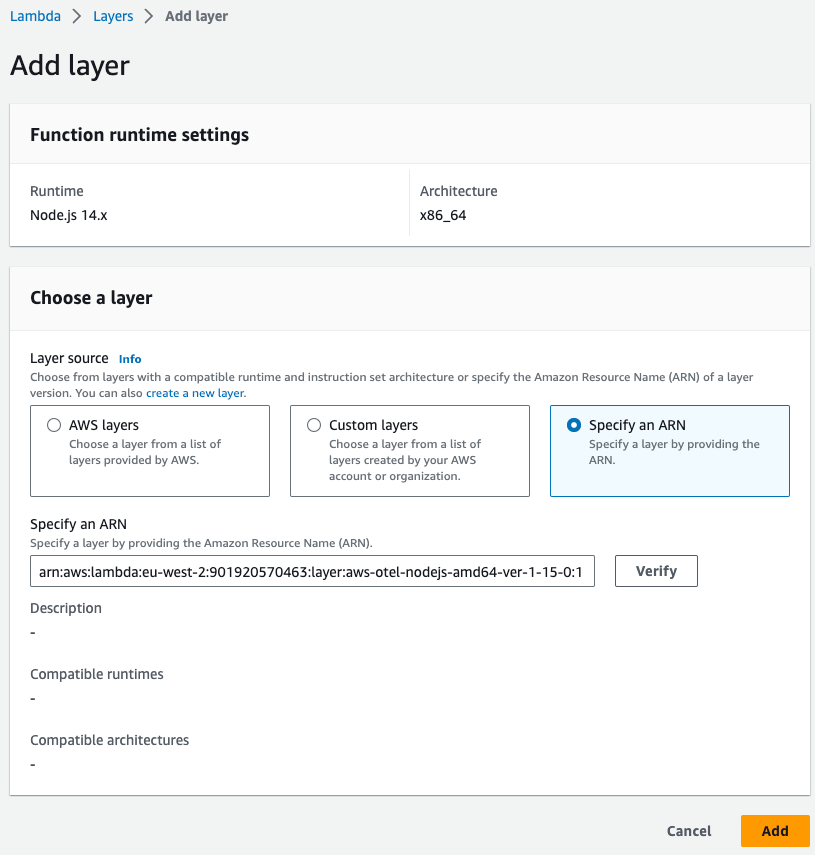
Our Lambda function will be in the eu-west-2 region and executed as amd64. I used this layer ARN:
arn:aws:lambda:eu-west-2:901920570463:layer:aws-otel-nodejs-amd64-ver-1-15-0:1How you add a Lambda layer to a function depends on the way you are managing it. We could use AWS CloudFormation or add it from the UI. For simplicity, I used the “Add layer” option present in the Lambda function interface.
Deploy and configure Grafana Agent as an OTLP endpoint
A standout feature of Grafana Cloud is its integrations, which streamline the process of setting up Grafana Agent to relay telemetry data back to Grafana Cloud. There’s even an OpenTelemetry integration that simplifies the installation and configuration of Grafana Agent to act as an OTLP endpoint.
To put this into action, I launched a Debian EC2 instance in the same region as my Lambda function. From there, simply follow the steps outlined in the integration guide.
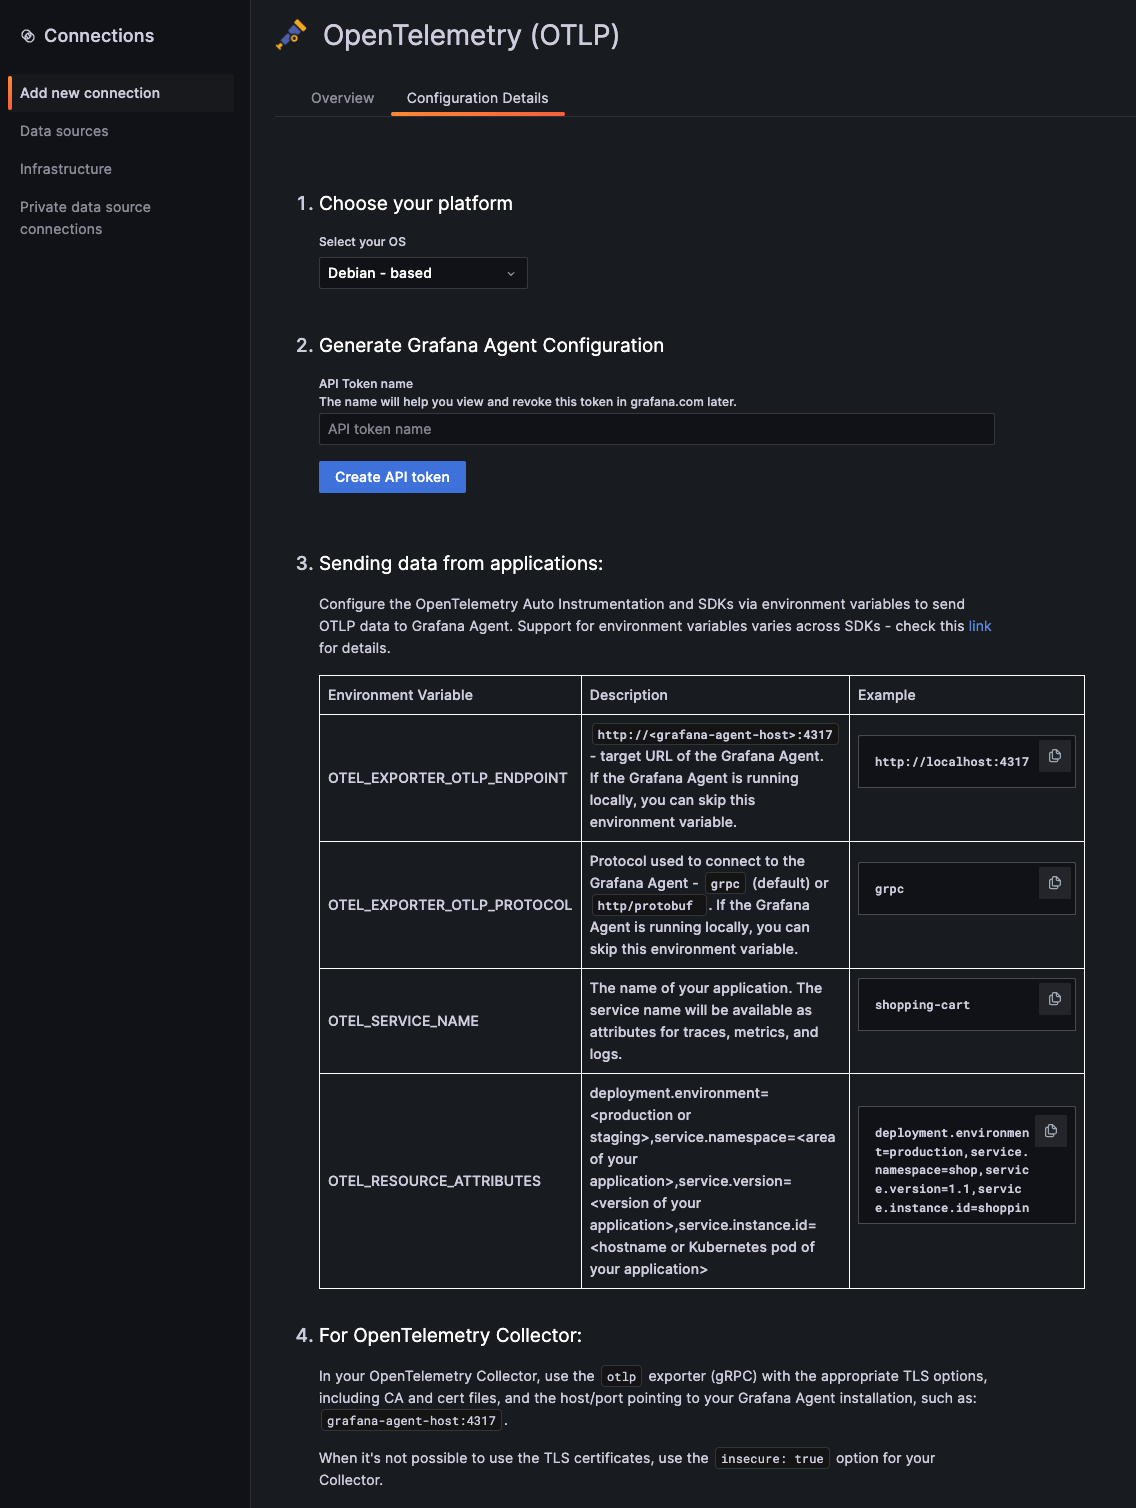
Now, we have our Grafana Agent up and running and configured to relay OTLP data to Grafana Cloud.
Environment variable for our Lambda function
Back to our Lambda function UI, we need to add some environment variables to our Lambda collector to control the behavior by going to Configuration > Environmental variables. Here’s a rundown of the potential variables you might want to configure.
| Environment variable | Value | Description | |
|---|---|---|---|
| AWS_LAMBDA_EXEC_WRAPPER | /opt/otel-handler | Required | To activate the code in the ADOT layer |
| OPENTELEMETRY_COLLECTOR_CONFIG_FILE | /var/task/config.yaml | Required | The path to your collector configuration file, prefixed with /var/task/ |
| OTEL_EXPORTER_OTLP_ENDPOINT | http://localhost:4318 | Required | Target URL for Grafana Agent |
| OTEL_EXPORTER_OTLP_PROTOCOL | http/protobuf | Required | Protocol used to connect to Grafana Agent |
| OTEL_SERVICE_NAME | lambda-service | Optional | The name of the service to be displayed in Grafana Cloud Traces |
| OTEL_LOG_LEVEL | debug | Optional | Log level |
| OTEL_PROPAGATORS | tracecontext | Optional | Configured as “tracecontext” to disable the default X-Ray and enable just the w3c trace context propagator |
| OTEL_TRACES_SAMPLER | always_on | Optional | Configured as “always_on” to enable the creation of traces even if there is no incoming trace context |
Add an OpenTelemetry collector configuration file to your function
The ADOT Lambda layers contain a build of the OpenTelemetry collector that is booted as a Lambda extension. This embedded collector will automatically receive our telemetry data from Lambda. We need to reconfigure this collector to send OTLP data to Grafana Agent.
The ADOT Lambda layer uses a “config.yaml” file, which needs to be adjusted to export data to Grafana Agent. To do so, we need to create a config.yaml file in the root directory of our Lambda function and paste the following configuration.
receivers:
 otlp:
   protocols:
     grpc:
     http:

exporters:
  logging:
  otlp:
    endpoint: "<grafa_agent_host>:4317"
    tls:
      insecure: true

service:
  pipelines:
    traces:
      receivers: [otlp]
      exporters: [logging,otlp]
    metrics:
      receivers: [otlp]
      exporters: [logging,otlp]
  telemetry:
    metrics:
      address: localhost:8888
When it’s not feasible to use TLS certificates, consider using the insecure: true option for your Collector, as you can see in the code snippet. However, it’s important to note that the recommended — and more secure — approach is to utilize TLS certificates.
Create a test and run it
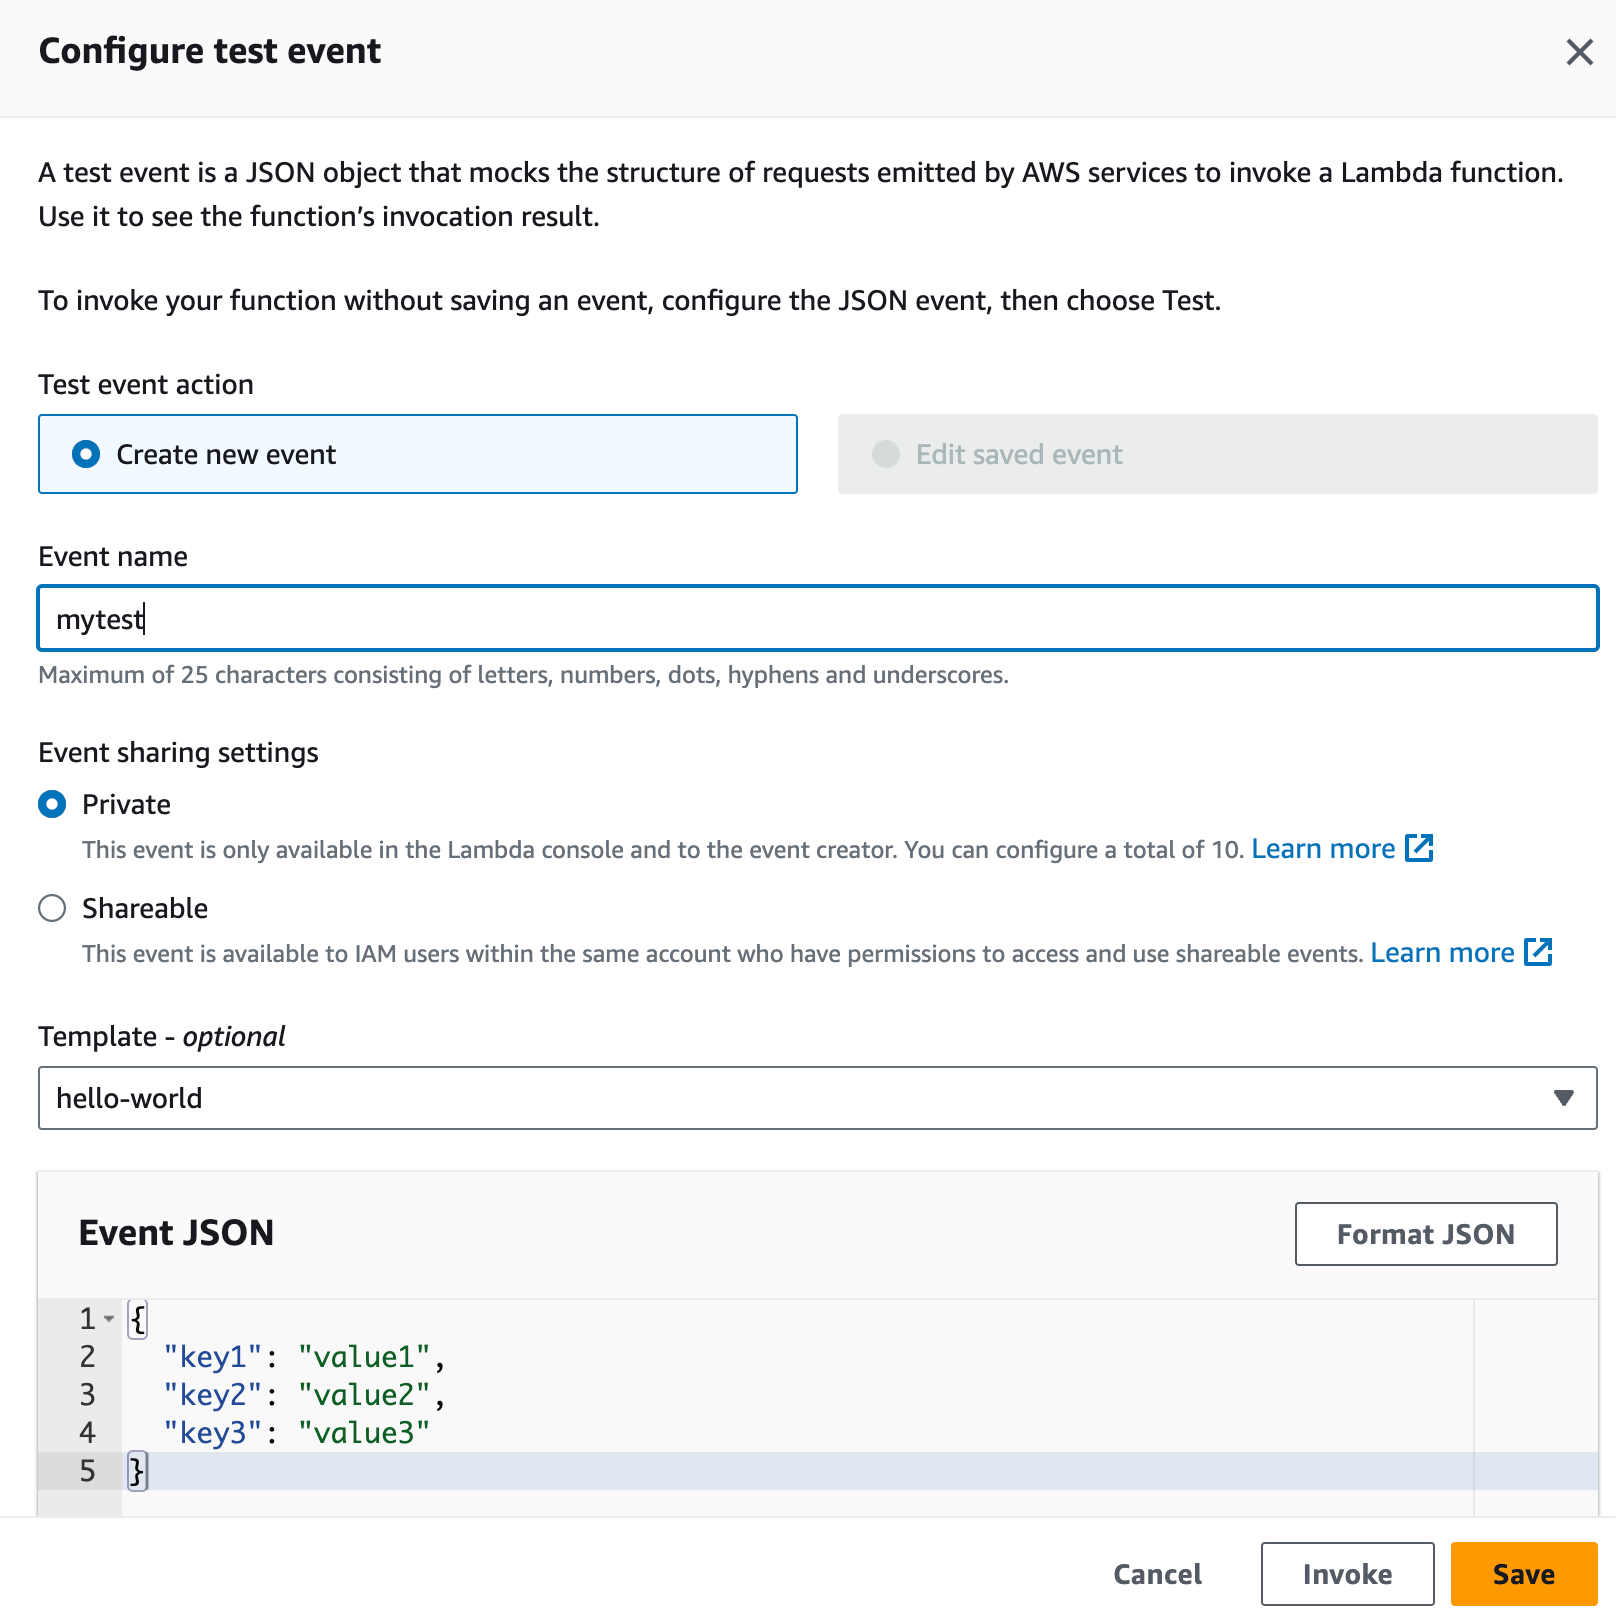
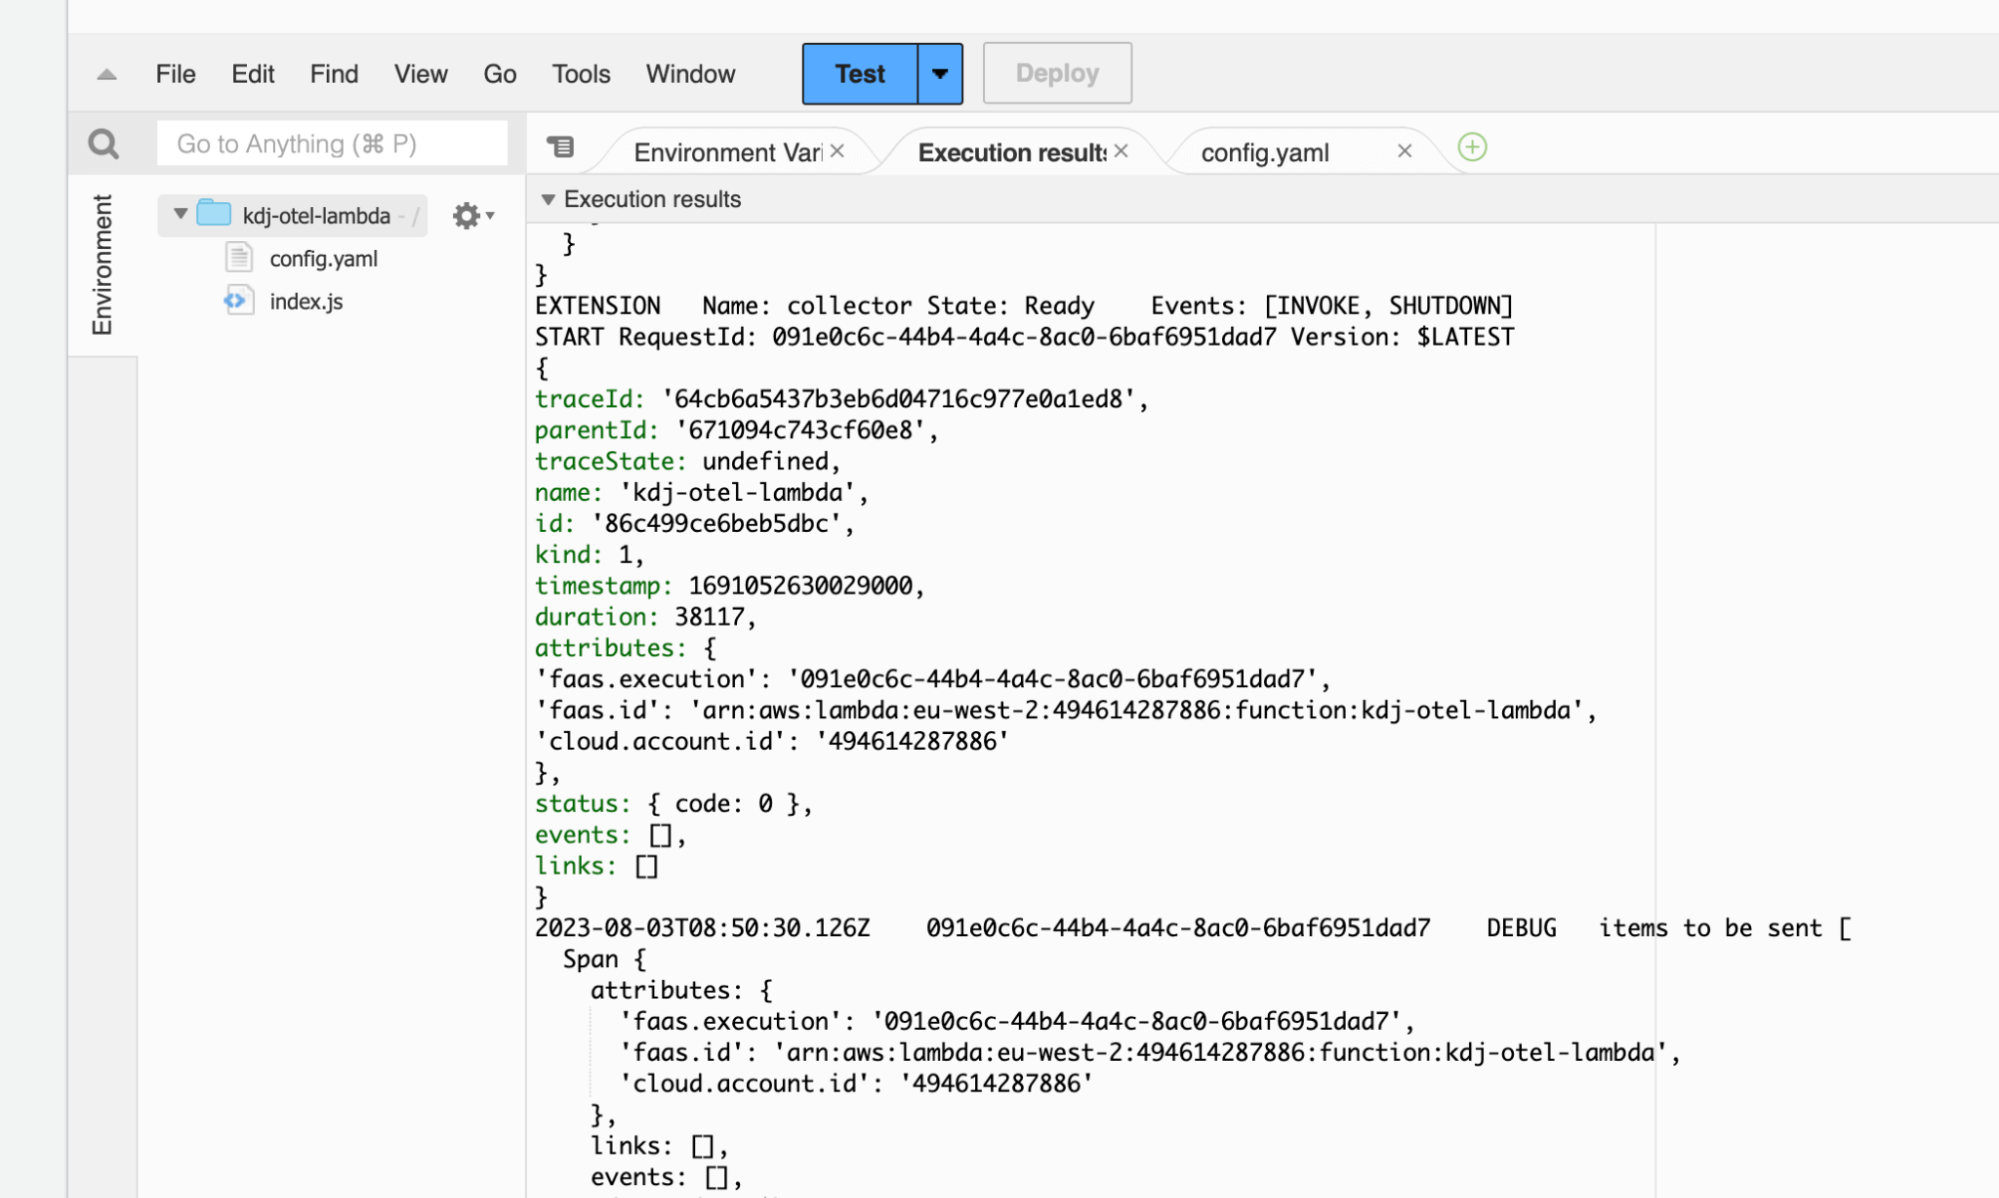
Now that everything is configured, we should run our Lambda function to generate some traces. Let’s create a test event:
Based on the output from our Lambda function’s execution, we can observe a traceId:
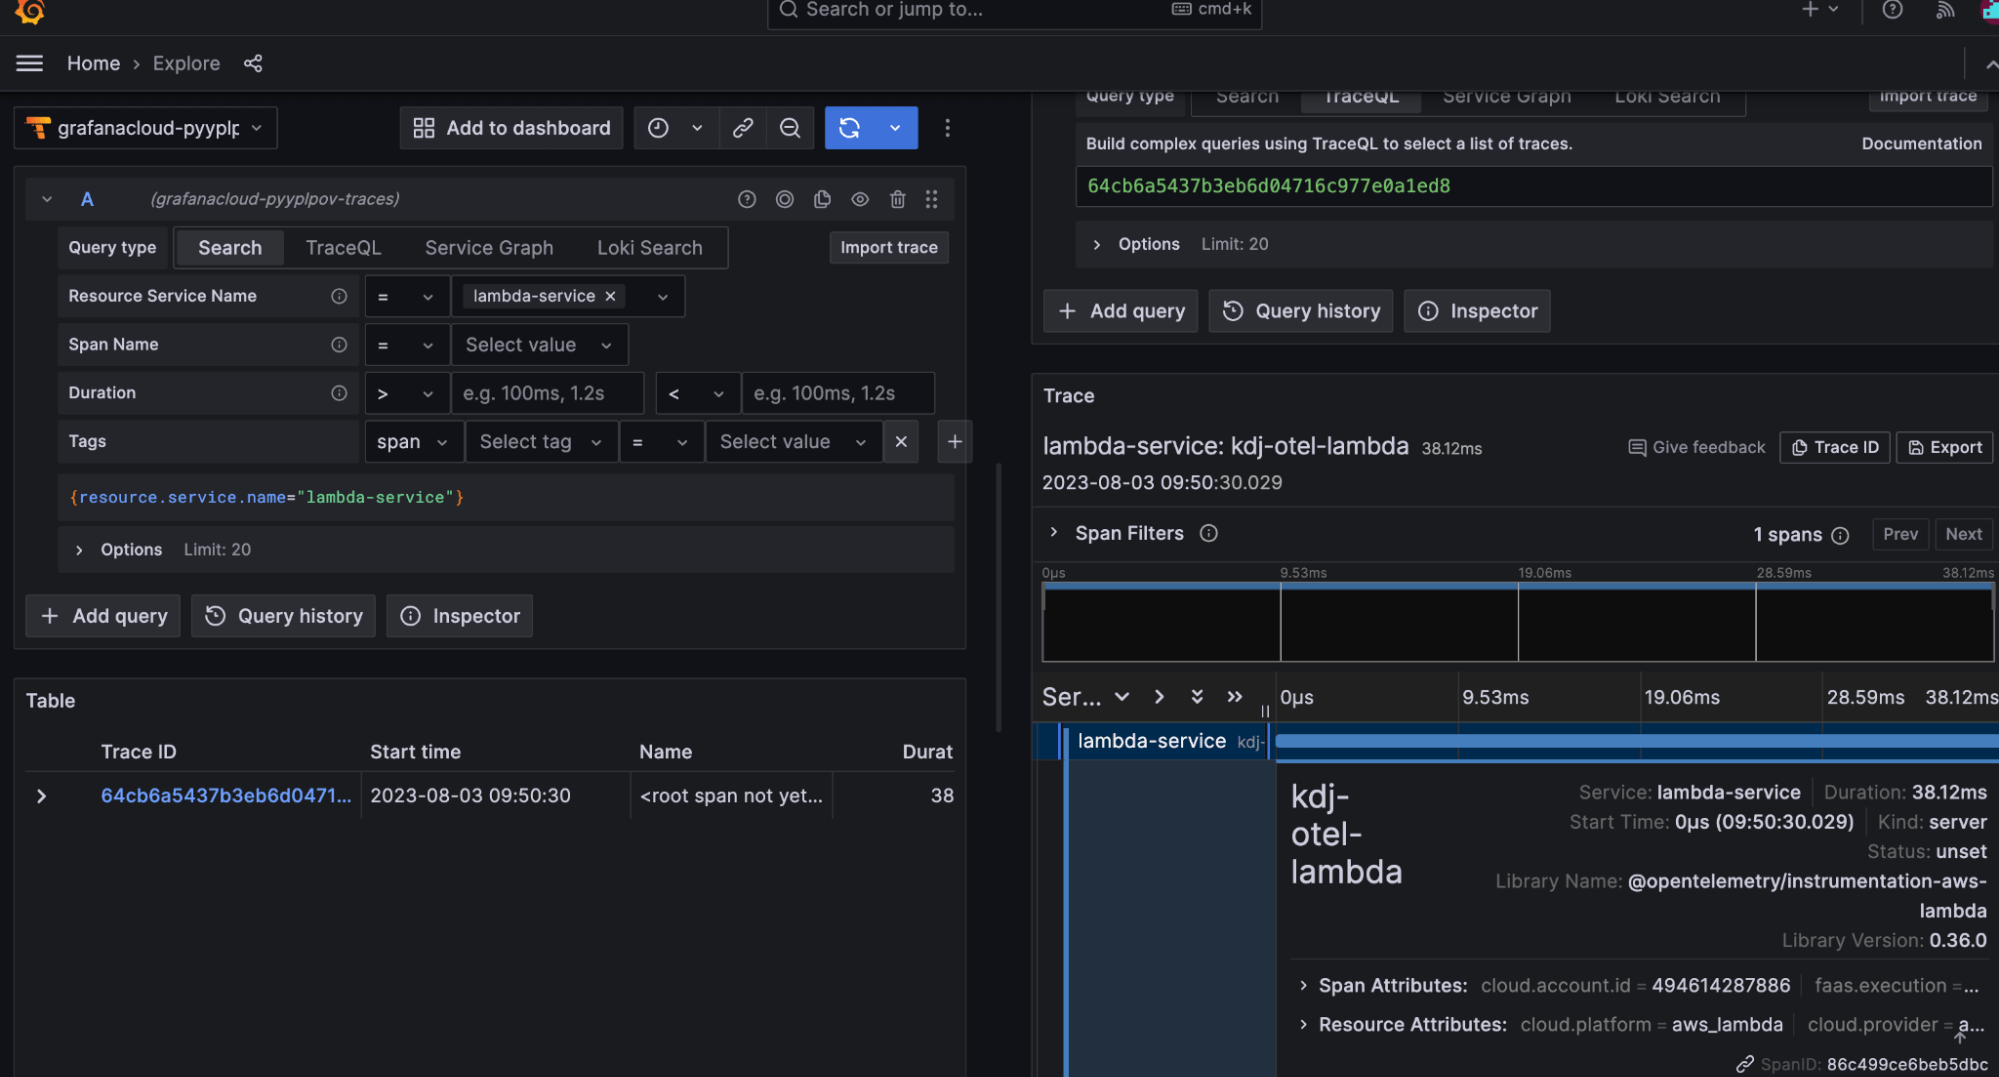
Now, we can use Grafana Cloud’s explore mode to examine the transactions. Simply filter by the desired service name (“lambda-service”) and inspect the transaction. The entire trace is created automatically by the contained OpenTelemetry instrumentation.
Let us know what you think
Stepping back, we’ve demystified the integration of AWS Lambda traces with Grafana Cloud Traces using Grafana Agent and OpenTelemetry. As you’ve seen, the process is both straightforward and efficient.
The serverless world can be very complex to oversee, but leveraging trace capabilities can offer valuable insights, enabling you to assess performance, spot bottlenecks, and optimize your serverless applications.
We’re committed to continuous improvement, and your feedback is invaluable in this journey. Please share your thoughts and experiences with us. You can find our team in the Grafana Labs Community Slack in the #opentelemetry channel.
The easiest way to get started with Grafana Cloud Traces is with our forever-free tier in Grafana Cloud, which includes 10k metrics, 50GB logs, 50GB traces, 50GB profiles, and more. Sign up for a free account today!