

How to embed Grafana dashboards into web applications
Note: This post originally published in October 2023 and was updated in May 2026 to include new methods and options for embedding Grafana dashboards.
Grafana dashboards are powerful and flexible tools for observing applications and infrastructure, so it’s no surprise we get a lot of questions from the community about how to embed them into their web applications.
Over the past few releases, we’ve developed a lot of options for how to do this in Grafana—but the choices can also lead to confusion about how they work, and when to use each approach.
This post walks through the available approaches, explains the security considerations of each one, and helps you determine which option best fits your use case.
We’ll also discuss a commonly requested use case: embedding dashboards into applications used by your own customers. Historically, securely embedding authenticated dashboards was not supported in Grafana Cloud. Today, there are new options available for Grafana Cloud customers who meet specific licensing and configuration requirements.
Follow along with a “four golden signals” sample dashboard
Note: Some of the features we discuss in this post differ between Grafana OSS and Grafana Cloud for security or configuration reasons. We will note these differences as we go.
If you want to follow along and see how the approaches in this blog actually work, we are going to use a sample dashboard on Grafana Play that is already accessible, so you can see what we’re doing and how it works.

Our sample dashboard is for the “four golden signals” (latency, errors, traffic, and saturation) used in many observability use cases. This could be the type of dashboard you reuse in other web apps. For example, you might have an internal IT portal where you want to display it.
So what are your options?

Using this sample dashboard as our reference point, we’ll cover three broad topic areas in the remainder of this blog:
- Methods of embedding
- How to configure Grafana to permit iframe embedding
- Security considerations and unsupported cases
Methods of sharing
There are four methods we’ll focus on for sharing Grafana dashboards in web apps—embedding private dashboards with authentication, links, snapshots, and externally shared dashboards. The steps and options involved will vary. While some of these methods can be enabled via the Share button at the top of a dashboard view in Grafana, embedding private dashboards requires additional steps.
Embedding private dashboards with authentication
Some organizations want to embed Grafana dashboards directly inside their own applications while ensuring that users must authenticate and only see the data they are authorized to access. This is a common use case for internal portals or SaaS platforms where data visualization needs to be surfaced to application users.
In these scenarios, dashboards or panels can be embedded in an application while authentication and access control are enforced by Grafana using your authentication platform. Because embedding authenticated dashboards requires careful security configuration, this option is typically implemented with guidance from Grafana Labs.
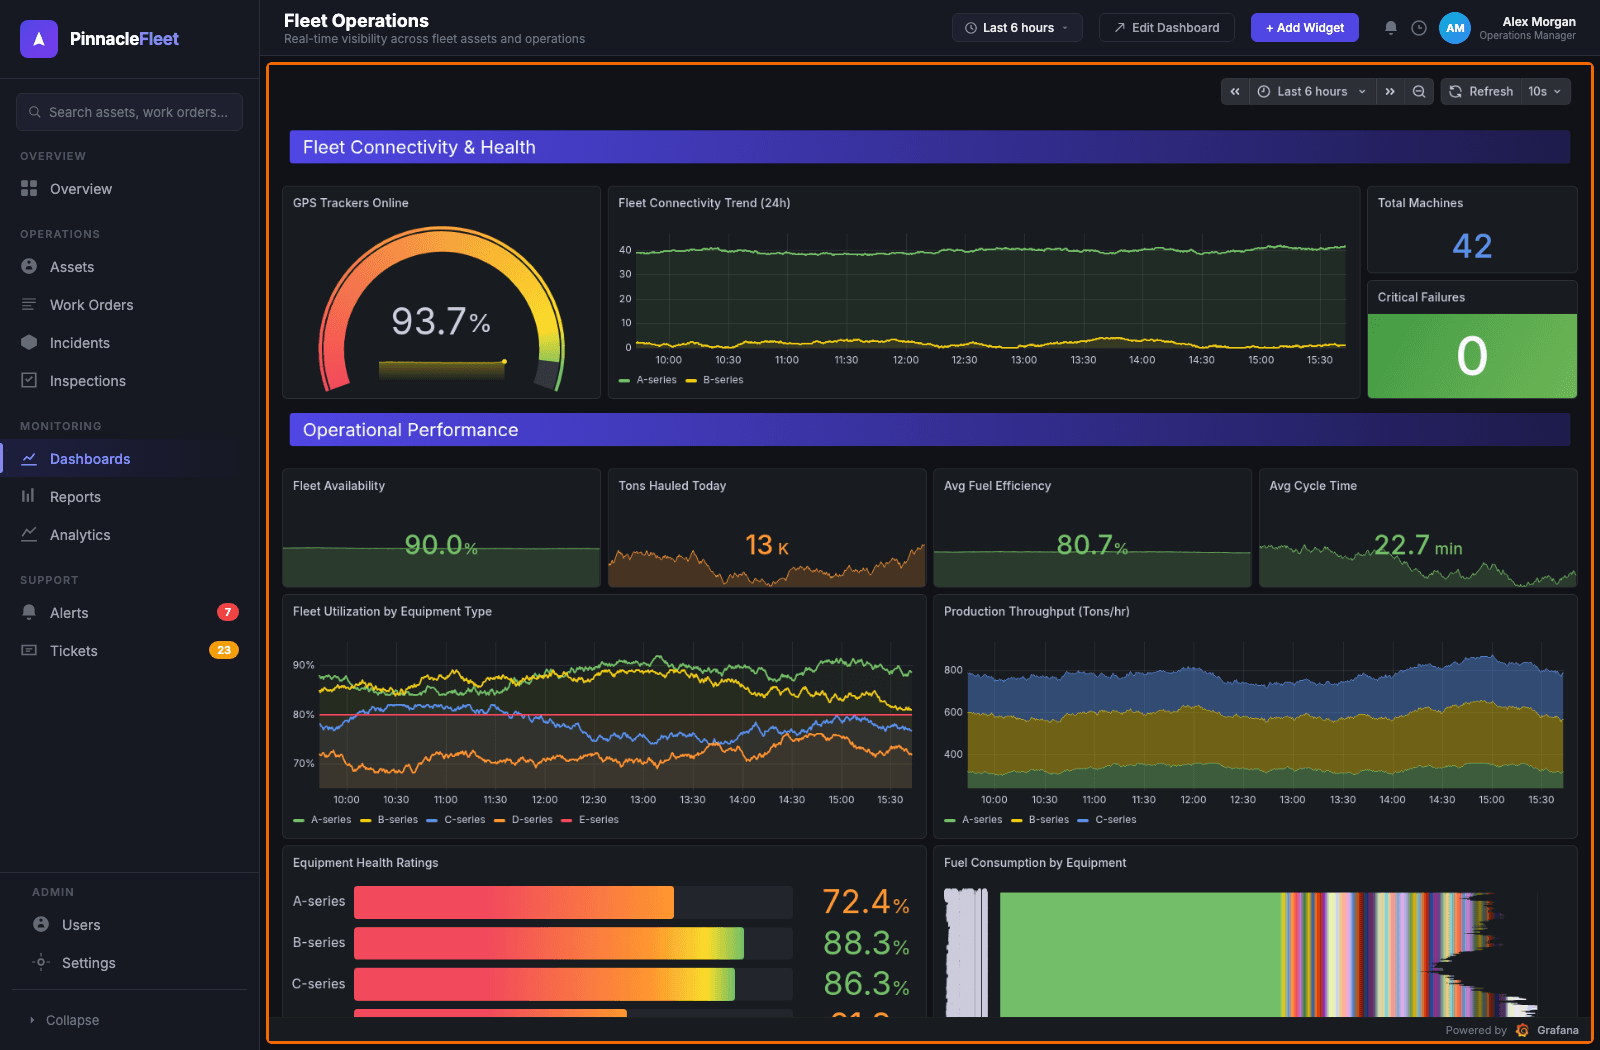
Example of an embedded Grafana dashboard inside a secure application, where authentication and access controls ensure users only see the data they’re authorized to view.
Pros of this approach include:
- Allows dashboards or panels to be embedded directly in your application while still requiring authentication
- Access control policies in Grafana continue to apply, ensuring users only see the data they are authorized to access
- Enables organizations to integrate visualization, monitoring, and observability features directly into internal tools, or customer-facing platforms via a Grafana Labs OEM partnership.
Cons include:
- Requires careful security configuration and coordination between the embedding application and Grafana
- Not enabled by default and may require additional contractual agreements and setup
- Implementation details can vary depending on authentication architecture and deployment environment
Availability
This feature is supported in Grafana OSS, Grafana Enterprise, and Grafana Cloud. Grafana OSS and Grafana Enterprise can enable it through their own configurations; Grafana Cloud users should contact their Grafana Labs account team to learn more about eligibility and setup requirements.
Links
Links are the simplest approach to embed Grafana dashboards into an application, and they’re just what they sound like.
Grafana generates a link to the dashboard, as well as a number of options to choose from, such as the theme, whether to lock the time range, and so on.

Pros of links include:
- They’re easy, fast, and customizable
- You can link to dashboards that require authorization without passing that authorization. When the user clicks the link, they may be prompted to log in to ensure the security of your dashboard.
Cons include:
Links don’t count as “true embedding” because the dashboard is just like any other web link; the Grafana experience isn’t fully embedded into the application.
Availability
This feature is supported in Grafana OSS, Grafana Enterprise, and Grafana Cloud.
Snapshots
Publishing a snapshot is a way to create a moment-in-time, interactive dashboard application that is publicly accessible.
The result is essentially a mini app that can be embedded in another site. You can generate these snapshots to be hosted by Grafana Labs, or you can host the snapshots directly on your own Grafana instance.

Pros of snapshots include:
- Easy to build and fully interactive
- Can be deleted automatically
- Don’t create underlying hits on your data sources or excess traffic/load
If you publish snapshots to your local Grafana instance, you may have other controls (such as firewalls and network enclaves) that may somewhat limit distribution of the snapshots, rather than publishing them on the internet.
Cons include:
Snapshots are public, and you still need to include allow_embedding = true in the configuration in order to embed them in another page.
Availability
Snapshots are available in Grafana Cloud and Grafana OSS.
Externally shared dashboards
Externally shared dashboards (previously known as public dashboards) allow you to share your Grafana dashboard with anyone without requiring access to your Grafana organization.
In order to use this feature in Grafana OSS or Grafana Enterprise, you must set the feature toggle described in the documentation.
If you’re using Grafana Cloud, you need to contact support to request they enable this for you, otherwise you will not see this option in your sharing menu.
This feature also includes the ability to share with specific people via email (previously known as email sharing). Available in Grafana Enterprise and Grafana Cloud, this option sends recipients a one-time-use link valid for one hour. After the link is used, the viewer retains access to the dashboard for 30 days.
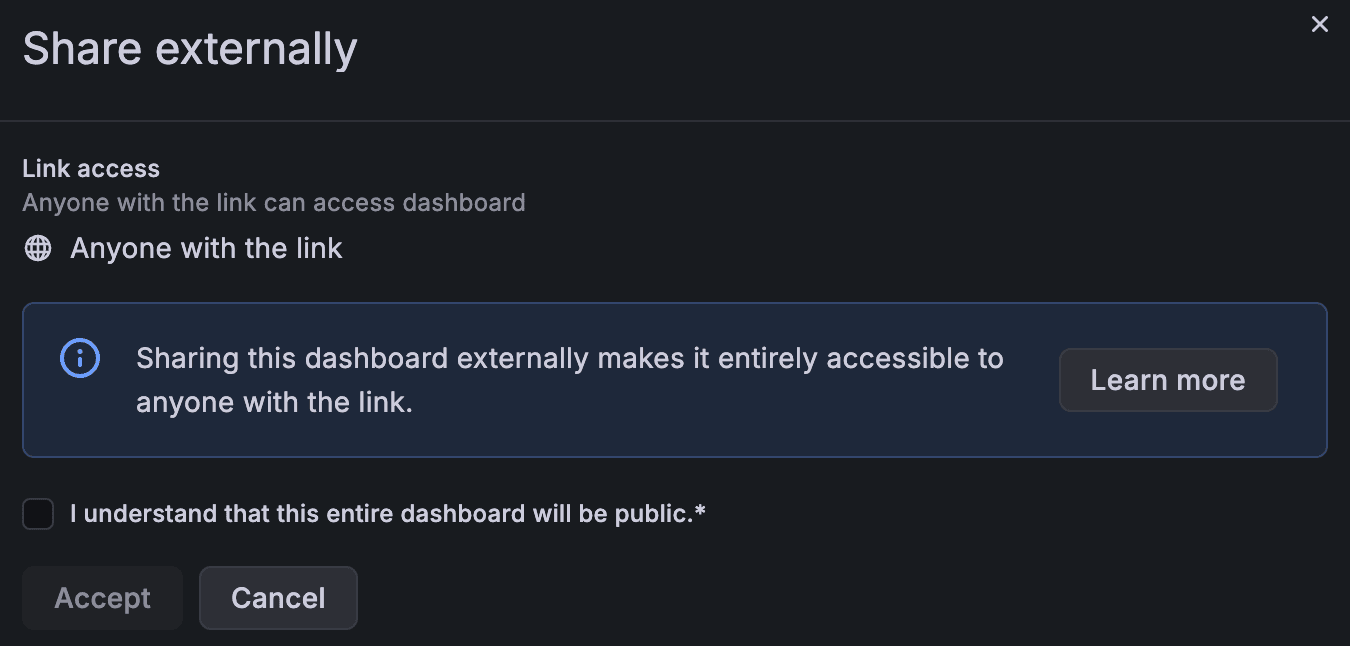
Pros of externally shared dashboards include:
- You can share a fully interactive dashboard for any time range, not just a predetermined one.
Cons include:
- Anyone with the link has full access to the data, including the ability to adjust past time ranges in the dashboard.
- Reloading the dashboard will trigger extra queries against your data sources, which can cause load.
Availability
You can enable externally shared dashboard in Grafana OSS and Grafana Enterprise by using the feature toggle mentioned above. To enable the feature in Grafana Cloud, please contact your support team.
Note: Grafana also supports the Export option, which you’ll see in the sharing menu, to download a JSON version of a dashboard. While you can't use this feature to directly embed a Grafana dashboard within an application, it is helpful for sharing data with a different Grafana instance.
Grafana settings and security considerations
The embedding options above fall into two broad categories, in terms of security and configuration:
- Authenticated embedded dashboards
- Sharing-based approaches (links, snapshots, and externally shared dashboards)
These two categories behave differently in terms of browser behavior, authentication, and Grafana configuration, so it’s helpful to discuss them separately.
Security considerations for authenticated embedded dashboards
Embedding authenticated dashboards introduces additional considerations because the embedded content must verify the identity and permissions of the user viewing the dashboard.
In this scenario, dashboards or panels are embedded directly inside another application while Grafana continues to enforce authentication and authorization controls.
This type of embedding typically involves coordination between the embedding application and Grafana to ensure that user identity can be securely verified and that only authorized users can access the dashboard.
Because this configuration requires careful security review, it is not enabled by default in Grafana Cloud environments.
For qualified Grafana Cloud customers who implement authenticated embedding, Grafana Labs works with the customer to configure the required security controls as part of the enablement process. This typically includes:
- Restricting which applications can embed dashboards by explicitly defining the allowed embedding domains or origins.
- Validating user identity using secure tokens or similar authentication mechanisms so Grafana can verify the user requesting the embedded content.
- Ensuring Grafana roles and permissions are correctly mapped so embedded users only see the dashboards and data they are authorized to access.
- Limiting the lifetime and scope of credentials used for embedded sessions to reduce the risk of token misuse.
- Reviewing the overall architecture and security configuration to ensure the embedded dashboards follow Grafana Cloud security best practices.
These controls help ensure that embedded dashboards can only be loaded from approved applications and that Grafana continues to enforce access control policies for the underlying data.
As with any embedding scenario, organizations should carefully evaluate the security implications of their architecture and ensure that authentication, access control, and browser security protections are properly configured. The guidance below explains the main considerations, recommended patterns, and practical controls you should adopt when embedding authenticated dashboards.
Why extra controls matter
When dashboards are embedded and remain authenticated, several new considerations come into play:
- Token usage in URL queries: Tokens passed in URLs are visible in browser history, logs, analytics, and screenshots. If a JWT appears in a URL it may be recorded by web servers, CDNs, or analytics tools and then reused by an attacker until it expires. For that reason, URL tokens are considered higher-risk and should be avoided unless mitigations are applied.
- Clickjacking and framing controls: Browsers enforce framing rules to prevent UI redress attacks. Embedding requires explicit, secure allowance from Grafana so an external site cannot frame a tenant’s Grafana UI without permission.
- Excessive permissions: Embedded sessions must be limited to what the viewer actually needs (usually read-only) so that embedding cannot be used to alter tenant configuration or data.
- Man-in-the-middle (MITM) and transport risk: Tokens and cookies must be protected in transit (TLS on all legs) to avoid interception. The proxy-to-Grafana leg must validate Grafana’s certificate to prevent upstream MITM.
Recommended authentication and deployment patterns
For Grafana Cloud, a reverse-proxy/header-based approach is recommended as the most secure option. A short-lived JWT-based URL query parameter is available as fallback only when a proxy is not feasible.
- Reverse proxy (recommended): Run a TLS-terminating reverse proxy (for example, nginx) in the embedding application’s environment. The proxy authenticates the user with your identity provider (IdP) or application, then passes a short-lived, Grafana-signed viewer credential to Grafana in an HTTP header. Because the token travels in headers rather than query strings, it does not appear in browser history or many server logs.
- JWT viewer tokens (acceptable as a fallback with strong mitigations): If you must use tokens rather than a proxy, use signed JWTs that Grafana can validate via a JWKS endpoint (Grafana requires access to a JWKS endpoint so it can verify token signatures) and make these tokens short-lived (minutes). Please note that tokens in URLs will be recorded by servers and browsers. If tokens appear in URLs, make sure to monitor and limit their use.
Concrete configuration and hardening guidance
Follow these practical rules when implementing authenticated embedding:
- Allow embedding only from explicit HTTPS origins: Grafana Cloud uses a tenant-scoped Content Security Policy (frame-ancestors) to list exact origins allowed to embed dashboards. This approach utilizes HTTPS origins (for example, https://portal.example.com). Because frame-ancestors are part of HTTP responses, the list should be minimal and explicit.
- Default to read-only viewer role: Embedded sessions should map to read-only permissions (Viewer). If your use case requires other roles, map IdP claims to Grafana roles carefully and only after security review.
- Short token lifetimes and caching: Use very short token lifetimes (minutes). Grafana Cloud supports a cache_ttl so that token expiry is respected while avoiding excessive IdP calls; design your proxy or token-minting service to work with short cache windows (1-5 minutes is recommended).
- TLS everywhere: Terminate TLS at the browser→proxy leg and require the proxy→Grafana Cloud leg to validate Grafana’s TLS cert (for nginx, proxy_ssl_verify on). This prevents token interception and upstream MITM risks.
- Cookie handling: If cross-site cookies are required, be cautious: relaxing SameSite weakens Cross-site Request Forgery (CSRF) protections. Default to header-based tokens or same-site deployments where possible.
- Rate limiting and abuse protection: Add rate limits on auth endpoints (tight limits) and on the proxy path to Grafana Cloud (more permissive) to slow brute-force or replay attempts.
- Logging and token redaction: Ensure your logs do not persist bearer tokens. If tokens are used in URLs or headers, configure log redaction and avoid recording full request lines that might include tokens.
- Key management: A JWKS endpoint for Grafana Cloud to validate signatures is required. It’s also recommended to establish a key rotation process so Grafana Cloud can pick up new public keys without downtime.
Security considerations for links, snapshots, and externally shared dashboards
The first three options—links, snapshots, and externally shared dashboards—all rely on Grafana’s built-in sharing capabilities. In these cases, the dashboard is either opened directly in Grafana (via a link) or shared as a public resource that does not require authentication.
Because these approaches do not require embedding an authenticated Grafana session inside another application, they avoid many of the browser security challenges involved in cross-origin requests.
For example:
- Links simply open the dashboard in Grafana itself, so the user interacts directly with the Grafana application.
- Snapshots create a static, shareable version of a dashboard that no longer queries underlying data sources.
- JSON exported dashboards are intended for importing into another Grafana instance rather than embedding directly.
These options work well for sharing dashboards externally because they avoid the complexity of embedding authenticated sessions inside another application.
Browsers enforce strict rules around these requests to prevent attacks such as clickjacking or cross-site request forgery. For this reason, Grafana includes configuration options that control when dashboards can be embedded and how cookies are handled.
In order to make this work, one setting is required: You must set allow_embedding to true, or Grafana will reject embedding requests to mitigate the risk of clickjacking. Users should be aware of those risks, and why the default is false, before changing that setting.
For self-managed Grafana deployment, administrators can enable iframe embedding in the initialization file by setting:
allow_embedding = true
This disables Grafana’s default protection against clickjacking attacks and allows dashboards to be rendered inside iframes. This also would include public dashboards that are exposed through a public URL that can optionally be embedded using an iframe.
However, when using iframes to embed publicly accessible dashboards, it’s still important to consider browser security behavior. When a page loads an iframe, the browser makes a secondary request to the site hosting the embedded content. This is called a cross-origin request because the browser is requesting content from another site.
Because of the associated security risks, the default value is false, and administrators should understand the implications before enabling it.
When embedding dashboards in this way, it’s also important to consider how cookies are shared between sites. Grafana includes a cookie_samesite configuration option that controls this behavior. The default value is lax, which works when the embedding application and the Grafana instance share the same site.
For example:
grafana.o11y.party
portal.o11y.party
In this case, both services share the o11y.party site.
While it is technically possible to disable the cookie_samesite protection to support cross-site embedding, this approach weakens protections against cross-site request forgery and information leakage. For that reason, it is generally not recommended.
Final notes on security
These approaches are subject to change over time as the security landscape evolves.
Self-managed Grafana environments provide more customization options, as organizations can choose their own risk tolerance, while managed platforms like Grafana Cloud must adhere to stricter security practices. For that reason, some embedding capabilities are limited or require additional safeguards in managed environments.
To review Grafana Cloud security and compliance details, visit trust.grafana.com.
Wrapping up
Each of the approaches covered in this post—links, snapshots, externally shared dashboards, and embedding private dashboards with authentication—involves different tradeoffs around data freshness, interactivity, and security.
For ad-hoc sharing where simplicity is the priority, links, snapshots, and externally shared dashboards are likely the easiest paths. You can read more about these options in our dashboard sharing documentation.
When security is a priority, or your use case involves internal portals or customer-facing applications, embedding private dashboards with authentication is the recommended approach. This option keeps Grafana's access controls in place and ensures users only see the data they're authorized to view.
To learn more and ask questions about which approach is best for you, reach out on our Grafana community site.
Grafana Cloud is the easiest way to get started with metrics, logs, traces, and dashboards. We have a generous forever-free tier and plans for every use case. Sign up for free now!

