Unify and query private network data in Grafana Cloud: Private Data Source Connect is now GA
You may be ready to make the move to Grafana Cloud, but securely querying private data has been a blocker. If you wanted to query a network-secured data source like a MySQL database or an Elasticsearch cluster that is hosted in an on-premises private network or a Virtual Private Cloud (VPC), you needed to open your network to inbound queries from a range of IP addresses.
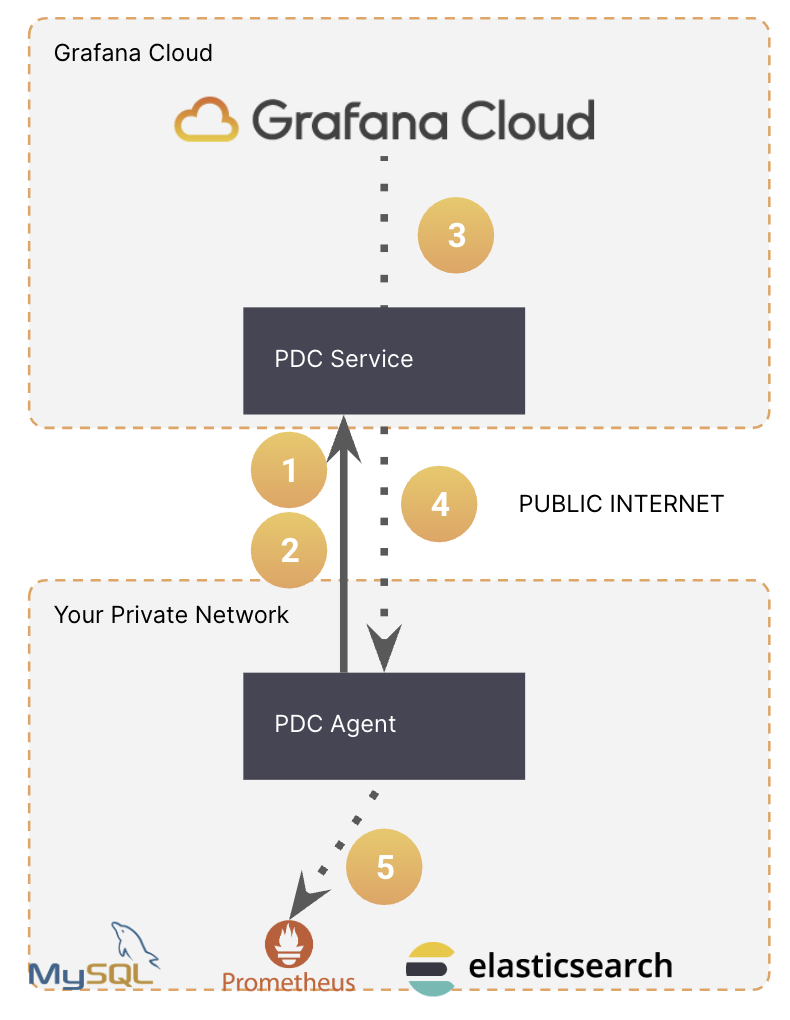
With Private Data Source Connect (PDC), which is now generally available to all Grafana Cloud users, you can now query your network-secured data sources from Grafana Cloud. By simply deploying the PDC agent, you will establish a secure link between your VPC or on-premises network and your Grafana Cloud stack. This eliminates the need to allowlist a wide range of IP addresses and allows your teams to securely visualize and alert on your private data.
There’s supposed to be a video here, but for some reason there isn’t. Either we entered the id wrong (oops!), or Vimeo is down. If it’s the latter, we’d expect they’ll be back up and running soon. In the meantime, check out our blog!
“External connectivity poses a significant security issue. Private Data Source Connect has been a good response to these challenges. Without PDC, integrating with Grafana Cloud could risk exposing important telemetry data,” says Boris Gdalevich, Head of Observability and Event Management at a multinational investment management company. “With PDC’s capabilities, when we use Grafana Cloud, we ensure there’s a barrier against unauthorized access to our sensitive data. This isn’t a concern limited to our organization; it’s a broader industry issue."
One that was echoed at Infodation, which also implemented PDC to unify their data sources in Grafana Cloud. “Integrating PDC with Grafana Cloud has significantly enhanced our operational efficiency, providing our development teams with increased autonomy and control," says Infodation Cloud Engineer Jelle Keppels.
Private Data Source Connect also makes it possible for users to take advantage of all the tools available on our hosted observability platform, such as Grafana Cloud Profiles for continuous profiling, Grafana Cloud k6 for performance testing, and more.
“Grafana Cloud has helped us centralize tools we previously utilized in isolation, from alert management to logging, further simplifying our processes,” adds Keppels. “We primarily adopted PDC for its robust security features, which have now allowed us to use the full potential of Grafana Cloud.”
How to query private network data from Grafana Cloud
So, how does this all work?
When you sign into Grafana Cloud (if you don’t already have an account, you can sign up for free today) you’ll find Private Data Source Connect within the Connections section. Then simply follow the instructions to deploy the PDC agent within your network.
The PDC agent establishes an SSH tunnel, facilitating data transmission between your private data sources and Grafana Cloud. The SSH client uses reverse dynamic forwarding, acting as a SOCKS proxy to direct queries to Grafana. When additional encryption protocols like HTTPS are supported by the data source, the data benefits from end-to-end encryption.
A single PDC agent will work with multiple data sources within the same network, but you have the ability to limit the hosts or IP addresses that can be accessed from Grafana Cloud.
Since we first rolled out the public preview of PDC in June, we have continually improved the reliability and availability of the service, such as implementing rolling updates and failover to increase the efficiency of queries running through PDC. We’ve added support for new data sources as well, including MySQL, PostgreSQL, and AWS CloudWatch.
With this general availability release of PDC, we’ve also improved the functionality so that you can connect a single Grafana Cloud stack to multiple private networks (for example, an on-prem network and a VPC hosted on any public cloud provider). In other words: You can now pull all of your observability data together into a single Grafana Cloud stack to visualize and query.
“With the PDC agent, we found a seamless solution to securely integrate [into our stack] without exposing our setup to the internet,” says Jiří Polášek, Build & Release Engineer in DevOps at Notino. “The initial setup was straightforward.”
The future benefits are also clear. Says Polášek: “As we transition to Grafana Cloud, especially its comprehensive Kubernetes Monitoring solution, we’re also excited about its extensive alerting system. Combined with Grafana OnCall, we’re confident we’ll be able to proactively detect and address issues even before our developers notice them.”
What is the difference between PDC vs. AWS PrivateLink?
AWS PrivateLink is a service that provides the option for private connectivity between VPCs, supported AWS services, and your on-premises networks, without exposing your traffic to the public internet. This AWS integration not only reinforces security, but it also offers a potential reduction in network egress fees.
So what is the difference between PDC in Grafana Cloud and AWS PrivateLink?
PDC is used to query your data sources, such as SQL or MongoDB databases, Elasticsearch clusters, and self-hosted Splunk instances, from Grafana Cloud in order to visualize and alert on their data.
AWS PrivateLink can be used to send telemetry — metrics, logs, traces, and profiles — from your AWS VPC to a Grafana Cloud stack that is also hosted on AWS.
To learn more about using AWS PrivateLink with Grafana Cloud, go to our related AWS PrivateLink blog post.
Learn more about PDC and Grafana Cloud
Private Data Source Connect is now generally available to all Grafana Cloud users, including those in our forever-free tier. To learn more about PDC, check out our Private Data Source Connect documentation.
And to hear firsthand about more of the latest and greatest features coming to Grafana Cloud, join us for ObservabilityCON 2023 on November 14-15 in London!
Grafana Cloud is the easiest way to get started with metrics, logs, traces, and dashboards. We recently added new features to our generous forever-free tier, including access to all Enterprise plugins for three users. Plus there are plans for every use case. Sign up for free now!

