How continuous profiling improved code performance for a new Grafana Loki feature
Throughout the software development process, engineers can use a number of methods and tools to ensure their code is efficient. When using Go, for example, there are built-in tools, including those for benchmarking and CPU/memory profiling, to check how efficiently code will run. Engineers can also run unit tests to validate code quality.
Despite having all of these tools at your disposal, sometimes problems don’t show up until you work with extremely large data sets — and these can be awkward environments to debug in.
While working on some code for a new feature for Grafana Loki — the open source, multi-tenant log aggregation system — I found myself questioning why it was taking so long to process existing log data. I had never used Grafana Cloud Profiles — our hosted continuous profiling tool, powered by Grafana Pyroscope — or any continuous profiling tool. So, I thought this might be the perfect time to try it out and see if I could get any valuable answers to my code performance question.
Here, we’ll quickly walk through how I used continuous profiling to more efficiently build and test new features for the Loki code base.
Improving Loki code performance with continuous profiling
First, I brought up the CPU profile for my running code in Cloud Profiles. To do this, you simply choose the proper namespace and service, the process_cpu CPU profile, and the time frame you’re interested in analyzing.
Then, I quickly (and easily!) received the following flame graph and table in Grafana:
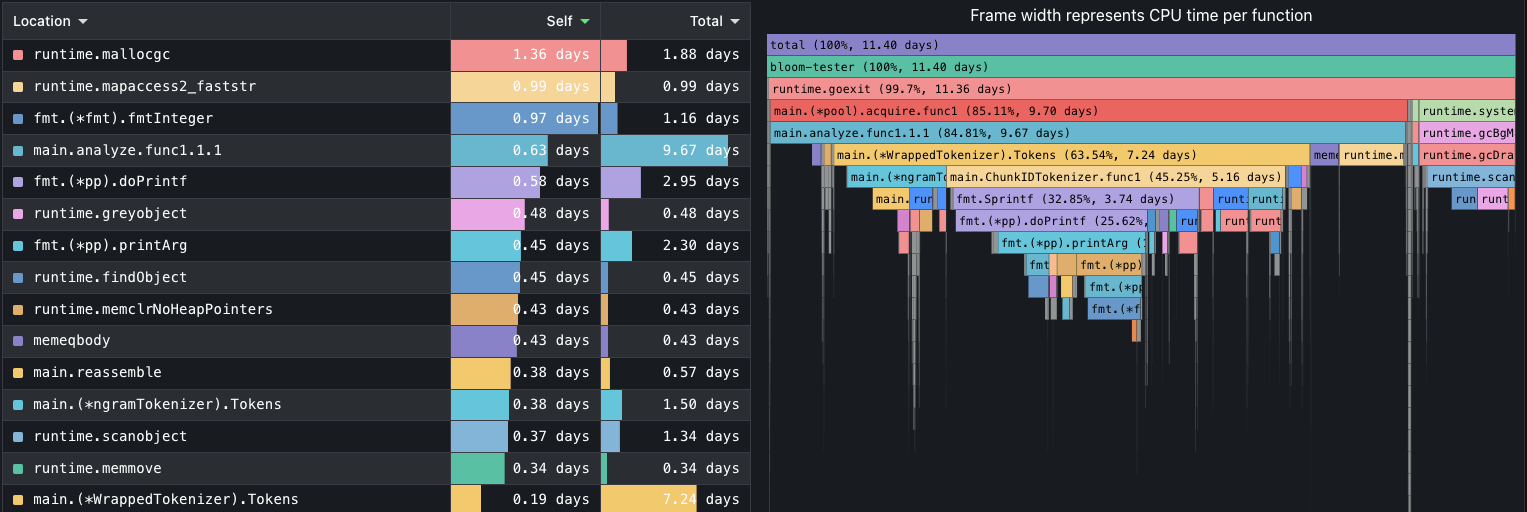
A quick glance at the flame graph showed that almost one-third of the processing time was spent in fmt.Sprintf calls, which was surprising. Upon looking at the corresponding code, I noticed that the fmt.Sprintf calls were essentially being called in a loop. As this output was relatively static, it was a minor adjustment to make the fmt.Sprintf calls once outside of the loop and prevent repeated calls.
After another analysis, I obtained the following profile:
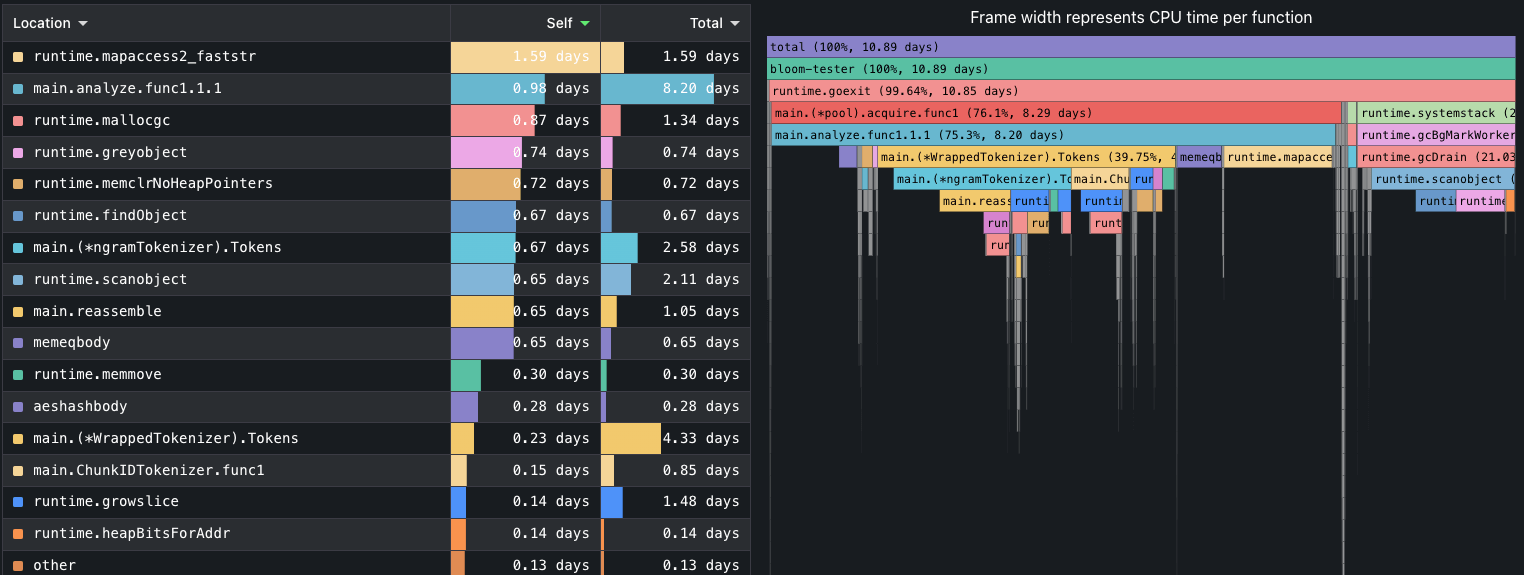
The performance impact of the fmt.Sprintf calls was essentially removed from the application just by making that quick adjustment I mentioned above. Furthermore, because of this minor change, the application ran about 30% faster, with runs coming down in duration from 3 to 2 hours.
This whole exercise wound up taking less than 10 minutes to complete. Grafana Cloud Profiles was intuitive, despite my lack of experience with it, and the results speak for themselves.
I look forward to continuing to streamline this new Loki feature, as well as future features, by using Cloud Profiles as part of my routine toolset.
The easiest way to get started with continuous profiling is with Grafana Cloud Profiles, which is powered by Pyroscope. Sign up today for our generous forever-free tier, which includes 50GB logs, 50GB traces, 10k metrics and 50GB profiles!

