Reducing data center carbon emissions with Hardware Sentry, Grafana, and OpenTelemetry
With just 30 employees, Sentry Software might be considered a small company, but they’re prioritizing sustainability in a big way. As the makers of Hardware Sentry, an IT monitoring software, a large part of their business relies on maintaining optimal temperature conditions at their data centers — an operation that contributes to the company’s overall carbon footprint.
Recently, they embarked on a journey to reduce that footprint by moderating electricity consumption at their primary data center in Paris. By implementing open standards and Grafana Labs technology, they developed a monitoring system with Grafana dashboards to more efficiently monitor electricity usage, which in turn allowed them to safely reduce their consumption by 19%.
In his recent GrafanaCON 2023 talk, Sentry Software CEO Bertrand Martin shared exactly how his company did it and why their reliance on open source and open standards made all the difference.

Setting sights on sustainability
As a Science Based Targets Initiative (SBTi) participant, Sentry Software annually measures its carbon emissions and sets targets to reduce them. This past year, Sentry Software set its sights on a new target: reducing operational carbon footprint.
“Operational carbon footprint is the carbon emissions caused by the production of energy or electricity required to run physical devices,” Martin said. With a mostly remote workforce, Sentry Software’s primary source of carbon emissions is the operational cost of its data centers. “Many data center providers use smart plugs, data center infrastructure management (DCMI) software, and Excel to track and report on electricity usage specifics,” explained Martin. However, this legacy approach is costly, difficult, and painful to maintain. Instead, Sentry Software decided to embrace open source technologies for a smarter approach to monitoring electricity usage.
Building on open standards to monitor energy consumption
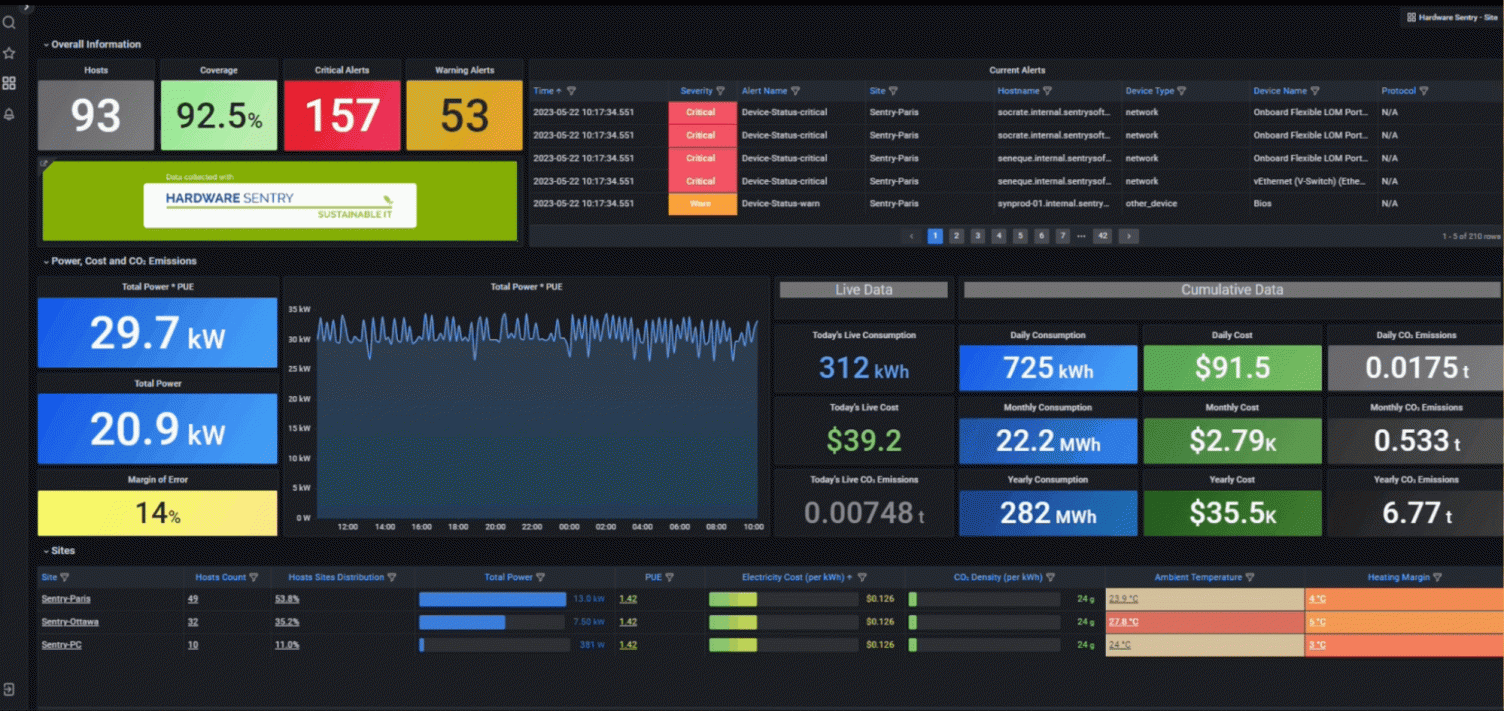
The first thing Sentry Software’s developers did was rebuild their proprietary monitoring tool Hardware Sentry as a Prometheus exporter. They then designed Grafana dashboards to display all the metrics collected by Hardware Sentry. By utilizing OpenTelemetry guidelines and even contributing semantic conventions for hardware metrics, the system administrators were able to build Grafana dashboards that work automatically for anyone who follows the same conventions. “That’s the beauty of using open standards over proprietary solutions,” Martin said.

Sentry Software also wrote several custom scripts, including one to extract values from the power sensors and one to collect the carbon intensity of their electricity supplier, which is the number of grams of carbon dioxide emitted per kilowatt hour of electricity consumed. By utilizing these hardware metrics, the system administrators created Grafana dashboards with detailed data on energy consumption and carbon emissions at the company’s data center.
Making data-driven decisions to reduce carbon emissions
Once the system administrators were better able to monitor the carbon footprint of their data center, the team was equipped to make high-impact changes to reduce it. “Typical data centers maintain a temperature of 18 degrees Celsius, or 64 degrees Fahrenheit,” said Martin. The team wanted to know if there was enough of a margin to safely run the center at a higher temperature — and thus reduce energy consumption.
By leveraging PromQL as well as Grafana’s querying and data transformation capabilities, they calculated the perceived temperature of each system and its heating margin — the number of degrees Celsius by which the temperature could be increased for that system.
They used the data they collected to improve the layout of their systems and gradually increase the room temperature. They also created alerts for each system’s sensors that would notify them if critical temperature thresholds were close to being reached. “We increased the temperature a little bit every day until Grafana told us to stop — at 27 degrees Celsius!” Martin said.

The final result was a 19% reduction in AC energy used at the data center, which translated to a 7% reduction in carbon dioxide emissions year over year. The best part? Because the entire monitoring system is built on open source solutions and open standards, anyone can replicate Sentry Software’s success. “This story could become yours, and you don’t need complicated enterprise solutions,” Marti said.
The company has made Hardware Sentry available free of charge so any organization can better track the carbon emissions of their IT infrastructure and take action to reduce them. And with access to open source Grafana technologies, it’s all you need to get started. “This is just one step in our journey to carbon neutral IT,” Martin said. “But it’s an important one, and we truly hope that many other organizations will do their best to achieve it.”
To see all of Sentry Software’s energy consumption dashboards and hear more about their adoption of open standards, watch the full talk. All sessions from GrafanaCON 2023 are now available on demand.