Introducing the Prometheus Java client 1.0.0
PromCon, the annual Prometheus community conference, is around the corner, and this year I’ll have exciting news to share from the Prometheus Java community: The highly anticipated 1.0.0 version of the Prometheus Java client library is here!
At Grafana Labs, we’re big proponents of Prometheus. And as a maintainer of the Prometheus Java client library, I highly appreciate the support, as it helps us to drive innovation in the Prometheus community. With this release in particular, we’re adding a blazing fast implementation of Prometheus native histograms in Java and keeping the Prometheus library interoperable with emerging open standards like OpenTelemetry.
This blog post gives you an overview of the Prometheus Java client 1.0.0 release and its most important features. If you want to learn more about the client’s status, migration path, and future plans, come to my PromCon talk at 10:15 local time (8:15 UTC) on Friday, Sept. 29. And if you aren’t able to attend in person, you can also live stream it at promcon.io.

A short history of the Prometheus Java client
The Prometheus Java client is a metrics library maintained by the Prometheus team for instrumenting Java applications with Prometheus metrics. And while it has been around for more than a decade, this 1.0 release is actually reflective of the evolving state of the Prometheus server — native histograms have been added as a new metric type, Protobuf has been added as a new exposition format, and there is increasing demand for seamless integration with OpenTelemetry.
With that in mind, I did a lightning talk at last year’s PromCon where I announced a major rewrite of the core Java metrics library. This rewrite made it fit for new metric types and open for new exposition formats, and it cleaned up all kinds of technical debt.
Now I’m looking forward to presenting the results at PromCon 2023, and launching the 1.0.0 release. This is not a simple update; it’s a complete rewrite of the data model and API, and it ships with new Maven modules. It is not backwards-compatible, but we do provide a migration module for bridging existing metrics from a simpleclient collector registry to the new Prometheus registry.
Native histogram support
Native histograms are a new metric type that are currently a beta feature of the Prometheus server. They don’t require any configuration because they automatically adapt to the data that is being observed. If you want to learn more about native histograms, the Prometheus YouTube channel has a lot of presentations on native histograms from previous PromCon conferences.
The Prometheus Java client 1.0.0 has native histogram support built-in and enabled by default.
Histogram histogram = Histogram.builder()
   	.name("request_latency_seconds")
   	.help("service time of my Web UI")
   	.unit(Unit.SECONDS)
   	.labelNames("path", "status")
   	.register();
The histogram above will maintain both the classic histogram representation and the native histogram representation under the hood. Which one is used will depend on how the Prometheus server is configured.
By default, the Prometheus server will scrape metrics in OpenMetrics format and get the classic representation. If the Prometheus server has the native-histogram feature flag enabled, it will scrape metrics in Protobuf format and get the native representation. On the Prometheus server side, working with native histograms requires different PromQL functions than working with classic histograms. See histogram_count() and histogram_sum() in the Prometheus documentation for more information.
Runtime configuration
The code example in the previous section shows a default histogram without any configuration at all. Of course, the API allows you to configure the histogram’s behavior, like making it a classic-only histogram and changing the bucket layout.
However, oftentimes you don’t know what the best configuration is while writing the code — you only learn that in production at runtime.
The Prometheus Java client 1.0.0 comes with extensive runtime configuration options. Almost everything that you can configure in code with the builder() pattern is also configurable at runtime. The runtime configuration can be provided via a properties file, via environment variables, or via system properties.
See the config section in the documentation for a list of available configuration options.
Extensive documentation and examples
Documentation has always been the weak spot of the Prometheus Java client, as there was not much more than a README file. The 1.0.0 release is going to improve this tremendously.
- Extensive documentation is now available on Github pages, providing reference documentation and guides.
- The Prometheus Java client has an examples/ directory with end-to-end examples of different features like native histograms, OpentTlemetry support, and more. These examples include Java code, but also docker-compose files for setting up complete end-to-end environments with a Prometheus server and Grafana dashboards.
OpenTelemetry metrics support
Prometheus Java client 1.0.0 ships with an OpenTelemetry exporter that lets you push metrics in OTLP format to an OpenTelemetry endpoint.
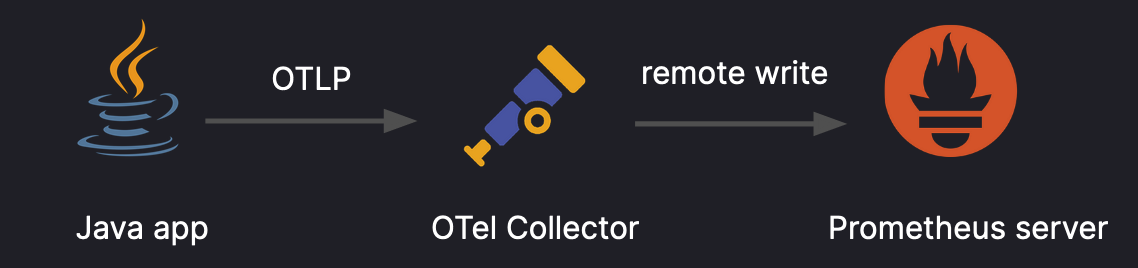
The OpenTelemetry exporter has extensive configuration options, like choosing the protocol, setting request headers, etc. See the configuration documentation for details.
However, OpenTelemetry is not only about the line protocol. The OpenTelemetry standard also defines standard metric and attribute names, called “semantic conventions.” For example, the standard says that if you monitor an HTTP service with OpenTelemetry, you must always have a histogram named “http.server.duration.” The issue is that these standard OpenTelemetry names contain dots, but Prometheus does not allow dots in metric names (yet).
The Prometheus Java client 1.0.0 allows dots in label names, so you can use standard OpenTelemetry metric names like “http.server.duration” when instrumenting your application with the Prometheus Java client. If you expose metrics in Prometheus format, the dots will automatically be replaced with underscores. However, if you switch to OpenTelemetry format, you will get the names with dots as defined in the OpenTelemetry standard.
Seamless Integration with OpenTelemetry tracing
OpenTelemetry’s vision statement says that telemetry should be loosely coupled, allowing end users to pick and choose from the pieces they want without having to bring in the rest of the project, too. In that spirit, you might choose to instrument your Java application with the Prometheus Java client library for metrics, and attach the OpenTelemetry Java agent to get distributed tracing.
The Prometheus Java client implements a couple of features under the hood to make integration with OpenTelemetry tracing a seamless experience:
- Consistent service.name and service.instance.id. OpenTelemetry uses attributes called
service.nameandservice.instance.idto uniquely identify which service telemetry data is coming from. The Prometheus Java client will automatically detect if the OpenTelemetry Java agent is attached and use the sameservice.nameandservice.instance.idas the OpenTelemetry agent. That way, the metrics produced by the Prometheus Java client and the traces produced by the OpenTelemetry agent will share the same identifiers, and your monitoring backend will see that these signals are coming from the same service. - Automatic exemplar support. Exemplars are a feature of the Prometheus data model that allows you to attach links to example traces to your metric data. In Grafana, exemplars are often visualized as green dots. You can click an exemplar to navigate to the corresponding trace. The Prometheus Java client automatically detects if OpenTelemetry tracing is present, and it automatically creates exemplars if a trace context is available.
- Support for trace sampling. Exemplar support has been available in previous versions of the Prometheus Java client. However, there was an issue: Many users don’t keep all of their trace data, instead applying a sampling policy to reduce the amount of trace data. As a result, exemplars often pointed to traces that were no longer available.
The new Prometheus Java client 1.0.0 has a fix for that: It annotates spans used as exemplars with an attributeexemplar=”true”. The sampling policy in the OpenTelemetry collector can be configured to sample all traces with that attribute. That way, you will have no more broken links to traces. See example-exemplars-tail-sampling for an end-to-end example.
Optimized for high performance applications
The Prometheus Java client is designed for instrumenting high performance applications. A simple example is the API for incrementing a counter with two labels, “path” and “status”:
requestsTotal.labelValues("/api/v1", "200").inc();Note that looking up the label values and incrementing the counter are two independent operations. If this counter is used on the critical path in a high performance application, you can look up the label values only once and increment the data point directly:
// look up the data point only once
CounterDataPoint successfulCalls = requestsTotal.labelValues("/api/v1", "200");

// use the data point directly in the hot path of your api
successfulCalls.inc();
This simple trick results in more than 100% performance increase for the counter update. The performance section in the docs has more info on how to use the API in performance critical applications.
Under the hood, implementations of all metric types are aggressively optimized for performance in highly concurrent applications. All metric types, including classic and native histograms, allow concurrent updates and scrapes. If your web service is designed to utilize all processor cores in parallel for maximum performance, you don’t want a metrics library to introduce synchronization and make threads wait on each other.
The benchmarks/ directory of the Java client project has a collection of benchmarks on updating a shared metric (like a latency histogram) with multiple parallel threads. The Javadoc keeps up-to-date results from recent benchmark runs.
With the 1.0.0 release, the optimization focus is on the hot path, i.e., updating metrics in concurrent applications. With future releases, we will also optimize the cold path, i.e., scraping. This is less important because scraping happens only once per minute or so, but we aim at optimizing all code paths over time.
Future roadmap
The previous Prometheus Java client releases include a variety of instrumentation library modules. Only a subset of them is included in the 1.0.0 release. Some of the missing modules have a lot of users — for example, the pushgateway module or the Servlet filter for automatic HTTP latency metrics.
So the next step on the Prometheus maintainers’ roadmap is to port more of the existing modules to the new 1.0.0 version.
Apart from that, we will update the jmx_exporter to use the new Java client library. This will automatically add OpenTelemetry support to jmx_exporter, so you will then be able to push jmx_exporter metrics to an OpenTelemetry endpoint.
Moreover, we will implement support for OpenTelemetry’s semantic conventions, for example, for JVM runtime metrics or for HTTP server metrics.
Prometheus + Grafana
Here at Grafana Labs, we continue to support Prometheus by providing a growing collection of dashboards based on semantic conventions, like the JVM overview community dashboard. These dashboards work out-of-the-box if metrics are compliant with OpenTelemetry’s semantic conventions, significantly reducing the effort needed to set up monitoring with Grafana. Moreover, Grafana Cloud launched an Application Observability solution that is currently in public preview, offering integrated support for semantic conventions like the JVM runtime metrics.
Grafana Cloud is the easiest way to get started with metrics, logs, traces, and dashboards. We have a generous forever-free tier and plans for every use case. Sign up for free now!