Celebrating Grafana 10: Top 10 'Oh my Grafana!' dashboard moments of the decade
While it’s thrilling to introduce new visualizations (Canvas panel! Flame graphs!) and new functionality (Have you tried Scenes?) in Grafana, we are always particularly proud when we discover a new Grafana dashboard in the wild.
“We’re constantly inspired and surprised, sometimes confused, sometimes amused, and oftentimes impressed at what the community gets up to,” said Grafana Labs CEO and Co-founder Raj Dutt during the GrafanaCON 2023 keynote. “And that’s the magic of open source — you get to see a thousand flowers bloom, and we take a lot of inspiration from that.”
Now it’s our turn to give flowers back to the Grafana community, which has grown to more than 20 million users worldwide. With only 10 weeks until Dec. 5 when we mark the 10-year anniversary of the first commit by Grafana creator Torkel Odegaard, we are excited to share the top 10 Grafana dashboards we discovered over the past decade.
They span across land, sea, space, and virtual worlds. They monitor bikes, race cars, rockets, and underwater vessels. And they represent the adoption, evolution, and exciting innovation that has come from 10 years of working alongside the open source community.
“The success of Grafana has really been driven by the efforts of everyone who’s joined us on our mission. Not just the Grafana Labs team, but the wider community," says Grafana Labs Co-founder Anthony Wood. “You’ve been our teachers, our testers, our troubleshooters and, of course, our spell checkers.”
“Seeing Grafana dashboards pop up everywhere — in the background of office photos, in data centers, in movies, in video games, and in the SpaceX control center — and realizing that Grafana is used by over 20 million users, just blows my mind,” added Torkel. “I’ve been working on this for 10 years, but there’s still so much more to do, so much that can be better … [and] that untapped potential is what keeps me going.”
1. Space X control center (2015)
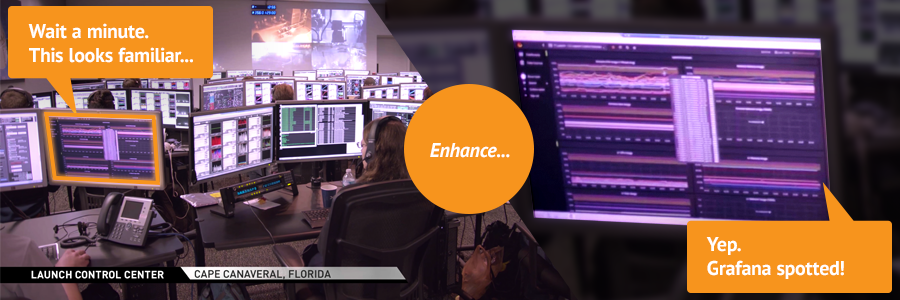
Named as one of Torkel’s Top 10 Grafana moments, spotting Grafana dashboards in a Space X promotional video for the Falcon 9 rocket was an early sign of the incredible trajectory for the visualization tool.
2. Microsoft’s underwater data center (2018)
Instead of using acres of land to build warehouses for data farms, what if information could be stored on the ocean floor? It’s a question Microsoft set out to answer when they built an underwater data center and plunged it to the sea floor off the coast of Scotland in 2018. The Microsoft team then used Grafana for a deep dive into the data around maintaining the underwater data center.
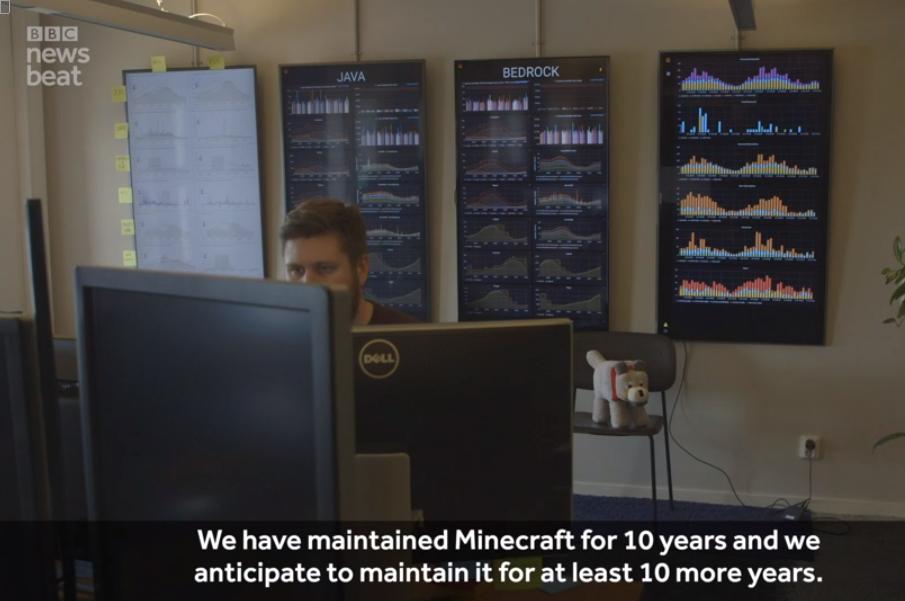
3. Minecraft headquarters (2019)
Behind the scenes at the Swedish video game developer Mojang, Grafana dashboards lit up their office spaces during a news segment in which the company talked about maintaining and monitoring uptime for the wildly popular build-your-own-virtual-world game Minecraft.
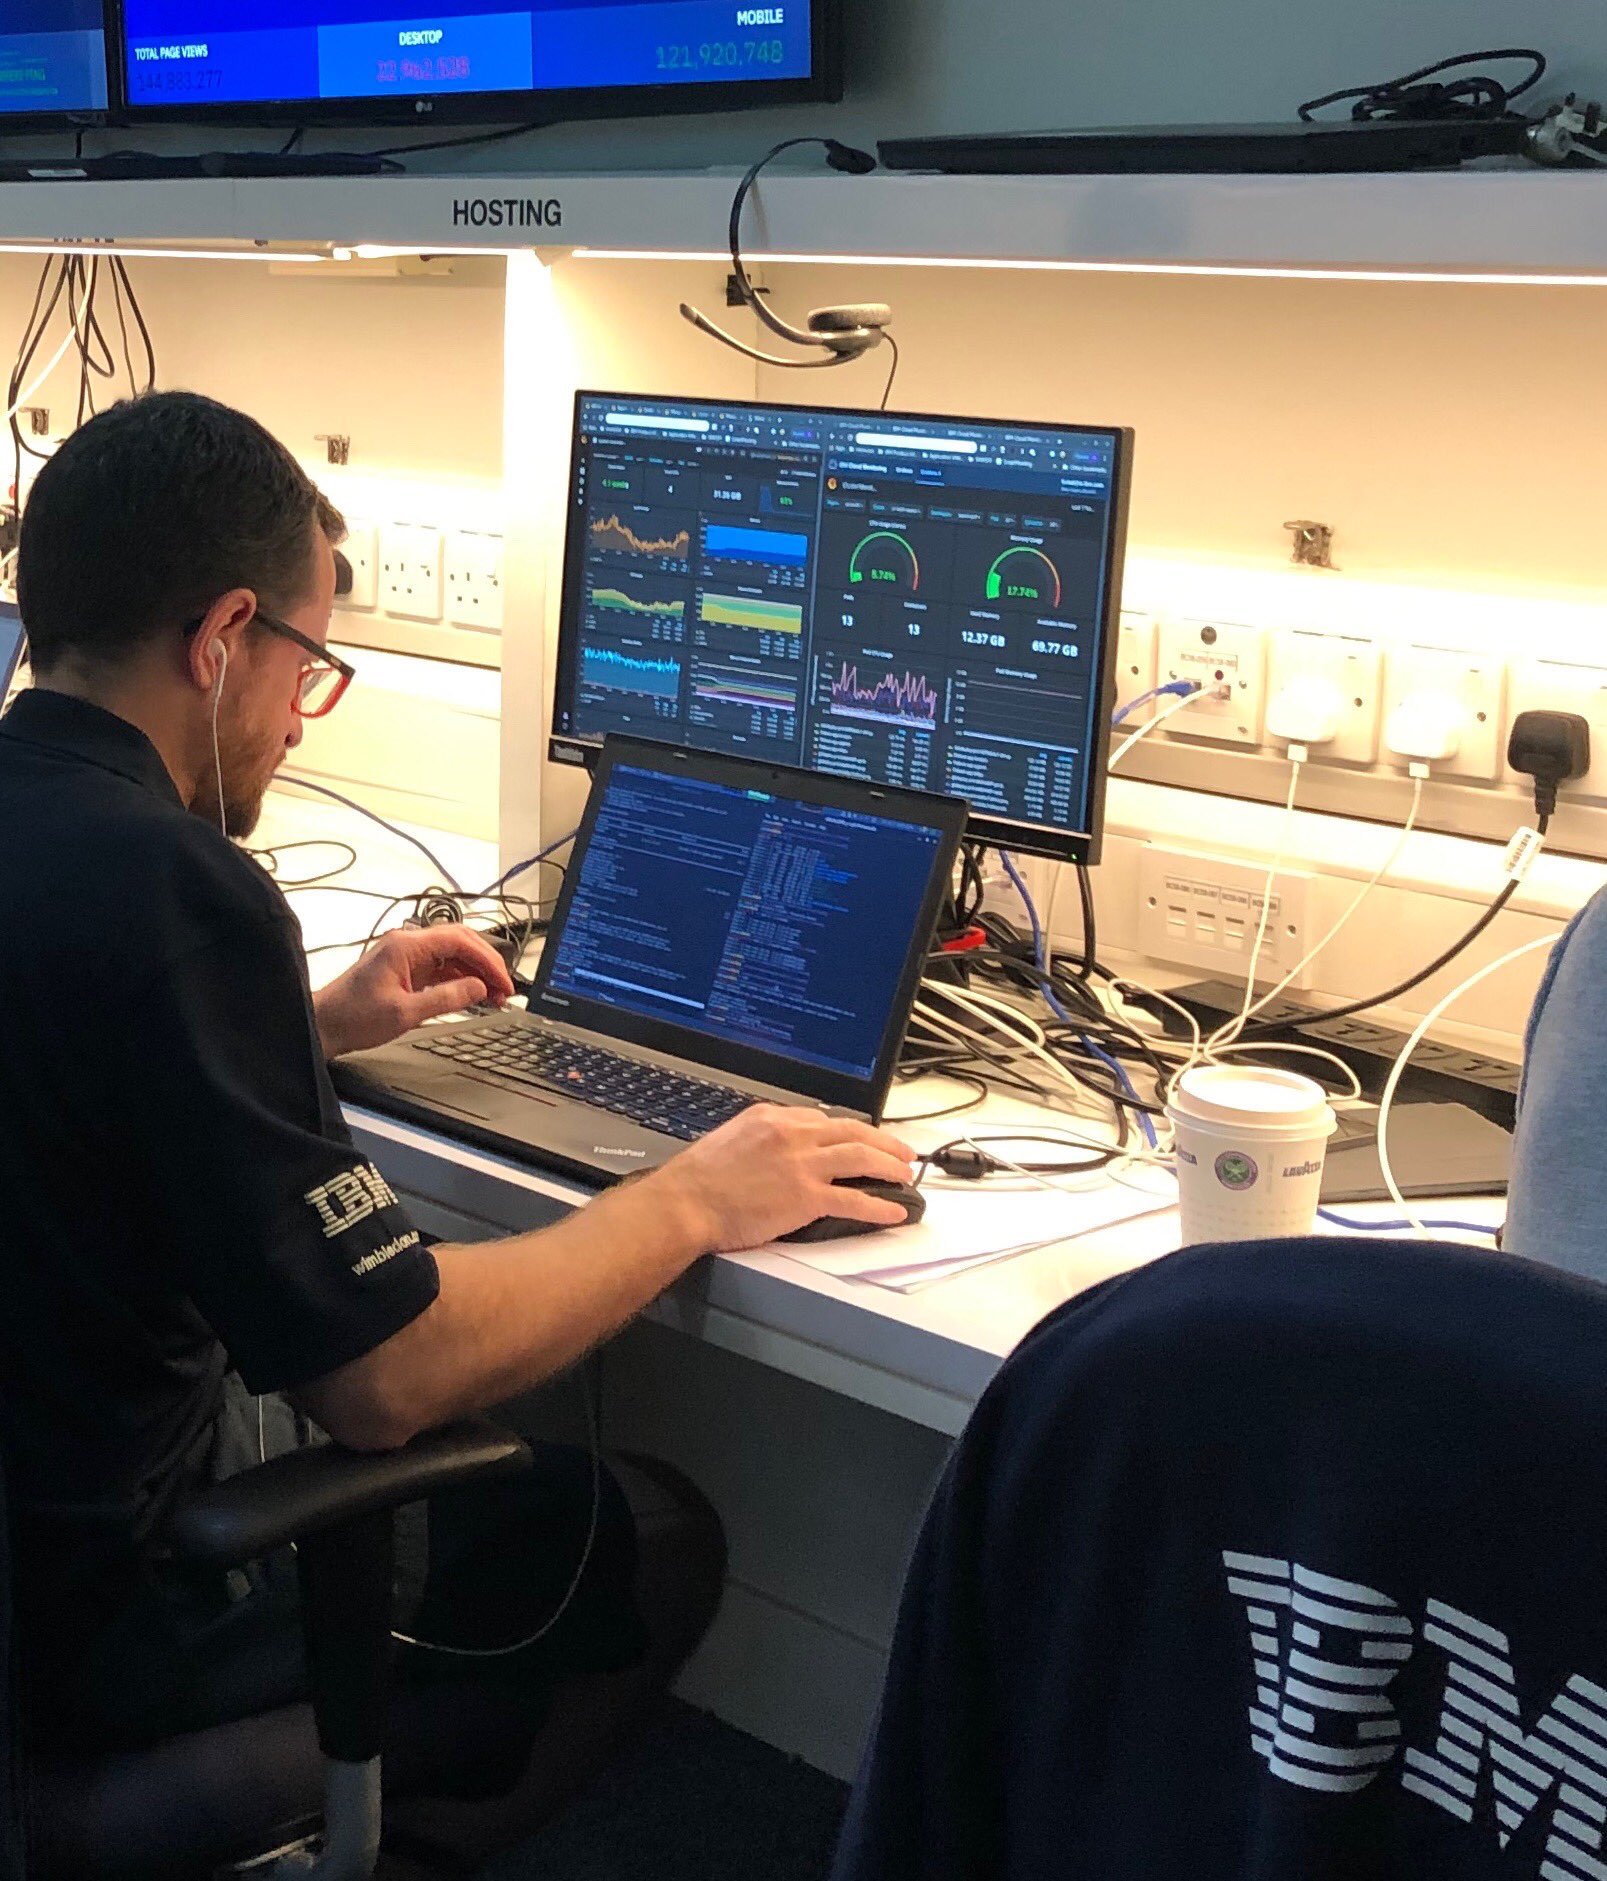
4. Wimbledon (2019)
Game, set, monitor. An observability expert reported that the Grand Slam tournament served up an observability stack that included IBM Cloud Kubernetes Service, Prometheus, and Grafana.
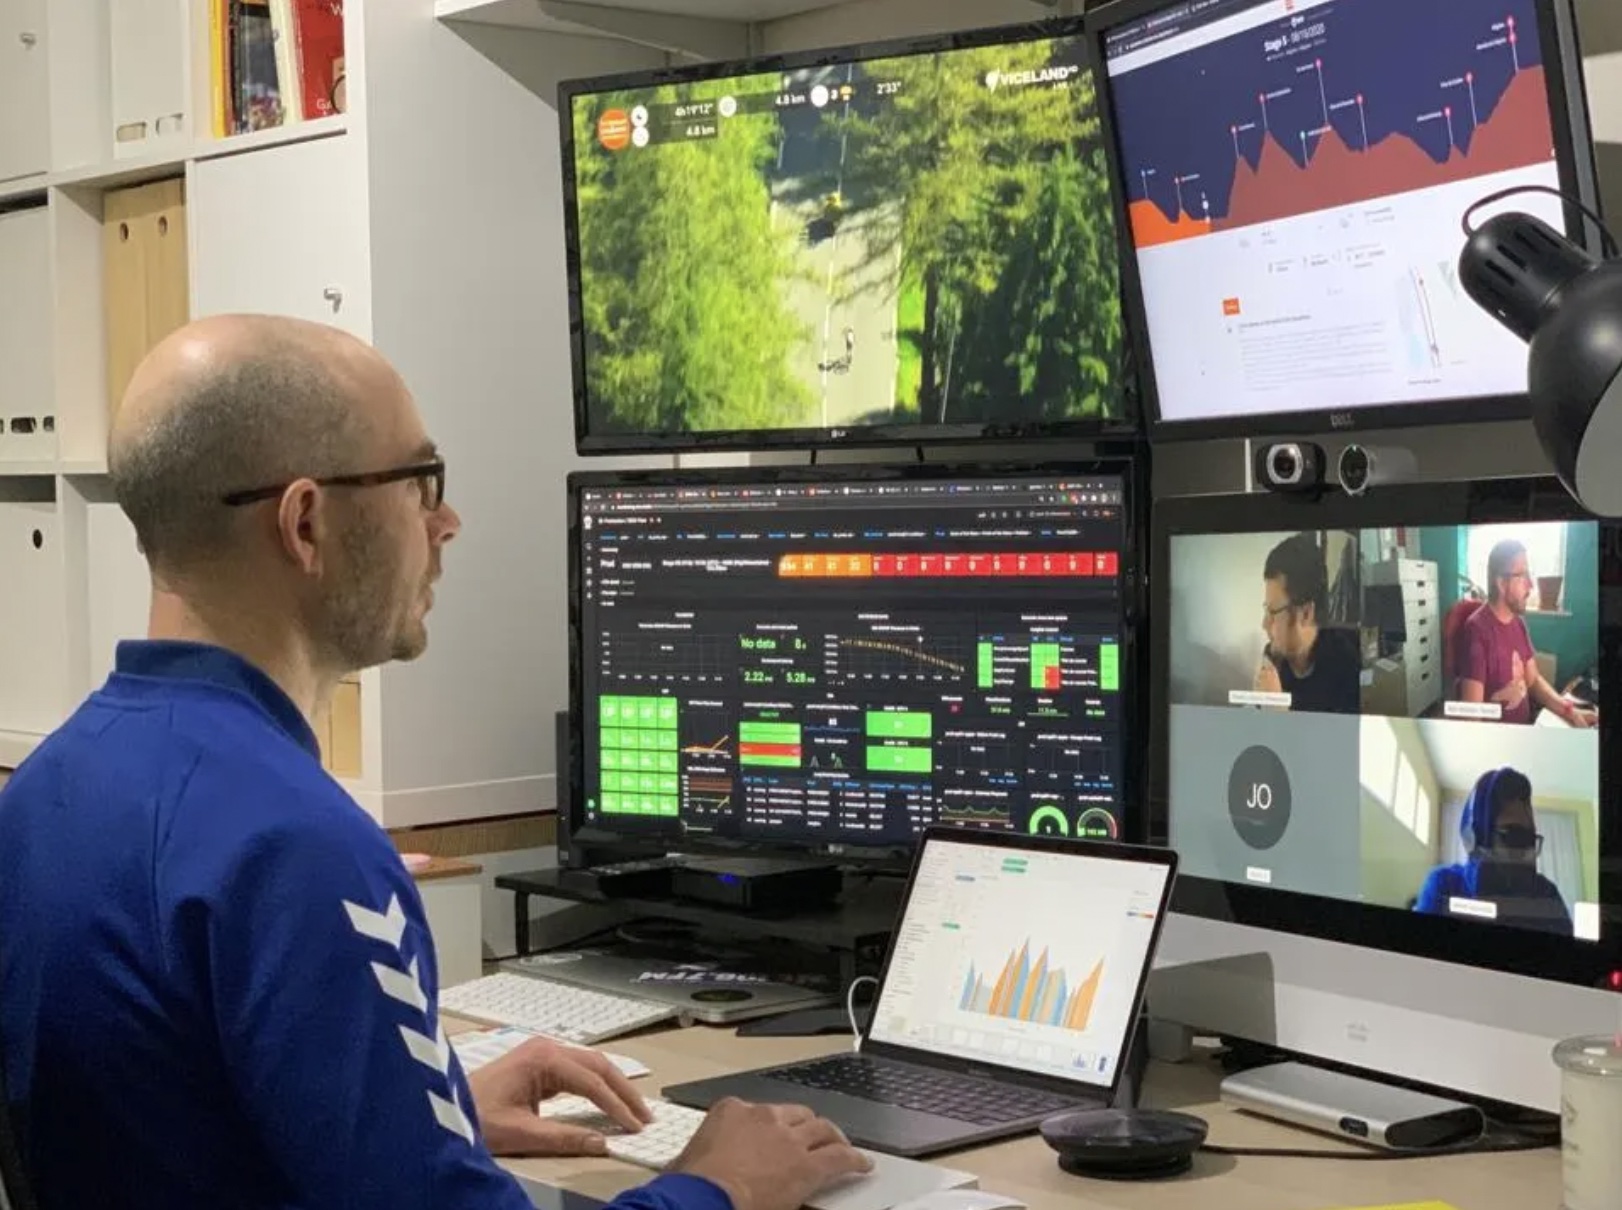
5. Tour de France (2020)
Amidst the pandemic, the Tour de France organizers wanted to update how fans engaged with the 2,235-mile cycling race. Instead of encouraging followers to gather in large crowds along the route, they enlisted the help of NTT, a leading IT infrastructure and technology services company, to create a data-driven spectator experience that leveraged Grafana to showcase real-time race data that enthusiasts could track at home.
6. NASA launch (2022)
“Be prepared to switch over your Grafana data sources at lift-off.” During the NASA Astra launch in early 2022, we learned that NASA was home to Grafana fans when the launch controller said those words to the launch team. “Everyone at Grafana Labs was in shock,” recalled Raj during GrafanaCON 2022, “and we were so enamored and tickled when we heard this.”
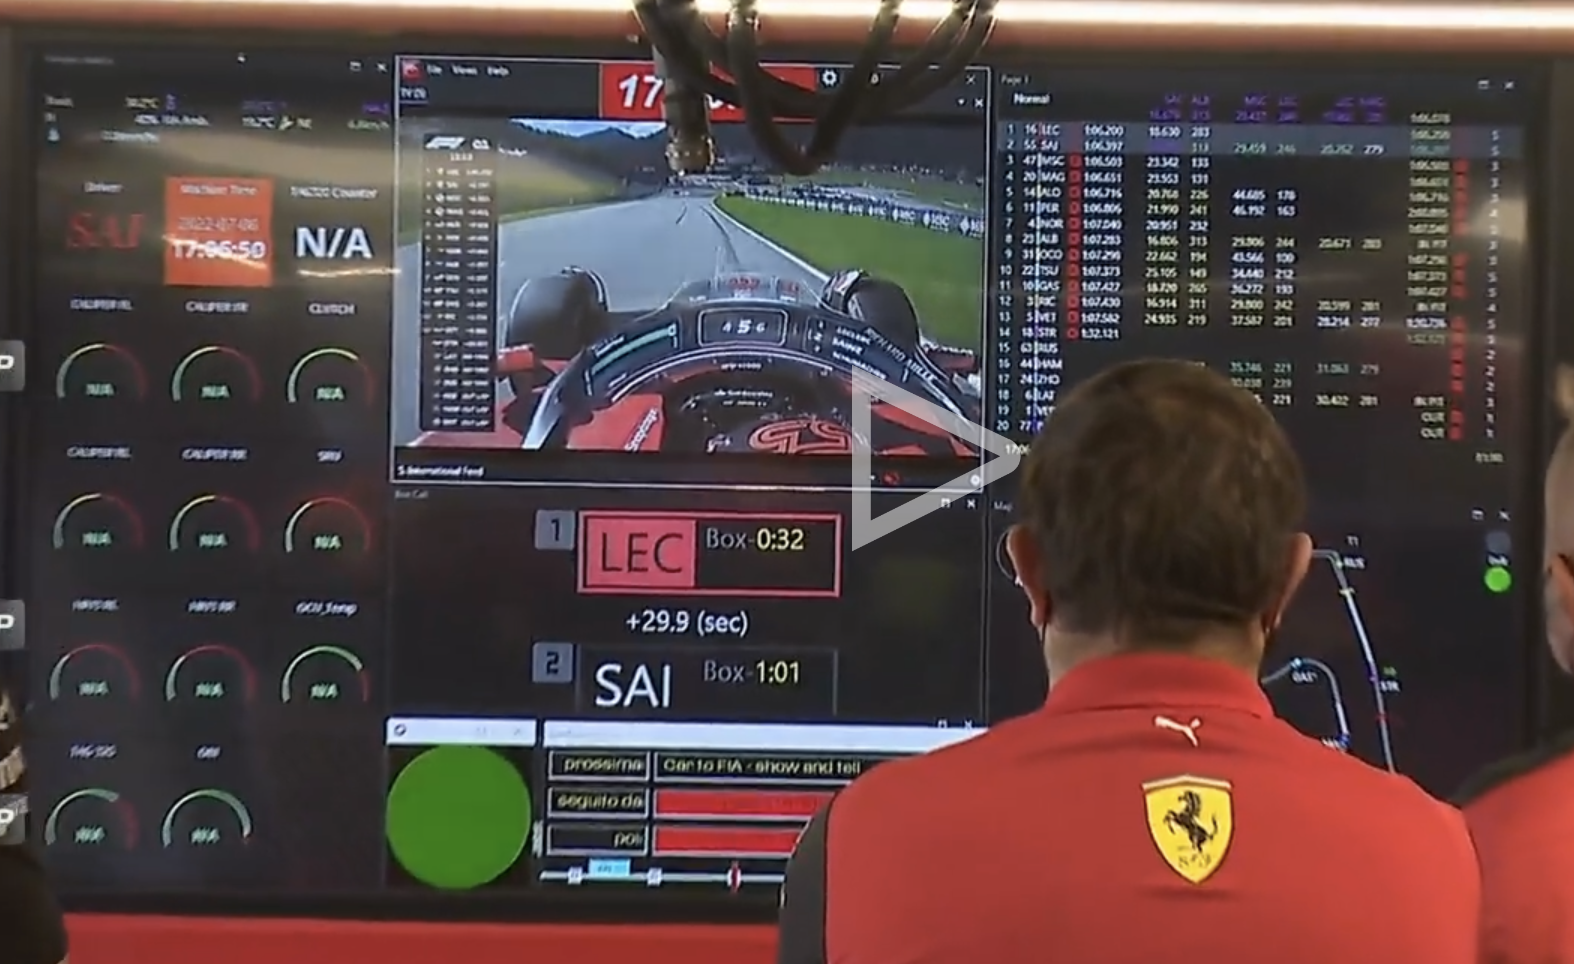
7. Formula 1 (2022)
The need for speed — and real-time data — was realized by the Ferrari F1 team during the 2022 Austrian Grand Prix. The Formula 1 broadcast caught the telemetry set up for the principals and engineers for the Ferrari F1 team, Scuderia Ferrari, which used Grafana dashboards to make racing decisions during the event. For a company filled with F1 fans (we have a Slack channel and a fantasy league!), this was a winning moment.
8. Call of Duty (2023)
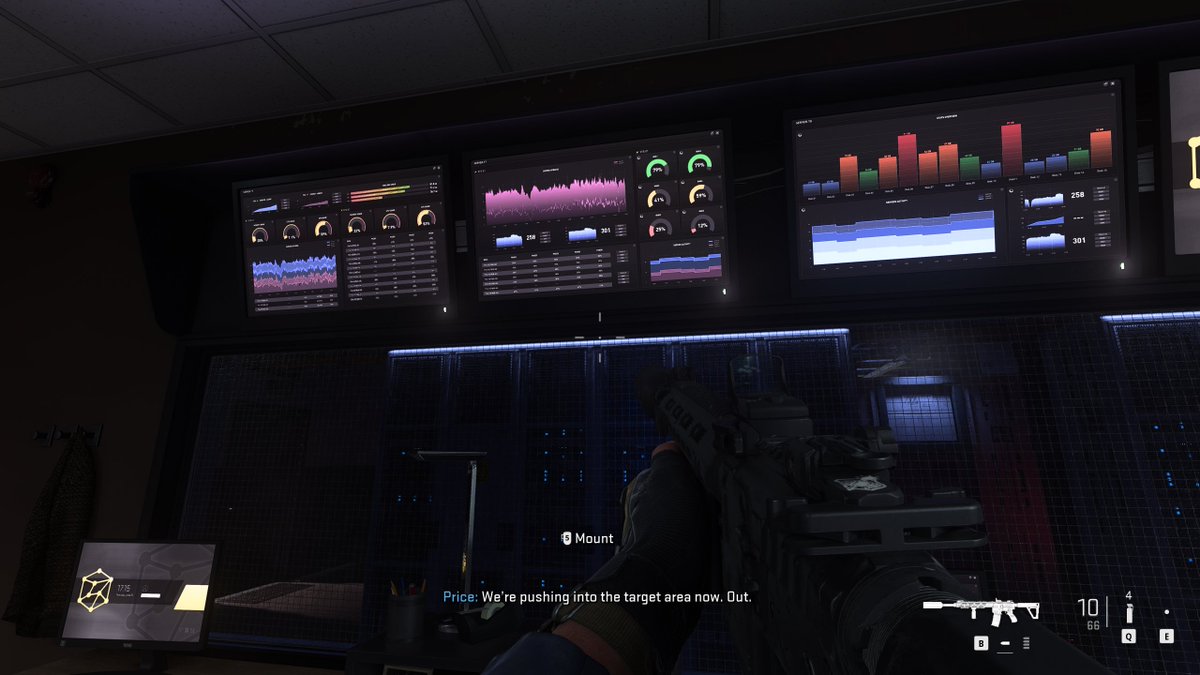
We’re used to seeing Grafana dashboards in the wild — but this was the first time we spotted one in a virtual world. In Call of Duty Modern Warfare 2, “it’s pretty obvious to those of you who know Grafana, that that looks a hell of a lot like Grafana, based on the style of the gauges, the color scheme, everything about it is clearly Grafana,” Raj said during the GrafanaCON 2023 keynote. “So whoever it was at Activision who is a Grafana fan and responsible for this, thank you! Big hat tip from all of us.”
9. Rocket Project UCLA (2023)
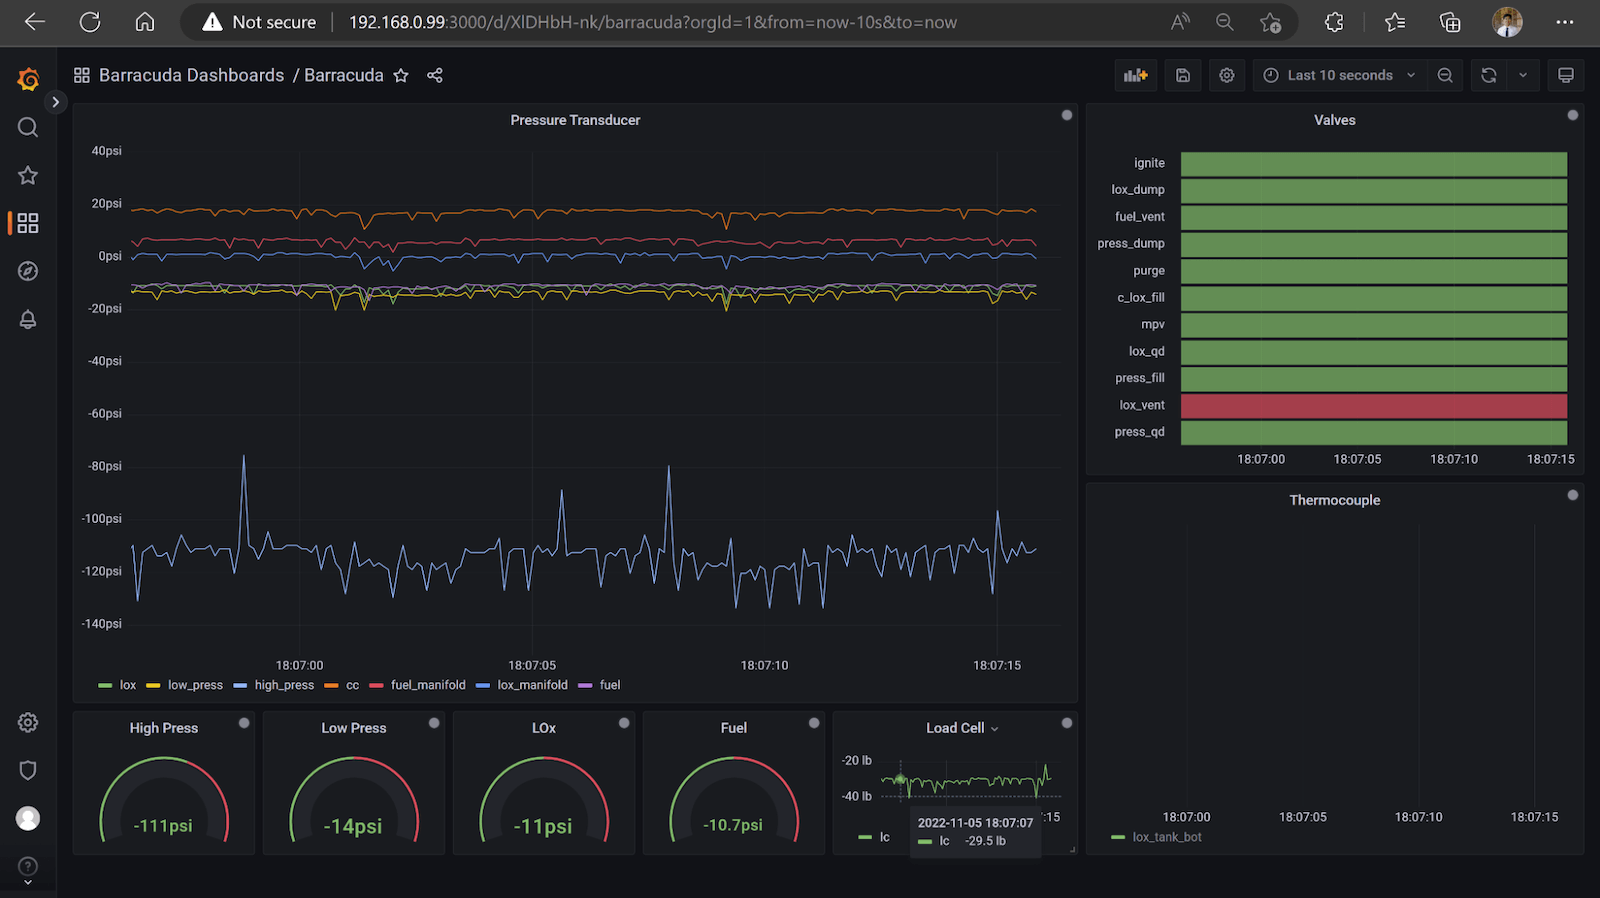
A shout-out goes to the team behind Rocket Project UCLA, a group of software engineering students (and next-gen Grafana enthusiasts!) who broke the collegiate world record for highest liquid rocket altitude. Philip Do, one of the student engineers behind the project, wrote a blog that details how the team used Grafana to develop, test, and launch the record-setting rocket. “The good news is that the team had a successful launch, and they managed to recover the rocket after,” said Raj.
10. The Ocean Race (2023)
The Ocean Race is a global sailing competition in which participants race around the world, which means they need around the clock monitoring of everything from GPS location to wind speed, air and water temperatures, and more. Team Malizia representing Germany shared the Grafana dashboard that helped them track their progress throughout the grueling six-month adventure. And The Ocean Race headquarters also displayed some impressive Grafana dashboards as they monitored the overall event.
To hear more success stories from the Grafana community, join us in person at ObservabilityCON 2023 in London on November 14-15. Register for the event, check out a sneak peek at this year’s agenda, or sign-up to access the livestream of the keynote from the event. Learn more on the official ObservabilityCON 2023 web page.
Want to share your Grafana story and dashboards with the community? Drop us a note at stories@grafana.com.

