How to monitor SLOs with Grafana, Grafana Loki, Prometheus, and Pyrra: Inside the Daimler Truck observability stack
In order for fleet managers at Daimler Truck to manage the day-to-day operations of their vast connected vehicles service, they use tb.lx, a digital product studio that delivers near real-time data along with valuable insights for their networks of trucks and buses around the world.
Each connected vehicle utilizes the cTP, an installed piece of technology that generates a small mountain of telemetry data, including speed, GPS position, acceleration values, braking force and more. All that data must be ingested, stored, processed, analyzed, and shared in near real time. At its peak, throughput for the tb.lx service reaches around 3,000 messages, or 7 MB of data, every second.
In his recent GrafanaCON 2023 talk, “Monitoring high-throughput real-time telemetry data at Daimler Truck with the Grafana Stack” (now available on demand), Principal Engineer Adrien Bestel shared how his team monitors the Kubernetes-run tb.lx with Grafana, Grafana Loki, Prometheus, and Pyrra, and he outlined the four steps they used to define, implement, and monitor SLOs to keep availability high and latency low.
Step 1: Build your observability stack with Grafana
By building on Grafana Labs’ open source technology, Bestel and his team have created an observability stack that works seamlessly together and interfaces easily with other solutions. “We try to be as vendor-neutral as possible,” said Bestel. “We prefer solutions that integrate better with Grafana and are globally less expensive than what comes out of the box.”
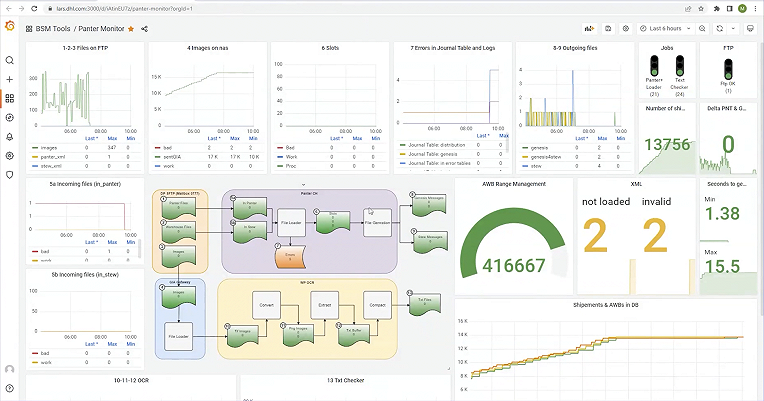
Their architecture is built on Prometheus for metrics and Grafana Loki for logs, both of which are highly available with a 30-day retention period for data. Everything is then monitored via Grafana dashboards. “Grafana is the central piece that ties everything together with alerting and dashboards,” said Bestel.

Step 2: Define SLOs and error budgets
At the beginning of development, Bestel’s team homed in on four key areas:
- Availability
- Latency
- Timeliness
- Cost
Bestel’s team then translated those key indicators into service level objectives (SLOs). For example, 99% of request latencies should be less than 300 milliseconds. From these SLOs, the team then developed error budgets for their project.
“When one of our SLOs starts having failures, our error budget burns. When it goes back to normal, the error budget recovers and grows again,” said Bestel. By setting goals for each key indicator, the team works with clearly defined baselines for monitoring and improving performance over time.
Step 3: Implement SLOs with Pyrra, Kubernetes, and Grafana
Bestel’s team utilizes Pyrra, an open source tool designed to track SLOs and that easily integrates with Grafana. To do this, they first manually defined each SLO as a custom resource in Kubernetes.

Once the custom resources were implemented, Pyrra reconciled them and automatically created Prometheus recording rules that represent the SLOs as well as generic rules for monitoring SLOs within Grafana. Prometheus executes the recording rules, and everything is fed into a set of Grafana dashboards that visualizes the data.
Step 4: Safeguard SLOs with Grafana dashboards and frequent testing
The tb.lx team safeguards their SLOs with careful monitoring, tweaking, and testing. Bestel’s team monitors availability, latency, and real timeliness of the data in their system via histograms, smart alerts, and error budget graphs in Grafana.

They tweak their SLOs by using standard thresholds where applicable, then make adjustments based on two questions: How does my product break, and how can I know that it broke? They also run end-to-end tests frequently, and maintain three separate Grafana instances in three different environments — development, staging, production — to do so.
“Defining service level objectives ensures customer success,” Bestel said. “They are easy to implement and monitor with Prometheus, Pyrra, and Grafana and provide a clear guideline for operations.”
To learn more about how tb.lx monitors SLOs with Grafana dashboards and hear their specific targets for error budgets, latency, and more, watch the full GrafanaCON talk. All sessions from GrafanaCON 2023 are now available on demand.