
Better anomaly detection in system observability and performance testing with Grafana k6
Grzegorz Piechnik is a performance engineer who runs his own blog, creates YouTube videos, and develops open source tools. He is also a k6 Champion. You can follow him here.
From the beginning of my career in IT, I was taught to automate every repeatable aspect of my work. When it came to performance testing and system observability, there was always one thing that bothered me: the lack of automation. When I entered projects, I encountered either technological barriers or budgetary constraints. It gave me the idea to find a way to automate a significant portion of the test results analysis at a low cost in terms of effort.
The first crucial step to automate the performance testing results analysis process was integrating CI/CD and quality gates (initially with Keptn, and later at the Grafana k6 level). That significantly automated the process of test result analysis. However, one seemingly insurmountable issue remained: anomalies. Those are deviations or irregularities in data or system behavior that don’t follow the expected patterns or standards. They can be identified based on criteria such as standard deviation and minimum and maximum values relative to the average.
When it came to automated result analysis, one of the tools I found helpful was thresholds by Grafana k6 — thanks to quality gates, I could save a lot of time on analysis. But despite the many advantages of tools like k6, I noticed during numerous performance tests that the lack of an automatic anomaly detection feature remained an issue.
In response to this challenge, I developed an extension called** xk6-anomaly** to make the analysis of test results faster and more precise. Not only did the efficiency of my problem detection improve, but it also allowed me to focus on other important aspects of my work.
In this post, I’m going to discuss the basics of anomalies and how using the xk6-anomaly extension can help you find them.
Anomalies in practice

In the k6 summary above, you can see a large discrepancy in a server’s response time. Potential anomalies, however, can be detected at a few vectors. The most common examples are:
- Response delays: A sudden increase in server response time compared to previous measurements or relative to expectations.
- Resource usage peaks: Unexpected surges in CPU, RAM, disk, or network usage during tests.
- Transaction errors: An increase in the number of errors, such as 500 (server errors) or 404 (not found), which were not present during previous tests.
- Connection limit: The system suddenly reaches the maximum number of simultaneous connections, resulting in the rejection of new requests.
- Database replication errors: Delays or errors in data replication between clusters or servers.
- Sudden throughput reduction: The system processes fewer requests per second, even though it hasn’t reached its theoretical maximum yet.
In summary, anomalies can occur almost everywhere.
They can be categorized based on their type, which are:
- Outliers: Short/minor irregularities that appear sporadically during data collection.
- Event shifts: Systematic or abrupt change relative to previous regular behavior.
- Drifts: Slow, directionless, long-term changes in data.

In 2022, I was working on a project with so much specificity that even single errors in production were unacceptable. As a result, it was necessary to determine which test metrics indicated potential anomalies. Repeatedly analyzing often the same data over time made my work robotic and resulted in oversights. That is when my idea for an anomaly detection tool was born.
Looking for anomalies
I already knew that anomalies could appear across all layers of an application — from memory usage, through response times, to connection limits — but covering all those layers would require either the existence or creation of a tool to analyze anomalies from various data sources. Since I used k6 daily and the analysis of metrics collected by that tool were primarily what I was interested in, the natural choice was to focus on metrics extracted from k6.
The tool used to expand k6’s capabilities is xk6. It was developed in response to the growing popularity of k6 and the increasing complexity of performance tester requirements. xk6 allows for writing code in Go, which is then integrated with the core version of k6. This enables the inclusion of custom solutions, such as operations on Apache Kafka.
Before we delve into the tool’s implementation, let’s talk a bit more about the anomalies themselves.
Anomaly detection in action
Anomaly detection involves the use of statistical techniques, machine learning algorithms, or deep learning to analyze data and identify patterns that significantly deviate from expected behaviors or norms within a given data set.
Two particular ways to detect anomalies are:
1. Searching for deviations within a given dataset — for example, having an array of variables:
const data = [1, 2, 3, 3, 2, 3, 1, 3, 11];
The outlier here will be the value 11 (it stands out against the rest, which takes on values of 1, 2, and 3).
2. Searching for mismatched data based on predefined, normal (training) data.
const trainingData = [1, 3, 2, 3, 3, 1, 1, 2, 1, 1, 3];
const data = [1, 3, 5, 3, 2, 1, 6, 3, 1];
The outliers in the data set based on the normal trainingData are values 5 and 6.
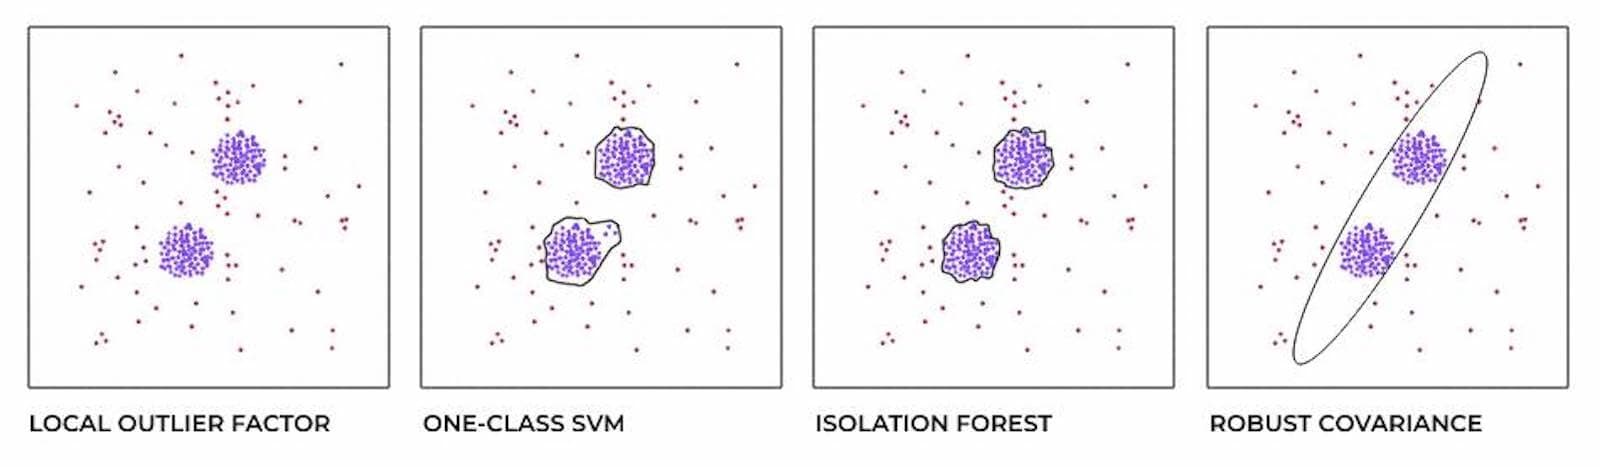
There are various algorithms for identifying potential anomalies. All differ in their sophistication and implementation methods. Here is a simplified visual representation of their operation (normal points are marked in purple and anomalies are in red):
I understood the problem and how to solve it. I also knew that I would use xk6 to implement the tool.
Let’s move on to the solution.
The xk6-anomaly extension
In response to all the challenges of automatic anomaly detection, I decided to create an extension in xk6 — xk6-anomaly — that can be used within the test scenario. It is responsible for automated anomaly detection after the test is completed.
By operating at the scenario level rather than the application level, xk6-anomaly solves the problem of running tests in multiple environments. Additionally, it provides flexibility in detecting only the anomalies that matter in each individual search. Since the extension is used by k6, it can integrate the features offered by the tool, which solves the problem of the versatility of using the anomaly detector.
Let’s check out xk6-anomaly in action.
In the repository, you can find this real example of using the tool. It uses both implemented algorithms simultaneously for real-time analysis of the test results, and only response times are considered. Anomalies are tagged with the appropriate algorithm name and HTTP request. Since the LOF (Local Outlier Factor) algorithm does not detect anomalies based on correct data, we wait for at least 40 results in the test scenario.
import http from "k6/http";
import { group, sleep } from "k6";
import { Counter } from "k6/metrics";
import anomaly from "k6/x/anomaly";

const anomaliesMetric = new Counter("anomalies");
const trainData = [
	0.0, 1.0, 2.0, 3.0, 4.0, 5.0, 6.0, 7.0, 8.0, 9.0, 10.0, 11.0, 12.0, 13.0,
	14.0, 15.0, 16.0, 17.0, 18.0, 19.0, 20.0, 21.0, 22.0, 23.0, 24.0, 25.0,
	26.0, 27.0, 28.0, 29.0, 30.0, 31.0, 32.0, 33.0, 34.0, 35.0, 36.0, 37.0,
	38.0, 39.0, 40.0, 41.0, 42.0, 43.0, 44.0, 45.0, 46.0, 47.0, 48.0, 49.0,
	50.0, 51.0, 52.0, 53.0, 54.0, 55.0, 56.0, 57.0, 58.0, 59.0, 60.0, 61.0,
	62.0, 63.0, 64.0, 65.0, 66.0, 67.0, 68.0, 69.0, 70.0, 71.0, 72.0, 73.0,
	74.0, 75.0, 76.0, 77.0, 78.0, 79.0, 80.0, 81.0, 82.0, 83.0, 84.0, 85.0,
	86.0, 87.0, 88.0, 89.0, 90.0, 91.0, 92.0, 93.0, 94.0, 95.0, 96.0, 97.0,
	98.0, 99.0, 100.0, 101.0, 102.0, 103.0, 104.0, 105.0, 106.0, 107.0, 108.0,
	109.0, 110.0, 111.0, 112.0, 113.0, 114.0, 115.0, 116.0, 117.0, 118.0, 119.0,
	120.0, 121.0, 122.0, 123.0, 124.0, 125.0, 126.0, 127.0, 128.0, 129.0, 130.0,
	131.0, 132.0, 133.0, 134.0, 135.0, 136.0, 137.0, 138.0, 139.0, 140.0, 141.0,
	142.0, 143.0, 144.0, 145.0, 146.0, 147.0, 148.0, 149.0, 150.0, 151.0, 152.0,
	153.0, 154.0, 155.0, 156.0, 157.0, 158.0, 159.0, 160.0, 161.0, 162.0, 163.0,
	164.0, 165.0, 166.0, 167.0, 168.0, 169.0, 170.0, 171.0, 172.0, 173.0, 174.0,
	175.0, 176.0, 177.0, 178.0, 179.0, 180.0, 181.0, 182.0, 183.0, 184.0, 185.0,
	186.0, 187.0, 188.0, 189.0, 190.0, 191.0, 192.0, 193.0, 194.0, 195.0, 196.0,
	197.0, 198.0, 199.0, 200.0, 201.0, 202.0, 203.0, 204.0, 205.0, 206.0, 207.0,
	208.0, 209.0, 210.0, 211.0, 212.0, 213.0, 214.0, 215.0, 216.0, 217.0, 218.0,
	219.0,
];
const testData = [];

function pushAndFindAnomaly(responseTime, name) {
	testData.push(responseTime);

	// need minimum of 40 training data for lof usage
	if (testData.length >= 40) {
		const lofAnomalies = anomaly.lof(testData, 4.5);
		const lastLofAnomaly = lofAnomalies[lofAnomalies.length - 1];

		//current response time is qualified as an anomaly
		if (lastLofAnomaly && lastLofAnomaly.value == responseTime) {
			console.log("Anomaly: " + responseTime + "lof");
			anomaliesMetric.add(responseTime, {
				name: name,
				alghoritm: "lof",
			});
		}
	}

	const oneClassSvmAnomalies = anomaly.oneClassSvm(trainData, testData, 1);
	const lastOneClassSvmAnomalies =
		oneClassSvmAnomalies[oneClassSvmAnomalies.length - 1];

	// current response time is qualified as an anomaly
	if (
		lastOneClassSvmAnomalies &&
		lastOneClassSvmAnomalies.value == responseTime
	) {
		console.log("Anomaly: " + responseTime + "oneclassvm");
		anomaliesMetric.add(responseTime, {
			name: name,
			alghoritm: "oneClassSvm",
		});
	}
}

export const options = {
	iterations: 100,
};

export default function () {
	let response;
	let name;

	group("First API call", function () {
		name = "GET /";
		response = http.get("http://test.k6.io");
		pushAndFindAnomaly(response.timings.duration, name);
	});

	group("Second API call", function () {
		name = "GET / 2";
		response = http.get("http://test.k6.io");
		pushAndFindAnomaly(response.timings.duration, name);
	});

	group("Third API call", function () {
		name = "GET / 3";
		response = http.get("http://test.k6.io");
		pushAndFindAnomaly(response.timings.duration, name);
	});

	sleep(1);
}
After executing this and sending the data to InfluxDB, the metrics can be visualized in Grafana. (You can find the link to the dashboard in this example here.) You can see that an anomaly in one of the test runs has been detected.

Once you’ve observed the issue, the next steps you could take include integrating with automated reporting and sending notifications via Slack, Microsoft Teams, or email. It’s crucial to remember that depending on the application, each anomaly detection function should have individually set thresholds for error detection.
Big payoffs of anomaly detection
Before creating the xk6-anomaly extension, working in the field of performance testing was a challenge for me. Continuous analysis of test results was time-consuming and often monotonous. Searching for anomalies in the test data took a lot of time and required a lot of attention. There were hours wasted on manually checking the results.
However, since the introduction of the xk6-anomaly extension, my work has become significantly easier and more efficient. This tool helps me automatically detect anomalies, saving me a lot of time, and I can now focus on more advanced aspects of my work as a performance engineer. The automation of test result analysis has made my work more satisfying and productive.
I highly encourage you to check out xk6-anomaly if you want to automatically detect anomalies in performance tests.
Are you ready to be a Grafana k6 champion and share your performance testing wins with the greater community? Learn more about our champion program in our recent blog post. Or if you want to share your Grafana story with the community, drop us a note at stories@grafana.com.

