
How universities preserve and protect digital assets with Grafana dashboards
Anthony Leroy has been a software engineer at the Libraries of the Université libre de Bruxelles (Belgium) since 2011. He is in charge of the digitization infrastructure and the digital preservation program of the University Libraries. He coordinates the activities of the SAFE distributed preservation network, an international LOCKSS network operated by seven partner universities. He is an engineer in electronics and telecommunications with a PhD in microelectronics (ULB) and has been a researcher for almost ten years in collaboration with several industrial partners.
In today’s world, preserving digital assets is one of the most difficult tasks an organization can face. There are a wide variety of issues that can put data at risk over the long term, including hardware failure, software obsolescence, or natural disasters. In practice, however, data loss is mainly caused by human errors, computer attacks, or financial and organizational problems.
To address these problems, the Université Libre de Bruxelles — where I work — and six other universities have built our own distributed digital preservation network, SAFE PLN. The aim of this network is to archive and preserve the scientific output of participating universities over the very long term (several decades). Our collections include scientific publications, theses, and research data. These digital objects are replicated in seven copies spread in our servers hosted across Europe and Canada to mitigate risks.
The copies are automatically checked and repaired based on the LOCKSS technology developed at Stanford University. This open source software was specifically created to secure many distributed copies of digital archives and ensure their integrity over the very long-term. Over the past two decades, it has proven to be a robust peer-to-peer digital preservation solution, receiving the highest rating from certification experts.
We have been using Grafana OSS for the last three years to monitor the status of our network. Grafana dashboards provide crucial visibility, transparency, and security, all of which are indispensable to our digital preservation solution.
Together with Grafana Loki and Prometheus, our Grafana dashboards provide all our members with global and detailed views of the network status, allowing each participant to track the status of their archived copies in real time. Problems in the network are detected and reported instantly, allowing us to react quickly.
Previously, we had developed our own monitoring application, but it was difficult to maintain and update. Grafana has been a game-changer for us by providing a robust, secure, and customizable solution that is easily adaptable to our needs.
Although our Grafana instance is only accessible to our members, we’ve made one dashboard public thanks to the new public dashboards feature in Grafana 10.

In this post, I’ll explain how we set up our solution to provide observability in a LOCKSS network with Grafana, and highlight our dashboard features.
Background basics
For many organizations, a common-sense way to mitigate the risk of data loss is to make several archive copies of digital assets and spread them in multiple locations that are considered safe from natural hazards.
The problem is that an institution by itself — especially in the academic or cultural heritage fields — is generally unlikely to have the human and technological resources needed to build that type of efficient distributed preservation solution. But if a group of institutions with similar needs come together, they can create a network filled with copies of all of their archives, with each network node maintaining copies for the others.
Having distributed copies is helpful, but it is not enough to ensure data preservation. The LOCKSS technology adds a key component: It implements a sophisticated integrity verification and repair protocol based on a decentralized consensus mechanism using proof-of-work. This protocol allows each preservation node to ensure that its archives are intact by regularly conducting integrity check polls with the other nodes safeguarding copies in the network and repairing them when needed.
There are currently a dozen networks using LOCKSS with various scopes, goals, and governance models to preserve specific content. The networks form a vibrant and growing community which recently started sharing and developing common tools.
By design, the peer-to-peer architecture of LOCKSS networks makes it truly decentralized and very resilient to both internal and external attacks. But for the same reason, it is also rather difficult to monitor the activities in the network.
Ideally, an organization’s digital archivist would like to be able to answer the following questions:
- Are my collections intact and replicated at the expected sites?
- Is the network operating properly? (Is a firewall blocking traffic? Are all nodes up and running?)
- Did my copies have to be repaired?
It is also important to be able to have a record of the entire history of the network, making it possible to trace everything that has happened in the past and to use for audit purposes.
Making the Grafana dashboard adaptable to all LOCKSS networks
To address the distributed digital preservation network needs for our network, we initially developed a monitoring application that had two parts:
- A Java application collecting status data from the preservation nodes in a Postgres database
- A dashboard web application based on the Apache Wicket Java framework
While we were fully satisfied by the daemon, we quickly realized that managing, maintaining, and ensuring the security of a custom-designed dashboard application required too much time and effort for our team.
As a consequence, we decided to replace the dashboard web application with Grafana three years ago.
Because of Grafana’s out-of-the-box metrics, logs, dashboards, and alerts, the time it took to develop our dashboards was reduced by a factor of 10, and security was significantly improved. On top of that, Grafana provided a significantly enhanced experience by giving users more control over their dashboards and serving up a more responsive interface.
The LOCKSS network dashboard
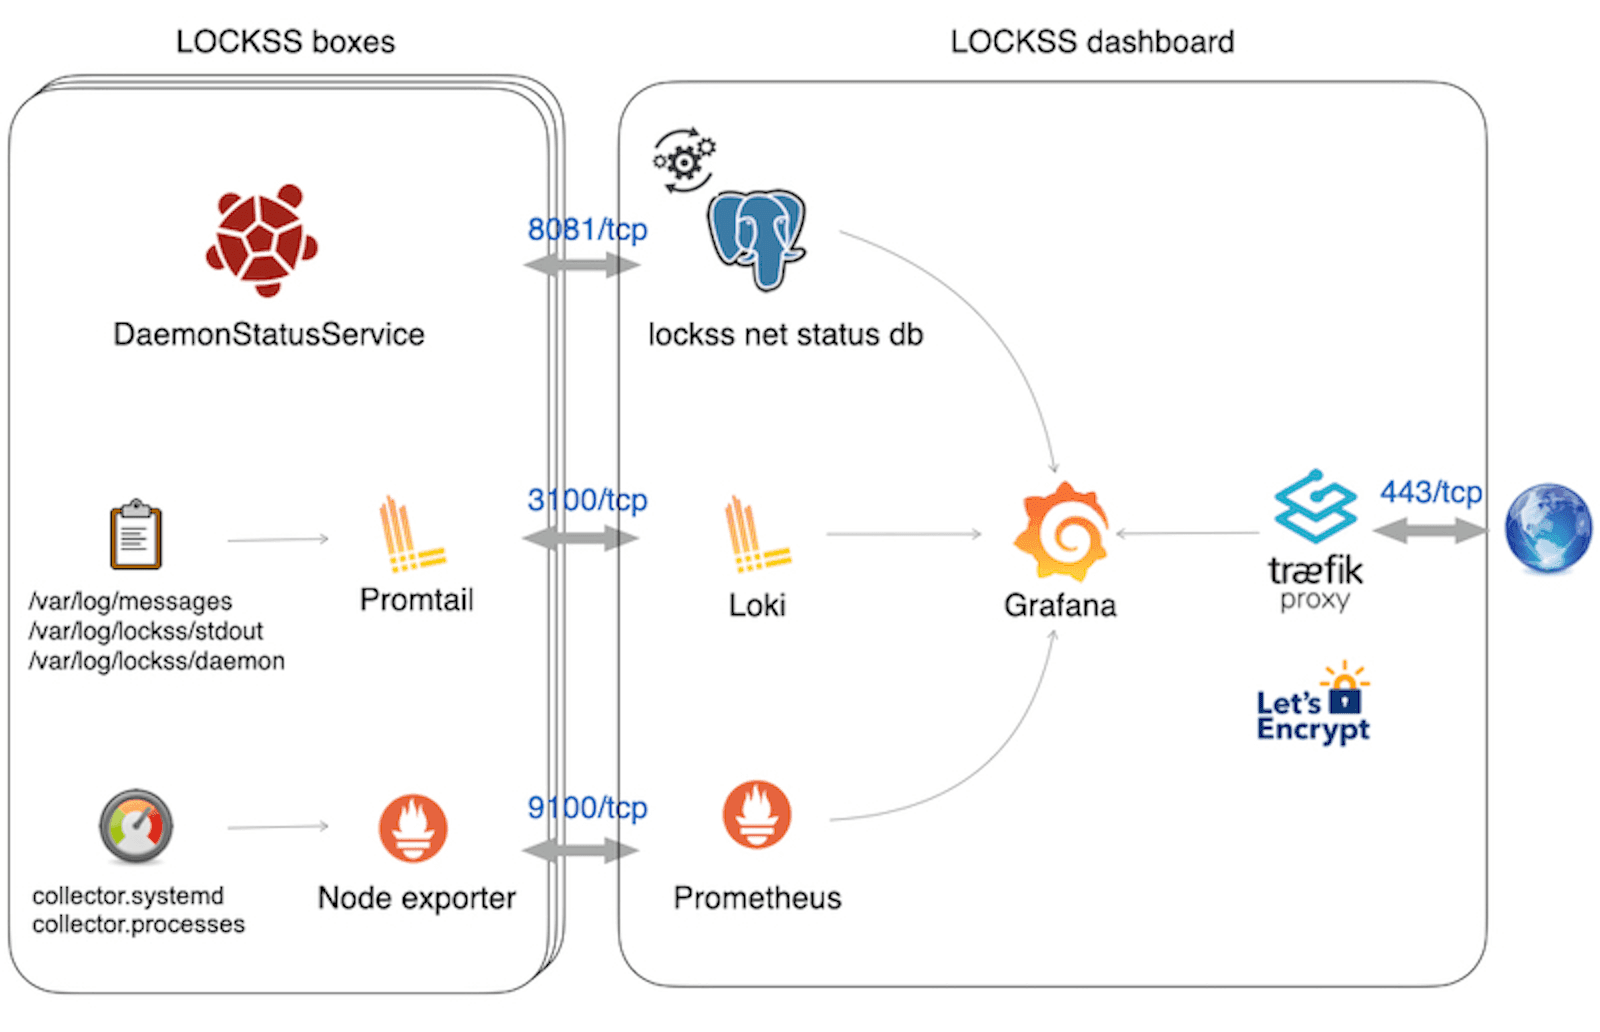
The LOCKSS dashboard we’re using is based on Grafana, Loki, and Prometheus.
It combines:
- Preservation data collected in a Postgres database from all the network nodes using a dedicated API (DaemonStatusService)
- Log files collected from the complete software stack in each preservation node with a Promtail agent
- Performance metrics collected from each preservation node with a Node exporter agent
The access to Grafana from the Web is secured via a Traefik reverse proxy component handling HTTPs traffic and the Let’s Encrypt certificates automatic renewal.
Here is the architecture with all of the components:
Home screen highlights
The LOCKSS dashboard home screen provides users with a global view of the available dashboards:
• A global network status dashboard
• A summary of active alerts
• Dedicated dashboards for every preservation node
• Dedicated dashboards for every archive collection

The global status Grafana dashboard
This dashboard allows administrators to check that the network is functioning properly and quickly identify any problems. Custom alerts with specific triggers are also assigned to all dashboard components and the alerts can be sent via various customizable channels (email, MS Teams, Slack, etc.).
In the top banner of the main dashboard (pictured below), users can quickly see concise information about key metrics.
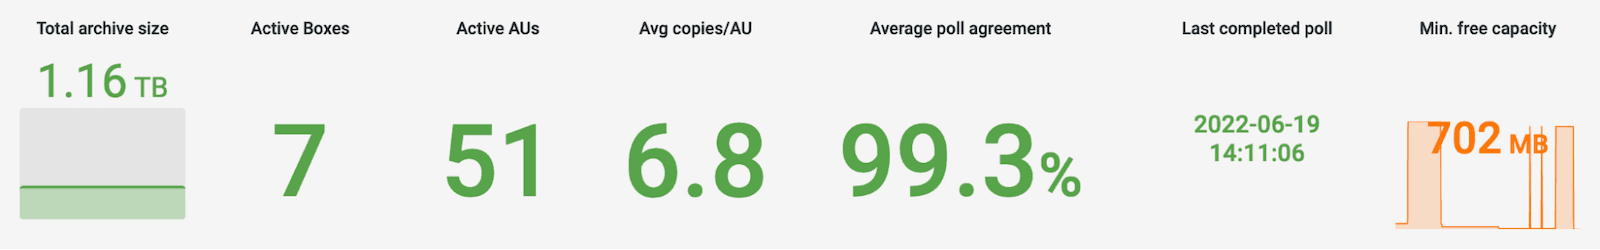
This panel displays:
- total archive size
- number of active preservation nodes
- number of collections preserved in the network
- average number of verified copies in the network per collection
- average integrity agreement in the network
- time elapsed since the last poll was completed in the network
The main dashboard also features a map of the network showing the active LOCKSS boxes location and the number of archive collections they contain.

There is also a chart that illustrates the distribution of archival units per archive collection.

Additionally, there is a panel with details on the LOCKSS nodes settings.

The final piece is a matrix view that details the integrity status of each archive in each node of the network.

Making the dashboard adaptable to all LOCKSS networks
Since we want the dashboard to be easily deployable on any LOCKSS network, we are currently developing a web application to automatically provision dashboards tailored to each network’s specific configuration.
During installation, users simply need to provide the URL of the LOCKSS network configuration file, and the software automatically generates dashboards for each node in the network and each archive collection. All dashboards are derived from JSON templates. Users can also provide additional information that needs to appear in the dashboards.
All generated dashboards and data sources are then submitted to Grafana via a provisioning directory.
The software then automatically deploys a Grafana instance with Docker compose.

Overall benefits
Over the years, we’ve found that our Grafana dashboard offers many advantages for our users. Each day, it:
- Provides business reports on the preservation network status
- Facilitates the discovery of issues in the network thanks to automatic alerts
- Speeds up resolving problems by centralizing and combining all status information in the network
- Strengthens the security of the network
By delivering observability and transparency, Grafana is contributing to making preservation networks more efficient and giving added peace of mind to anyone worried about protecting an organization’s digital assets.
Having proved its efficiency, the solution is now undergoing gradual adoption by other LOCKSS networks. Notably, the Alabama Digital Preservation Network — a statewide LOCKSS network with nodes in Alabama and Louisiana — has implemented the solution and posted a public view of the dashboard to its website. The MetaArchive Cooperative — the oldest community-based LOCKSS network in North America, with member institutions in Brazil and Spain — is also in the process of implementing the dashboard.
Want to share your Grafana story and dashboards with the community? Drop us a note at stories@grafana.com.

