
Introducing agentless monitoring for Prometheus in Grafana Cloud
We’re excited to announce the Metrics Endpoint integration, our agentless solution for bringing your Prometheus metrics into Grafana Cloud from any compatible endpoint on the internet.
Grafana Cloud solutions provide a seamless observability experience for your infrastructure. Engineers get out-of-the-box dashboards, rules, and alerts they can use to visualize what is important and get notified when things need attention. With many of these solutions, however, you have to run an agent, such as Grafana Agent, in order to collect and ship your telemetry data to the cloud. While this works well, some users would rather avoid that operational overhead and instead offload it to Grafana Cloud.
Well, if that sounds like you and you’re working with Prometheus, then you’re in luck. The Metrics Endpoint solution is an agentless integration you can use to forward Prometheus metrics from your publicly addressable host directly into Grafana Cloud, without having to host any infrastructure yourself!
Why we’re excited about agentless monitoring for Prometheus
Many of our users get excited to see their data in Grafana Cloud, but they’re not necessarily as excited about having to stand up additional infrastructure to make room for an agent such as Grafana Agent. This is especially true for users that leverage SaaS, since they may not be using dedicated infrastructure within their platform. For these users, it’s a non-trivial process to host an agent as an intermediary between their data source and Grafana Cloud.
Currently, a select few integrations offered within Grafana Cloud — AWS CloudWatch and Confluent Cloud, for example — are “agentless.” This means that the infrastructure and agent required to scrape metrics are provided by Grafana Labs on your behalf. This type of solution works well when your metrics are accessible over the internet, as it provides a seamless experience to connect your data and bring it into Grafana Cloud from these respective platforms.
Today, we’re excited to expand this offering, making it compatible with any provider that serves Prometheus metrics on the public internet. The inspiration for this integration came during a recent hackathon, when we asked ourselves if we could expand the current catalog of agentless integrations with a generic solution that could collect metrics from anywhere. As a result of that work and continued development, the Metrics Endpoint integration does exactly that!
(Keep in mind, as excited as we are about agentless monitoring, the agent-based integrations are still more suitable for systems that are run privately within your infrastructure.)
Example use case: monitoring Supabase
Supabase provides developers with tools to build highly performant backends quickly and securely. Each Supabase instance has a dedicated URL that exposes metrics under the /customer/v1/privileged/metrics route.
Until now, unless you self-hosted your instance, you had to set up completely separate infrastructure just to host Grafana Agent and forward those metrics to Grafana Cloud. But with the Metrics Endpoint solution, all you need to do is create a scrape job, which is a set of configurations that enable you to create multiple instances of the integration. Those instances can then collect metrics from distinct targets using unique authentication details. You can also query and filter your metrics by the specific, corresponding job.

To create a scrape job for Supabase, all you need is the URL and path to the Supabase project’s metrics, as well as basic authentication credentials to access those metrics.
How to get started with Metrics Endpoint in Grafana Cloud
Before you get started, you’ll need:
- An HTTPS endpoint that exposes Prometheus-compatible metrics. This endpoint must be publicly addressable, meaning it must be accessible on the public internet.
- Basic or bearer credentials used to authenticate against the given metrics address
The exact means of collecting this information will depend on the endpoint, but to obtain these for a Supabase project, you will need to open up your project dashboard on supabase.com, and use the left-side navigation to access your project settings.
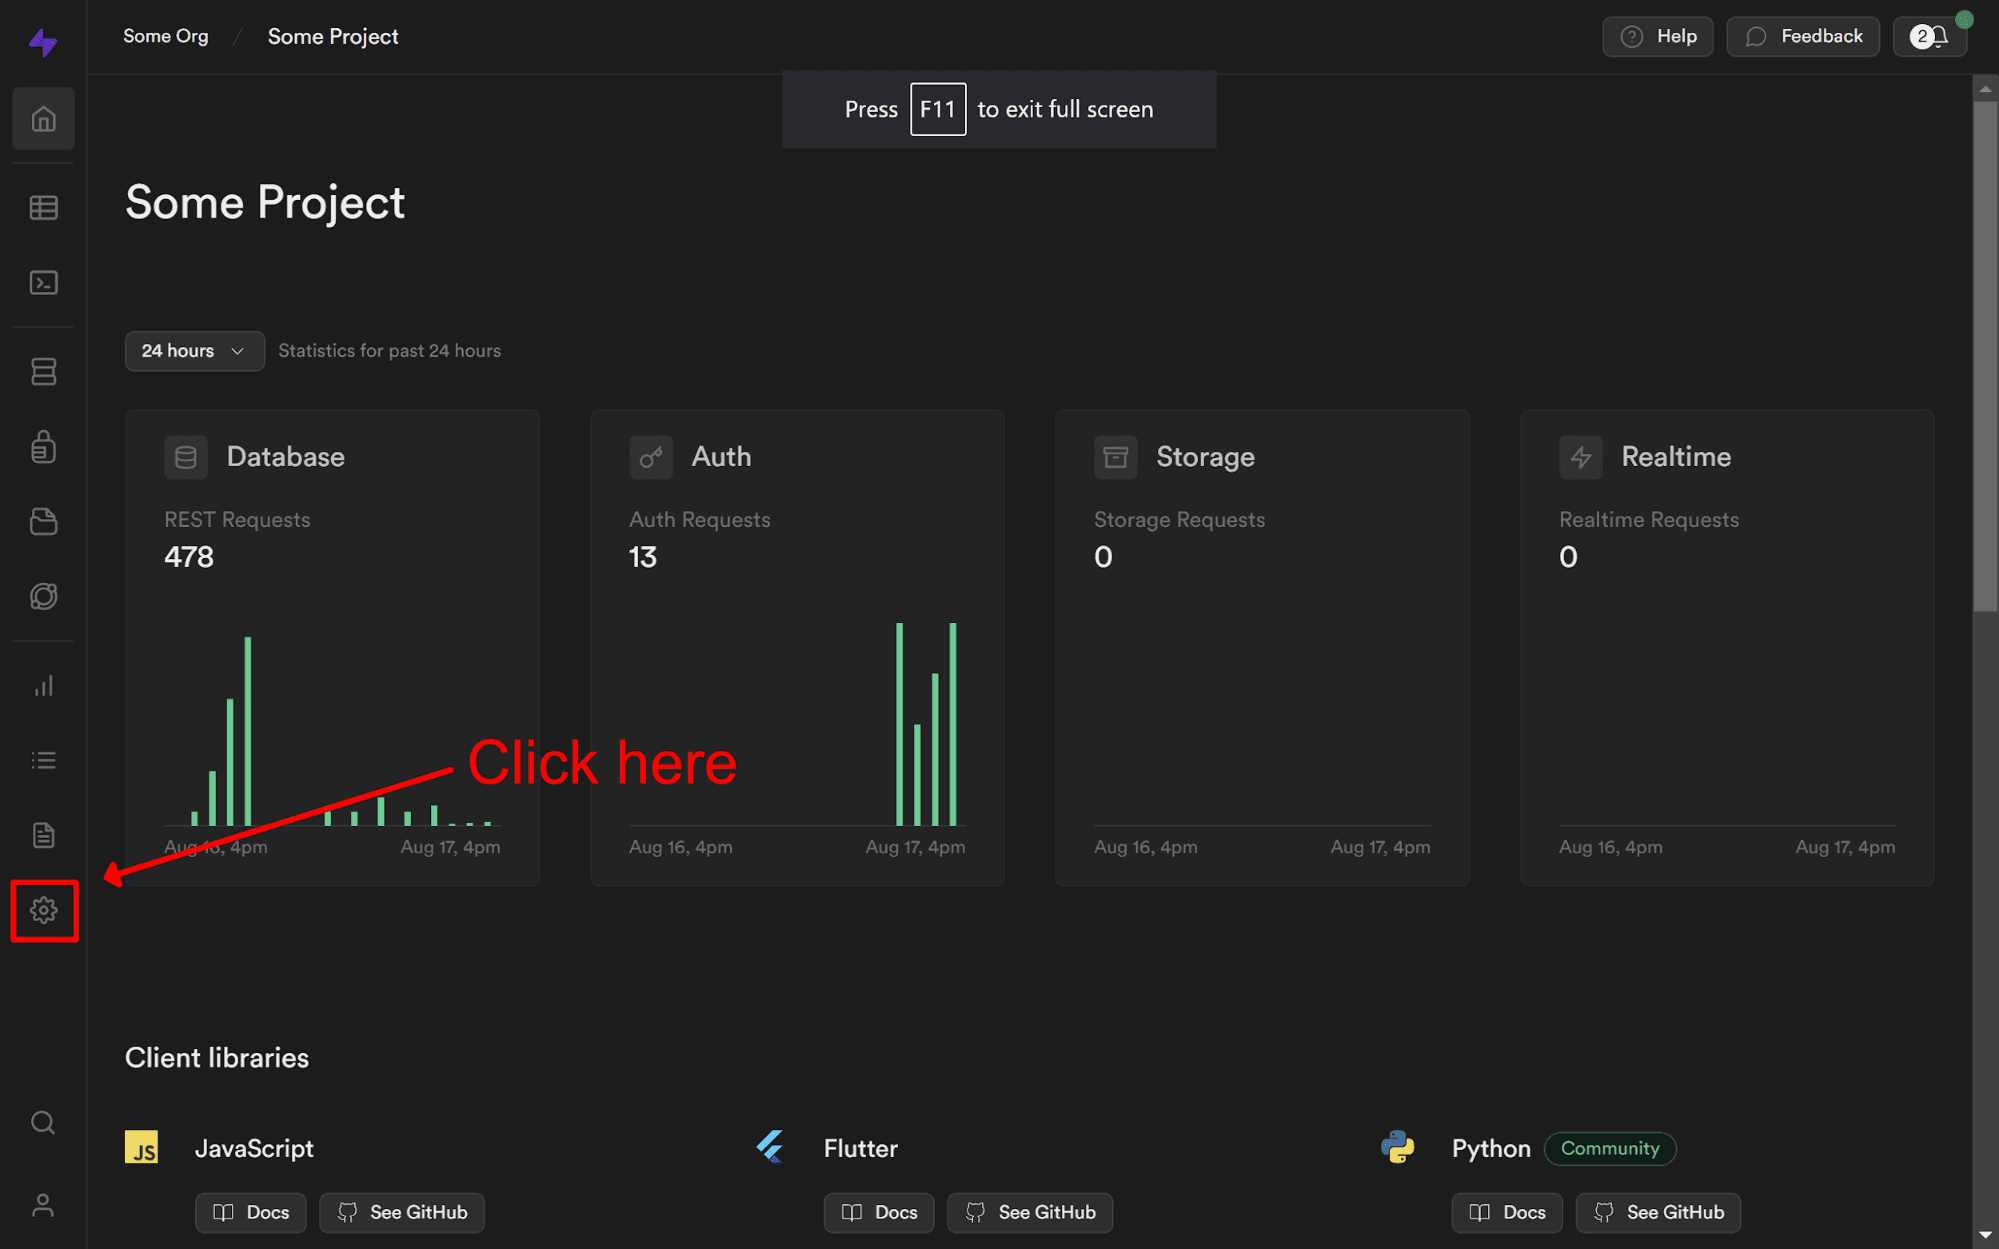
Once there, click on the API section and take note of your project ID and service_role key. These will be used for your URL and authentication respectively.

Once you have everything you need, follow these steps:
- Sign in to your Grafana Cloud account, which is required to use the Metrics Endpoint integration. (If you don’t have a Grafana Cloud account, you can sign up for a forever-free account today.)
- In your Grafana instance, use the left-side navigation to get to the Connections Console (Home > Connections > Connect Data).
- Navigate to the Metrics Endpoint integration, enter your Scrape URL (Prometheus endpoint), choose between Bearer and Basic under “Type of Authentication Credentials,” and test your connection using the Test Connection button.
- If using Supabase, your Scrape URL will be
https://<project-ref>.supabase.co/customer/v1/privileged/metrics, whereproject-refis your project ID we recorded in the previous steps. - Your Basic Auth username will be
service_roleand your password will be your service_role key recorded in the previous steps.

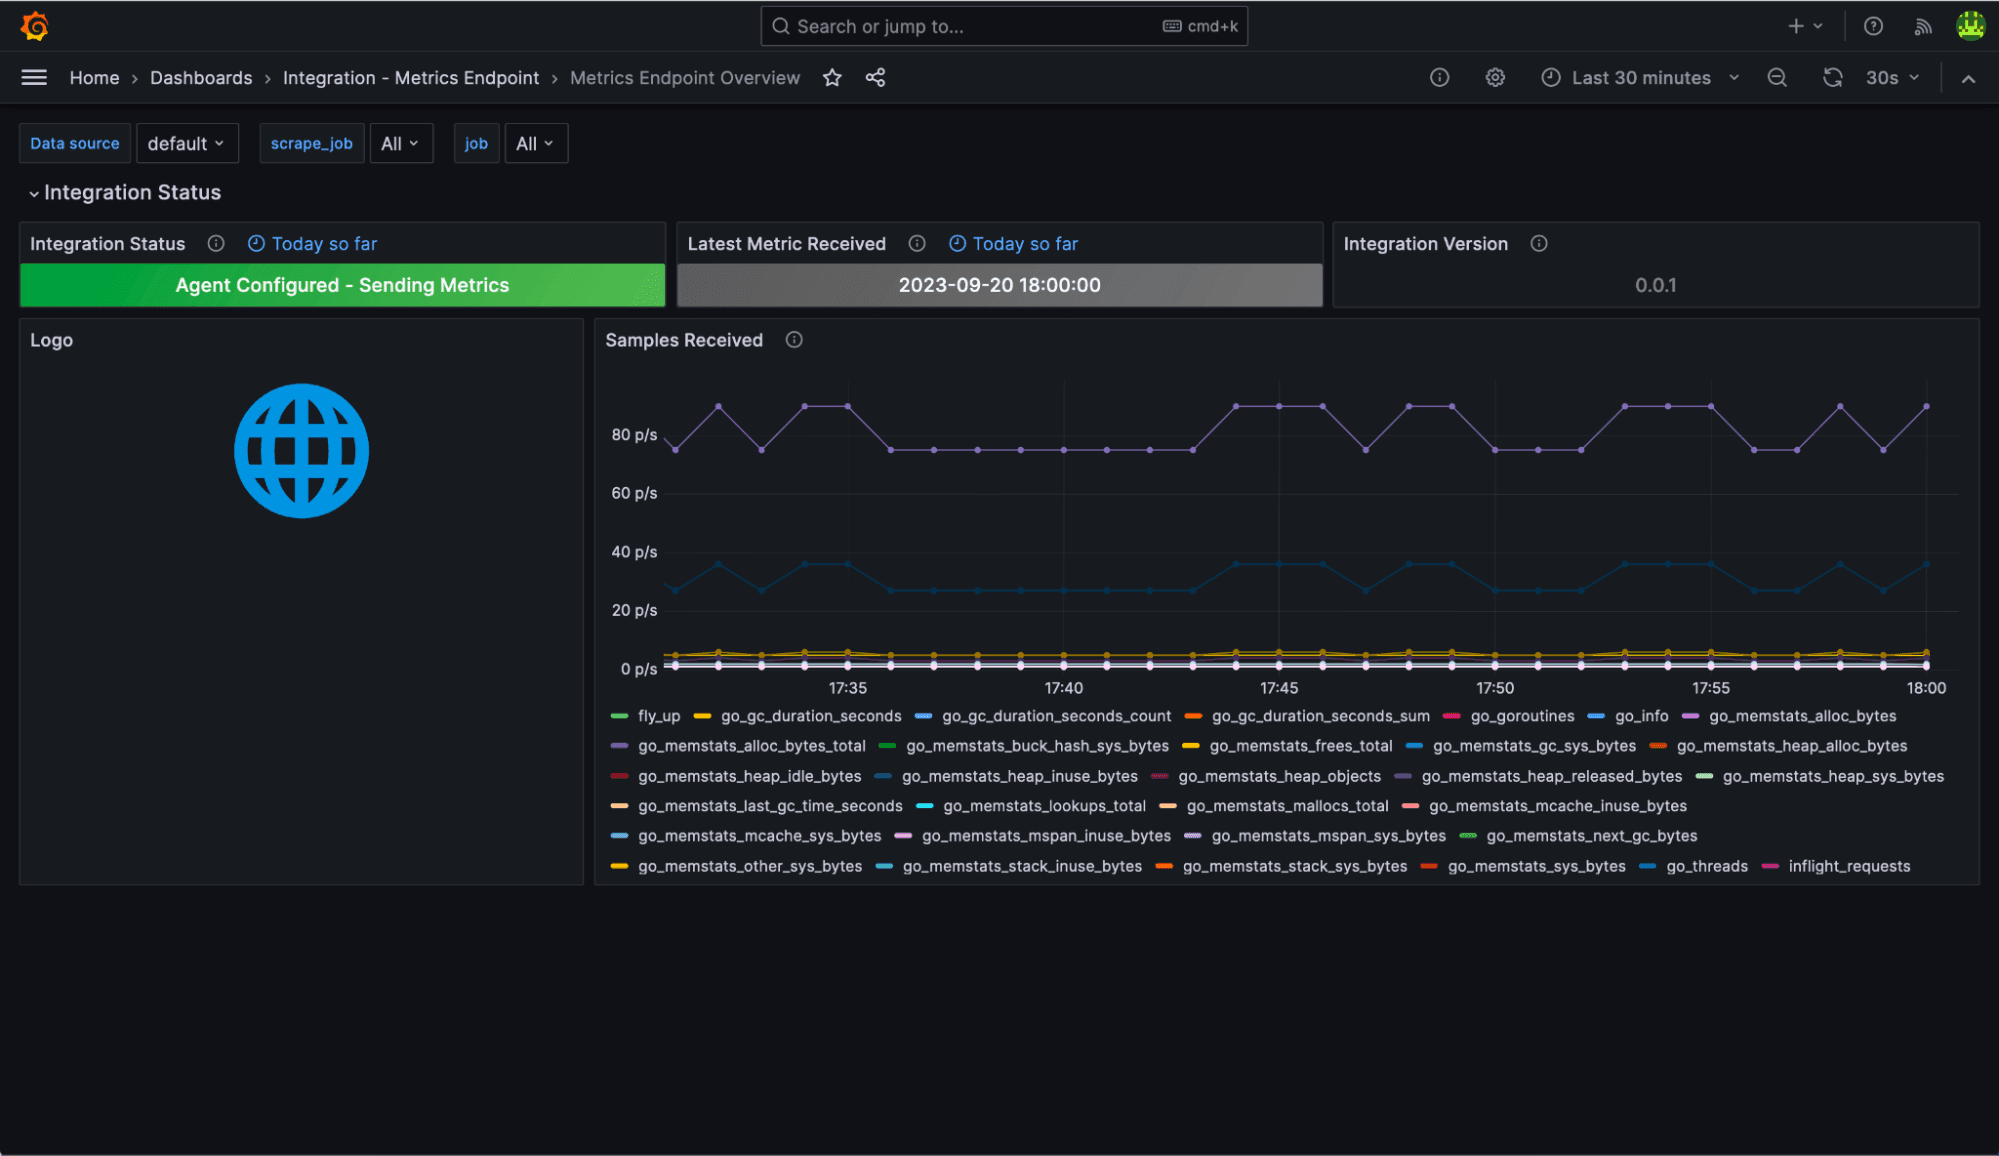
- Finally, save your scrape job and head to the prebuilt dashboard, which is included witht he solution, to see your metrics coming in!
Try out Metrics Endpoint in Grafana Cloud today
As we’ve shown above, the Metrics Endpoint integration can help you get your metrics monitoring up and running quickly and easily with only a few clicks. The integration is available now for Grafana Cloud, so try it out and let us know what you think! You can reach out to us in our Grafana Labs Community Slack in the #Integrations channel.
And if you’re looking to monitor additional environments, check out our solutions page for a list of other tools and platforms we can help you visualize and monitor with Grafana Cloud. At Grafana Labs, we have a “big tent” philosophy of providing a consistent experience across as many data sources and environments as possible, and we’re continuing to expand our solutions to support our community’s needs.
Grafana Cloud is the easiest way to get started with metrics, logs, traces, and dashboards. We recently added new features to our generous forever-free tier, including access to all Enterprise plugins for three users. Plus there are plans for every use case. Sign up for free now!

