
Inside Prezi’s cost-saving switch to Grafana Alerting, Grafana OnCall, and Grafana Incident from PagerDuty
Alexander is Senior SRE at Prezi, a video and visual communications software company. As a team, the Prezi SREs provide multiple services within the company. One of those is the observability stack where Prezi heavily relies on Grafana.
Companies are always evolving to run more smoothly, serve their customers better, and operate in a way that is cost-effective. At Prezi, one of the most recent shifts we’ve gone through to serve all three of those goals is to switch the tool we use to deal with our incidents and outages.
We hadn’t been planning to make a change, but after we switched to Grafana Cloud for log management (which is powered by Grafana Loki), we realized that Grafana Cloud’s Incident Response & Management (IRM) suite — which includes Grafana Alerting, Grafana OnCall, and Grafana Incident — automatically became available to us. At the time, we were using PagerDuty as our escalation tool, and since we were looking for possible cost optimizations everywhere in the tech stack, the SRE team decided to check if it could be replaced with Grafana IRM.
In this post, I’ll walk you through the process of how we compared the features of the platforms, our migration to Grafana Cloud IRM, and how it’s been working for us so far.
Spoiler: It’s been a great alternative in terms of both ease of use and cost.
Our PagerDuty past
At the time we started to look into a possible migration away from PagerDuty, we’d been using it as our incident and escalation management tool for nine years. We had 133 services report to it, and there were 94 individual users in 27 teams using it.
Engineers at Prezi are grouped into teams, and escalation policies are created for each team. Participating engineers would get a PagerDuty account if they were part of an escalation policy. When an incident occurred, PagerDuty would use a what is called a service object that had a link to the escalation policy for the team that was responsible for that service. Notifications to that service could be triggered through Prometheus Alertmanager, among other things.
Prezi also has Slack workflows to notify people in the case of an incident. All of those configurations were built using the PagerDuty terraform provider.
Our introduction to Grafana Cloud IRM
The headline on the web page for Grafana Incident Response & Management says, “Detect, respond, and learn from your incidents all within Grafana Cloud,” and that caught our attention. We also saw that with the integration in the Grafana UI, the workflow is seamless and does not require multiple context switches when dealing with issues. The workflow and automated escalations are also powered by Grafana OnCall, which is an open source tool and could run self-hosted.
Comparing features
To get a better understanding of how the Grafana IRM suite compared to our existing tool, our SRE team focused on the features we were using in PagerDuty — especially our must-haves, such as collecting alerts and escalating them to the appropriate team.
We also searched for answers to these core questions:
- Can IRM do the escalation work for us?
- Is IRM giving users the same flexibility in setting up personal notifications?
- Can the configuration be automated?
Finally, we looked to see if we could find the equivalents to PagerDuty features in IRM. Both tools cover roughly the same feature set, so while there were some blurry edges where the sets are not congruent, the differences were not at the core.
Here is a look at the comparison table we created:

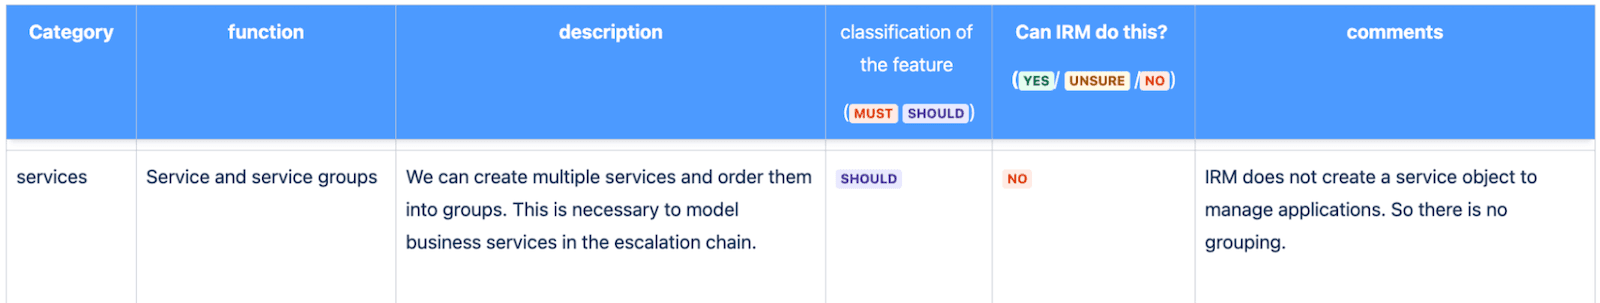
Ultimately, there were no showstoppers, so what tipped the scales in IRM’s favor was the annual cost, which we calculated would save us tens of thousands of dollars per year.
Migrating to Grafana IRM
It took us roughly four weeks to rebuild the config in IRM and migrate the teams over. (We learned late in the migration process that there is a tool from Grafana that can help with that.) Before creating the initial set of configurations in IRM, we analyzed our existing PagerDuty config. Since we were operating under a tight deadline, we opted for a lift-and-shift approach: Instead of optimizing the configuration at the beginning of the transition, we rebuilt the existing one. That enabled us to act fast.
In our existing Alertmanager config in Prometheus, we had a routing configuration for each of the mentioned PagerDuty services. Alerts are labeled with target=pagerduty:service_name and then routed to the PD service endpoints. It looked like this pseudo code example:
global:
    routes:
     - matchers:
       - target="pagerduty:service_a"
       receiver: pagerduty_service_a
(...)
receivers:
 - name: 'pagerduty_service_a'
   pagerduty_configs:
    - service_key: <key_service_a>
Because of this config, we could duplicate alerts and send them to IRM early in the migration without disturbing the existing process. It was important to set the continue attribute to true so alerts are processed further by Alertmanager.
global:
   routes:
    - matchers:
          - target=~"pagerduty.*"
      receiver: grafana_oncall_alerts
      continue: true
To support the onboarding flow in the new tool, we created a detailed guide that walked the engineers through the process of creating a user profile, setting personal notification preferences, and understanding the different parts of the new tool. We also encouraged teams to double-check the new configuration so that nothing was forgotten.
After all teams confirmed that things were good to go, we disabled forwarding alerts to PagerDuty and the account was deleted.
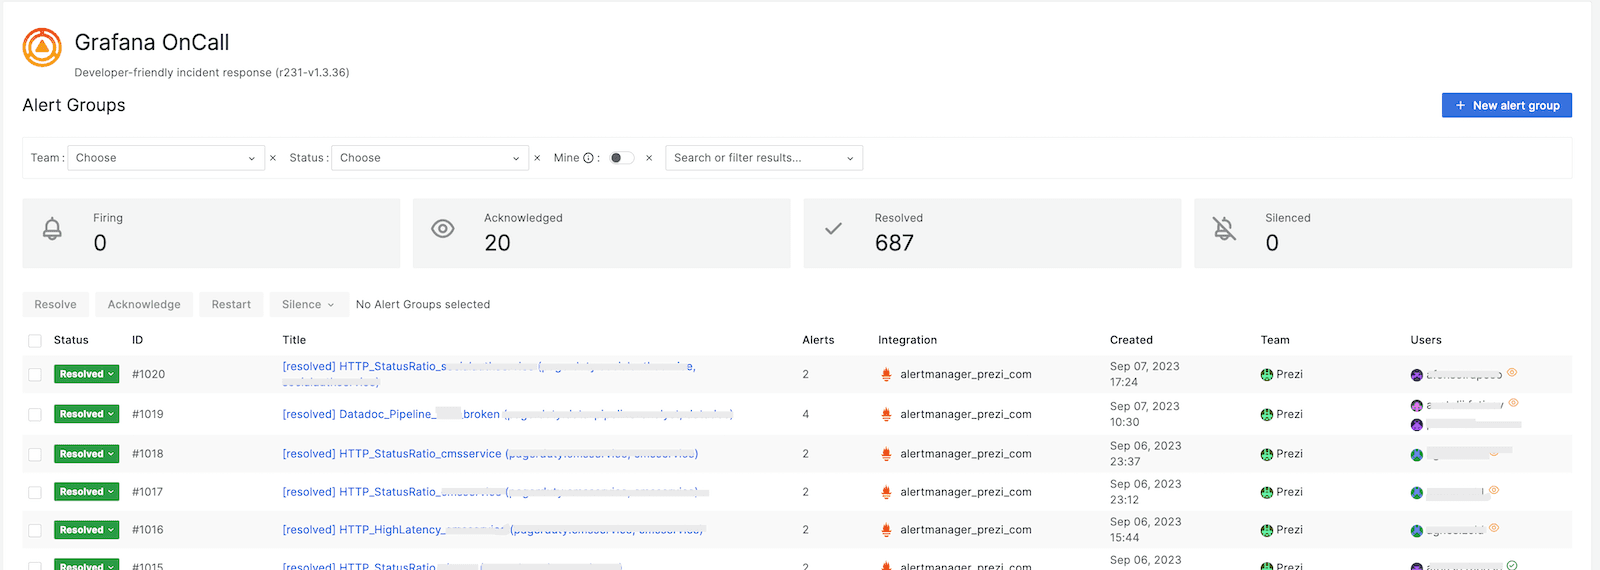
This is now how we now manage our Alert Groups in Grafana OnCall:
Lessons learned
A migration process creates opportunities to learn different things. These are the lessons that stuck with us after we were able to sunset our PagerDuty account.
1. Only migrate configs that are used. Our original tool had been used for nine years during different phases of Prezi’s life, so it contained a lot of unused configurations. We hadn’t regularly cleaned things up, so we lost a lot of time removing things from the new tool that were migrated but not needed. What we should have done is let teams filter out the configs they needed and only migrate those.
2. Unexpected issues may arise. Over time, Prezi’s PagerDuty usage had changed from a ClickOps approach to an infrastructure-as-code approach via Terraform. Sadly, only part of that newer configuration was transferred to code in that process. To fix that, we went through the web interface one service at a time to check the real configuration and find missing pieces
3. The Terraform provider has limitations. In order to keep the number of endpoints low, we decided to create one central integration in IRM and route alerts from there to different teams. We learned that the Terraform provider for Grafana OnCall cannot append resources from different teams to that one central integration — it can only be achieved via the web interface. Since we didn’t want to rely on manual configuration, we created a meta team that contains all of our users that own all the resources. That way, we could completely create the IRM configuration via Terraform and automate changes.
4. Think about testability. Migrating an escalation tool from one platform to another and then waiting on new escalations so you have proof that the transition was a success is not a good engineering approach. Although IRM allows users to create test alerts, we learned it’s smart to create escalations for each individual route in order to check the configuration to the end.
Overall outcome
Since our migration, we’ve been using Grafana Cloud IRM successfully, and it has proven to be a good alternative to PagerDuty. The transition was a smooth process as IRM offers similar functionality to Pagerduty, and our collaboration with Grafana Labs enabled us to remove impediments we found during the migration.
Want to share your Grafana story and dashboards with the community? Drop us a note at stories@grafana.com.

