
Introducing Grafana Beyla: open source ebpf auto-instrumentation for application observability
Update: During the opening keynote of ObservabilityCON 2023 on Nov. 14, we announced that Grafana Beyla is now generally available with the release of Beyla 1.0. For more information on the latest enhancements and features in the open source ebpf auto-instrumentation tool, check out our latest blog post.
Do you want to try Grafana for application observability but don’t have time to adapt your application for it?
Often, to properly instrument an app, you have to add a language agent to the deployment or package. And, in languages like Go, proper instrumentation means manually adding tracepoints. Either way, you have to redeploy to your staging or production environment once you’ve added the instrumentation.
Auto-instrumentation flattens the adoption curve for application observability. That’s why we’re proud to introduce Grafana Beyla, an open source eBPF auto-instrumentation tool that is now in public preview. Beyla reports span information for basic transactions as well as RED metrics (Rate-Errors-Duration) for both Linux HTTP/S and gRPC services — all without requiring any code modification to manually insert probes
In this blog post, we will walk through how to set up and configure Grafana Beyla with Grafana Cloud for better application observability. Plus we will share our vision for what’s next on Beyla’s roadmap.
Why is it called Beyla?
As with many of our open source projects, we focused on our Scandinavian roots and chose the name Beyla from Norse mythology.
What is eBPF?
eBPF stands for Extended Berkeley Packet Filter, and it allows attaching your own programs to different points of the Linux kernel. eBPF programs run in privileged mode to allow inspecting runtime information from different parts of your kernel: system calls, network stack, and even inserting probes in your user space programs.
The eBPF programs are safe, as they are compiled for their own Virtual Machine instruction set and then can run in a sandbox environment that pre-verifies each loaded program for safe memory access and finite execution time. Unlike other technologies, such as the older, native-compiled Kprobes and Uprobes, there is no chance that a poorly programmed probe makes your kernel hang.
After being verified, the eBPF binaries are compiled Just-In-Time (JIT) to the host native architecture (x86-64, ARM64, etc.) for efficient and fast execution.
The eBPF code is loaded from ordinary programs running in the user space, and both kernel and user space programs can share information through a set of communication mechanisms that are provided by the eBPF specification: ring buffers, arrays, hash maps, etc.

How to set up a service to instrument
To run Grafana Beyla, you first need a service to instrument. For this quick start tutorial, we recommend instrumenting any HTTP, HTTPS, or gRPC Go service that uses any of the following libraries:
- Standard
net/http
Additionally, you can also instrument HTTP and HTTPs services written in other languages: NodeJS, Python, Rust, Ruby, Java (only HTTP), etc.
If at this moment you don’t have a concrete executable to instrument, you can create a simple service just for testing. Create a server.go plain text file and open it in your editor to paste the following code:
package main


import (
    "net/http"
    "strconv"
    "time"
)


func handleRequest(rw http.ResponseWriter, req *http.Request) {
    status := 200
    for k, v := range req.URL.Query() {
        if len(v) == 0 {
            continue
        }
        switch k {
        case "status":
            if s, err := strconv.Atoi(v[0]); err == nil {
                status = s
            }
        case "delay":
            if d, err := time.ParseDuration(v[0]); err == nil {
                time.Sleep(d)
            }
        }
    }
    rw.WriteHeader(status)
}


func main() {
    http.ListenAndServe(":8080",
                 http.HandlerFunc(handleRequest))
}
The above HTTP service will accept any request in the port 8080, and allows overriding the behavior by means of two query arguments:
statuswill override the returned HTTP status code (which defaults to 200). For examplecurl -v "http://localhost:8080/foo?status=404"will return a 404 status code.delaywill artificially increase the service response time. For example,curl "http://localhost:8080/bar?delay=3s"will require 3 seconds to send the response.
You can download the server.go file from this tutorial and run it by:
$ go run server.go
Download Grafana Beyla
ℹ️ For simplicity, this tutorial shows how to manually run Beyla as an ordinary operating system process. For more running modes, you can check out the documentation about running Beyla as a Docker container or deploying Beyla in Kubernetes.
You can download the Beyla executable from the Beyla releases page in our code repository. Make sure you select the version that is compatible with your processor architecture. For more information, you can refer to the Run Beyla as a standalone process documentation.
Alternatively, you can download the Grafana Beyla executable directly with go install:
go install github.com/grafana/beyla/cmd/beyla@latest
Instrument a running service
Beyla requires at least two configuration options to run:
- A selector of the executable to instrument. You can select it by executable name (
EXECUTABLE_NAMEenvironment variable) or by any port it has open (OPEN_PORTenvironment variable). - A metrics exporter. For this tutorial, auto-instrumented metrics will be exported by a Prometheus scrape endpoint (
BEYLA_PROMETHEUS_PORTenvironment variable), and some traces will be sent to the standard output (setting thePRINT_TRACES=trueenvironment variable).
To learn how to configure other exporters (for example, OpenTelemetry traces and metrics), as well as extra configuration options, please check the configuration section in our Beyla documentation.
After the service from the previous section is running, we can instrument it by executing the beyla command that we previously downloaded, as seen in the Download section of this blog post.
We will configure Beyla to instrument the executable that owns the port 8080, printing the traces via standard output and exposing RED metrics in the localhost:8999/metrics HTTP endpoint.
Remember that you need administrator access to run the instrumenting process:
$ BEYLA_PROMETHEUS_PORT=8999 PRINT_TRACES=true OPEN_PORT=8080 sudo -E beyla
You can now test the instrumented service from another terminal:
$ curl "http://localhost:8080/hello"
$ curl "http://localhost:8080/bye"
After some logs, the beyla standard output should show the traces information of the above requests:
2023-04-19 13:49:04 (15.22ms[689.9µs]) 200 GET /hello [::1]->[localhost:8080] size:0B
2023-04-19 13:49:07 (2.74ms[135.9µs]) 200 GET /bye [::1]->[localhost:8080] size:0B
The format is:
Request_time (response_duration) status_code http_method path source->destination request_size
You can try to play with the curl command to see how it affects the traces. For example, the following request would send a 6-bytes POST request and the service will take 200ms to respond:
$ curl -X POST -d "abcdef" "http://localhost:8080/post?delay=200ms"
And the Beyla standard output will show:
2023-04-19 15:17:54 (210.91ms[203.28ms]) 200 POST /post [::1]->[localhost:8080] size:6B
As another option, in background, you can even generate some artificial load in another terminal:
$ while true; do curl "http://localhost:8080/service?delay=1s"; done
After playing for awhile with the server running in the port 8080, you can query the Prometheus metrics that are exposed in the port 8999:
$ curl http://localhost:8999/metrics
# HELP http_server_duration_seconds duration of HTTP service calls from the server side, in milliseconds
# TYPE http_server_duration_seconds histogram
http_server_duration_seconds_bucket{http_method="GET",http_status_code="200",service_name="testserver",le="0.005"} 1
http_server_duration_seconds_bucket{http_method="GET",http_status_code="200",service_name="testserver",le="0.005"} 1
http_server_duration_seconds_bucket{http_method="GET",http_status_code="200",service_name="testserver",le="0.01"} 1

(... cutting for the sake of brevity ...)
Please check the Beyla exported metrics documentation for an exhaustive list of the metrics that can be exposed by Beyla.
Send data to Grafana Cloud
Once we have verified that our application is correctly instrumented, we can add a Prometheus collector to read the auto instrumented metrics and forward them to Grafana Cloud. (If you don’t already have a Grafana Cloud account, you can sign up for free today!) There are two methods for reading the metrics and forwarding them to Grafana Cloud:
- Install Prometheus in your host and configure the scrape and remote write to read-and-forward the metrics.
- Use the Grafana Agent, which is what this tutorial will show.
Download and configure the Grafana Agent
⚠️ This section explains briefly how to download and configure Grafana Agent for manual playgrounds. For a complete description of the Grafana Agent setup and configuration process plus recommended modes, you can refer to the Install Grafana Agent in Flow mode documentation.
Grafana Agent is a telemetry collector that would facilitate the task of collecting the Prometheus metrics as exported by Beyla and submit them to Grafana.
- Find the latest Grafana Agent release on GitHub.
- For the latest version, pick your preferred package and required architecture. For example, downloading zipped 0.34.3 version for Intel/AMD 64-bit architecture:$ unzip grafana-agent-linux-amd64.zip
- Create a plain text file, for example named
ebpf-tutorial.river, and copy the following text, which will tell Grafana Agent to scrape the Prometheus metrics from Beyla and forward them to Grafana Cloud.prometheus.scrape “default” { targets = [{“address” = “localhost:8999”}] forward_to = [prometheus.remote_write.mimir.receiver] } prometheus.remote_write “mimir” { endpoint { url = env(“MIMIR_ENDPOINT”) basic_auth { username = env(“MIMIR_USER”) password = env(“GRAFANA_API_KEY”) } } } - Observe that it is configured to scrape the metrics in the
localhost:8999address, same as the value of theBEYLA_PROMETHEUS_PORTvariable from the previous section. Also, the connection details to Grafana Cloud (endpoint and authentication), is going to be provided via environment variables.
Run Grafana Agent with your Grafana credentials
In your Grafana Cloud portal, click on the Details button in the Prometheus box. Then get your Grafana Prometheus (Mimir) Remote Write endpoint, your username, and generate and copy a Grafana API Key with metrics push privileges:

Now you run Grafana Agent via using the above information to feed the MIMIR_ENDPOINT, MIMIR_USER, and GRAFANA_API_KEY environment variables:
$ export MIMIR_ENDPOINT="https://prometheus-prod-01-eu-west-0.grafana.net/api/prom/push"
$ export MIMIR_USER="123456"
$ export GRAFANA_API_KEY="your api key here"
$ AGENT_MODE=flow ./grafana-agent-linux-amd64 run ebpf-tutorial.river

ts=2023-06-29T08:02:58.761420514Z level=info msg="now listening for http traffic" addr=127.0.0.1:12345
ts=2023-06-29T08:02:58.761546307Z level=info trace_id=359c08a12e833f29bf21457d95c09a08 msg="starting complete graph evaluation"
(more logs....)
To verify that metrics are properly received by Grafana, you can go to the left panel, choose the Explore tab, and for your Prometheus data source, write http_ in the Metrics Browser input. After generating some HTTP load (for example, using curl as in the previous examples), you should see the new metric names in the autocomplete pop-up. You need to make sure that Beyla is still running as a different process than Grafana Agent.

Add the eBPF RED metrics dashboard
Now, you can start composing your PromQL queries for better visualization of your auto instrumented RED metrics, but to save you time, we provide a public dashboard with some basic information.
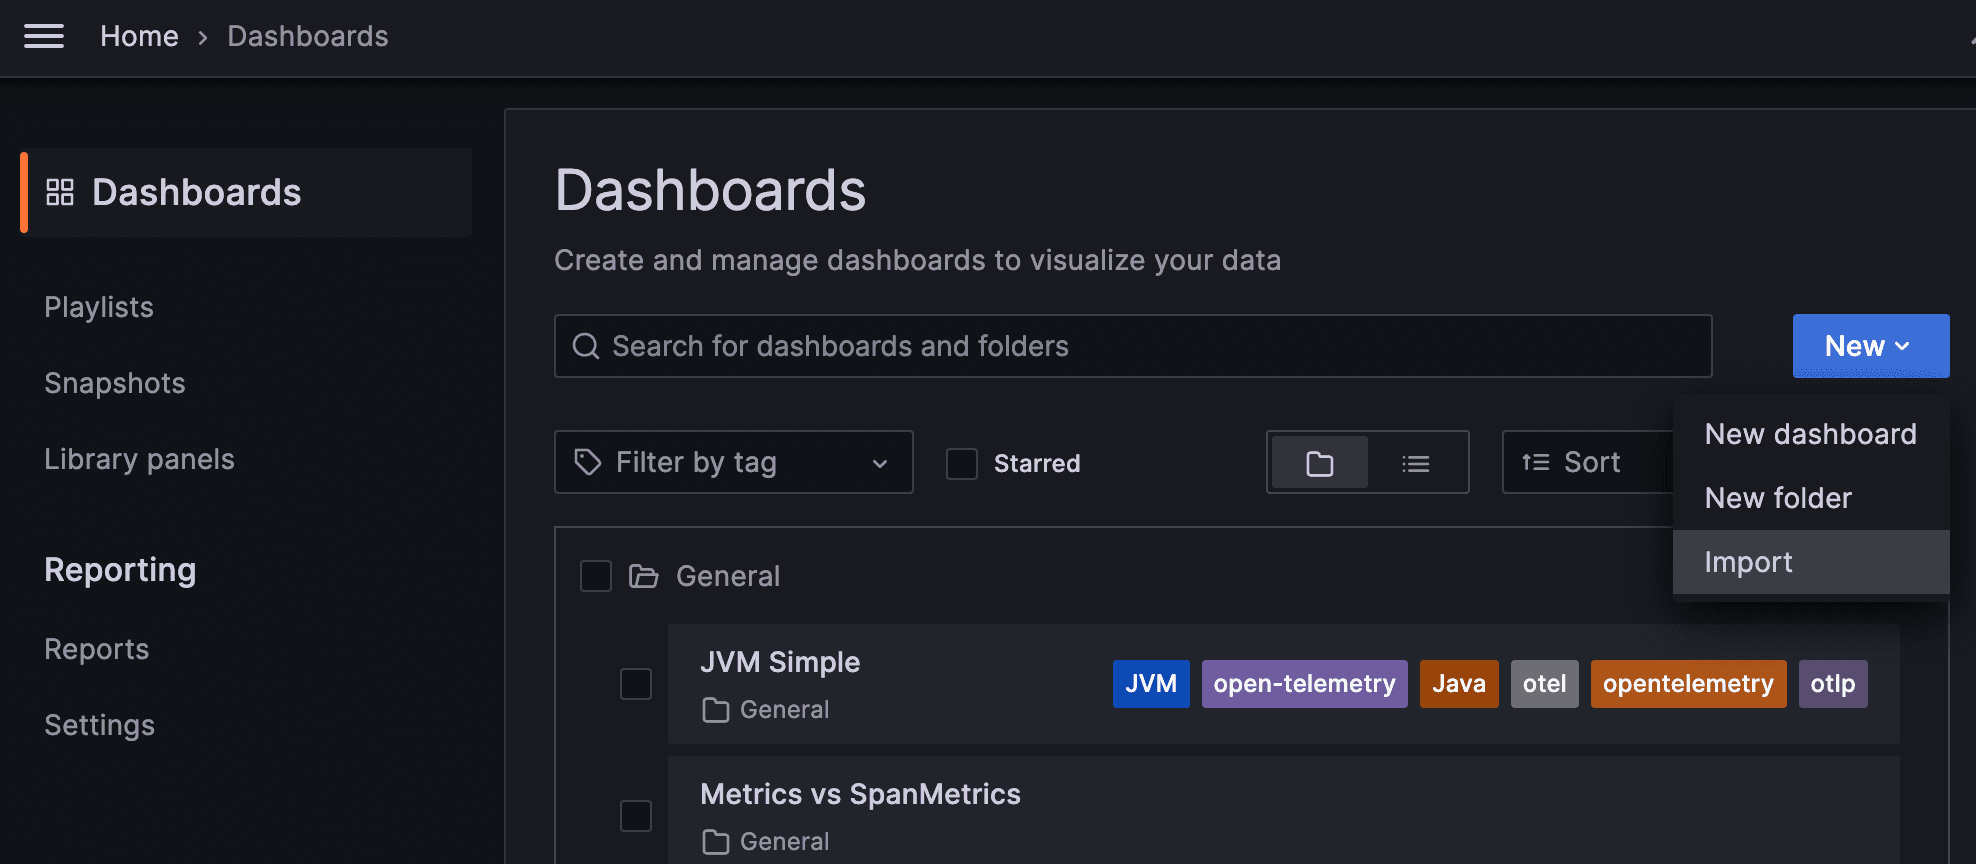
To import the dashboard into your Grafana instance, choose Dashboards in the Grafana left panel. Then in the Dashboards page, click on the New dropdown, and select Import:
In the Import via grafana.com field, you can copy the Grafana ID from the Beyla RED metrics dashboard: 19077.
Rename it at your convenience, select the folder, and most importantly, select the data source in the prometheus-data-source popup at the bottom.
And voilà! You can see your RED metrics:

The dashboard contains the following parts:
- The slowest HTTP routes for all the instrumented services. Since you only have a single service, only an entry appears. If you configure the auto-instrumentation to report the HTTP routes, many entries could appear, such as one for each HTTP path in the server.
- The slowest gRPC methods. Since the test service in this tutorial only serves HTTP, this table is empty.
- A list of RED metrics for the inbound (server) traffic for each instrumented server. This includes:
- Request rate: Number of requests per second, faceted by its HTTP or gRPC return code.
- Error rate: Represented as a percentage of 5xx HTTP responses or non-zero gRPC responses over the total of requests. They are faceted by return code.
- Duration: Average and top percentiles for both HTTP and gRPC traffic.
- A list of RED metrics for the outbound (client) traffic for each instrumented server. In the above screenshot they are empty because the test service does perform HTTP or gRPC calls to other services.
- The request rate, error charts, and duration are analogues to the inbound traffic charts, with the only difference that 4xx return codes are also considered errors in the client side.
At the top of the chart, you can use the Service dropdown to filter the services you want to visualize.
Why use Grafana Beyla for application observability
eBPF has proven to be a fast, safe, and reliable way to observe some basic metrics of your services. Grafana Beyla won’t replace your language agents, but it will decrease the time you need to enable observability in your applications, as it doesn’t need any modification, recompilation, or repackaging. Just run it together with your service, and you will get the metrics.
eBPF also allows you to see some parts that manual instrumentation doesn’t. For example, Beyla is able to show you how much time a request is enqueued after the connection is established until its code is actually executed. (This requires exporting OpenTelemetry traces, but this function is not explained in this tutorial.)
Grafana Beyla has its limitations, too. As it provides generic metrics and simple spans information (not distributed traces, yet), language agents and manual instrumentation are still recommended as well, so you can specify the granularity of each part of the code to be instrumented, putting the focus on your critical operations.
Another limitation to consider is that Beyla requires running with elevated privileges; not actually a root user, but it has to run with the CAP_SYS_ADMIN capability at least. If you run it as a container (Docker, Kubernetes, etc.), it has to be privileged or you have to add the CAP_SYS_ADMIN capability.
What’s next for Grafana Beyla?
Grafana Beyla is currently in public preview. In the future, we plan to add metrics for other well-established protocols, like database or message queuing connections.
Also, it is important to work on distributed tracing, so you won’t only get isolated spans, but you will also be able to relate them with requests from other services (e.g., web, database, messaging). It is complex due to the implications of being able to redo client-side headers and put them in the same context as server-side requests, but we plan to make iterative improvements and small steps towards distributed tracing.
Another future task is to reduce the surface of the code that requires administrative privileges, executing a small eBPF loader with root or CAP_SYS_ADMIN privileges and running the rest of data processing/exposition with normal user privileges.
To learn more, you can find Grafana Beyla in GitHub and check out our Grafana Beyla documentation, which includes a guide to deploying Beyla in Kubernetes and more.

