How to use the Grafana Faro Web SDK with Grafana Cloud Frontend Observability to gain additional app insights
Frontend observability (or real user monitoring) is a critical, yet often overlooked, part of systems monitoring. Website and mobile app frontends are just as complex, if not more so, than the backend systems observability teams typically prioritize. They also represent the first interaction users have with our applications — so it’s important to have full visibility into that experience.
Additionally, having that visibility and being able to correlate page timings and errors on the frontend can save you time when troubleshooting backend issues. Making these correlations, however, isn’t possible if you deploy an application using a managed service.
For example, if you are an online retailer and use a third-party e-commerce platform for the frontend of your storefront app, you don’t have access to the backend infrastructure and applications to pull metrics from. Fortunately, you can install Grafana Faro, the open source frontend JavaScript agent, to get page speed timings, errors, and other types of rich data to make sure your site is performing optimally.
Why use Grafana Faro and Grafana Cloud Frontend Observability to collect custom metrics?
One of the best parts of using Faro and Grafana Cloud Frontend Observability, our hosted service for real user monitoring, is not just the quick setup time, but the flexibility it provides in collecting custom metrics, events, and logs. Incorporating custom events and metrics into Frontend Observability with Faro enables you to:
- Query this data however you like, alongside any other metrics
- Collect business data from the “source” without having to wait for business intelligence (BI) tools to run
- Collect additional metrics when using a managed service
- Correlate user browser session data to business metrics
We are going to explore how these capabilities can be applied to an e-commerce application to get more insights into user activity on top of the automatically collected metrics from the Grafana Faro Web SDK.
In this tutorial you will:
- Deploy a basic web application
- Install the Faro Web SDK
- Observe the automatically collected metrics inside Grafana Cloud Frontend Observability
- View custom-implemented session data and events with Grafana Cloud Logs
For this exercise, you will need a Grafana Cloud account. You’ll also need to have a basic understanding of:
- Web development (specifically, HTML and JavaScript)
- Git
- Node and node package manager (NPM)
- Docker
- Grafana k6 (optional)
(Note: For a deeper introduction to Grafana Cloud Frontend Observability, check out this blog post.)
Step 1: Create a frontend application in Grafana Cloud
First, in the Grafana Cloud UI, navigate to Home → Observability → Frontend. Then, select Create New App.
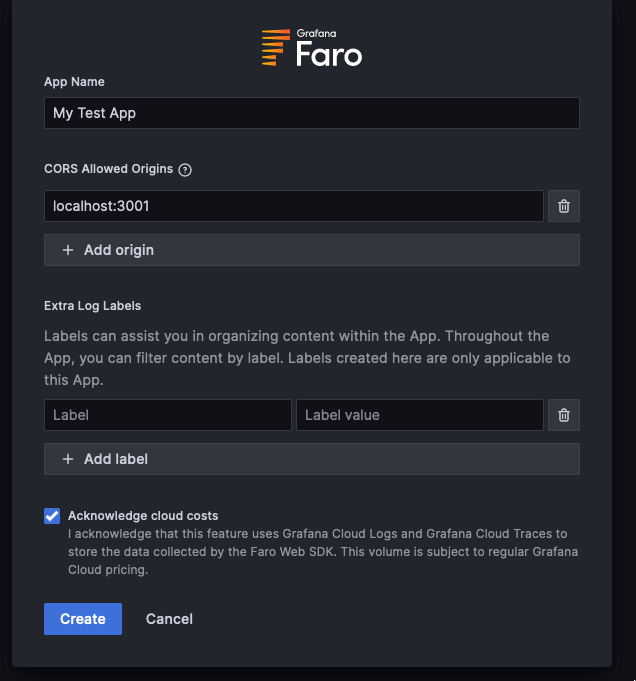
Fill in the App Name and CORS Allowed Origins fields, as shown in the screenshot below. By default, the test app will run on localhost:3001, so add it as an Allowed Origin.
You can also complete the Extra Log Labels field to identify your app later, when parsing logs in Grafana Cloud Logs, but it’s not required. By default, the app will have a label with the app name you assign, so you can identify it.
Step 2: Run the application!
Clone the repo from: https://github.com/mcove11/FaroCustomMetrics
Follow the directions in GitHub to run the app; you’ll notice it’s very simple, consisting of only a few files. The repo also includes an option for running the app with Docker, as well as a k6 test script we can use, optionally, in the next step.
Step 3: Add the Faro Web SDK and test
In Grafana Cloud, navigate to the Web SDK Configuration page, as shown below. Select the tab CDN without Tracing and copy the contents from it.
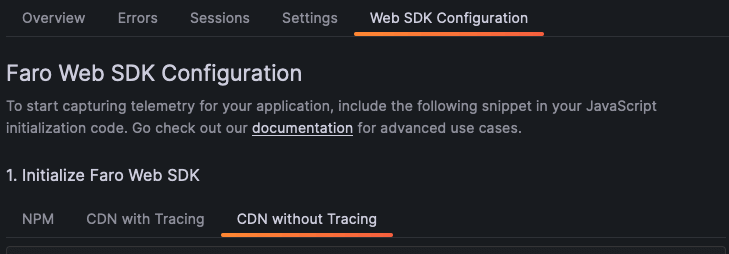
Open up farowebapp/public/views/index.html in your file editor and copy and paste the config into the
element. Save the file and restart the node application.Navigate to the page in a web browser with http://localhost:3001 and you will be presented with the simple test app:
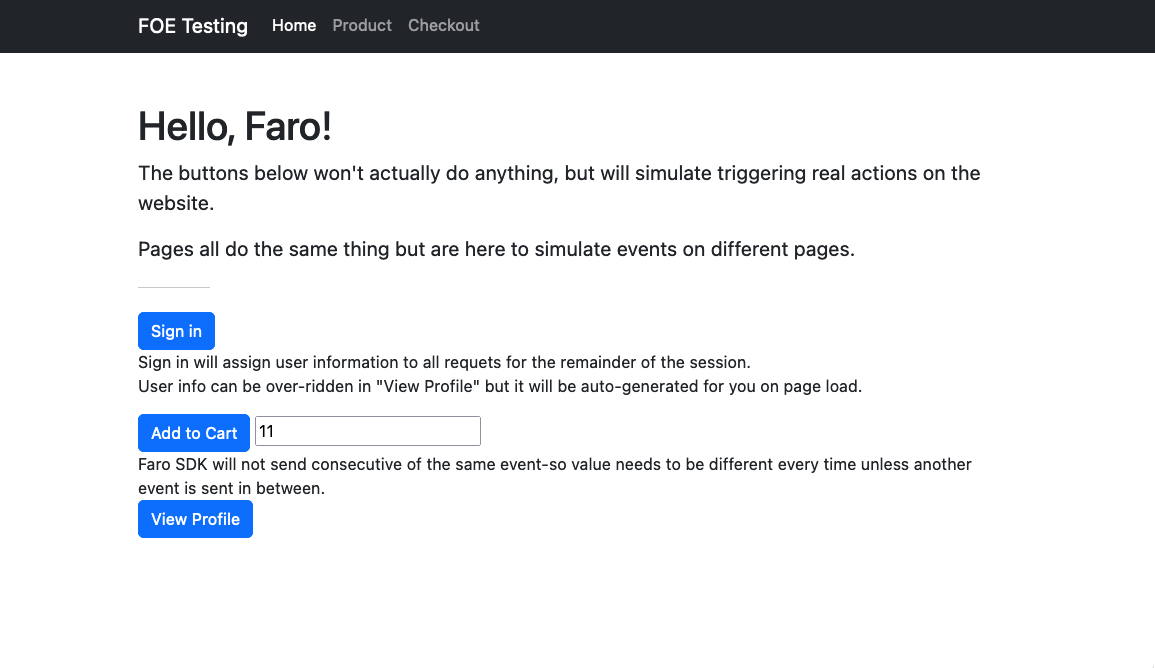
Sign in, and click the Add to Cart button a few times. Refresh the page, too, to get a few more page hits. As another option, you can also run the k6 script in the GitHub repo to automate this part of the process.
Back in Grafana Cloud, we can see the results of this data coming through. Head to the Overview tab to start observing some metrics:
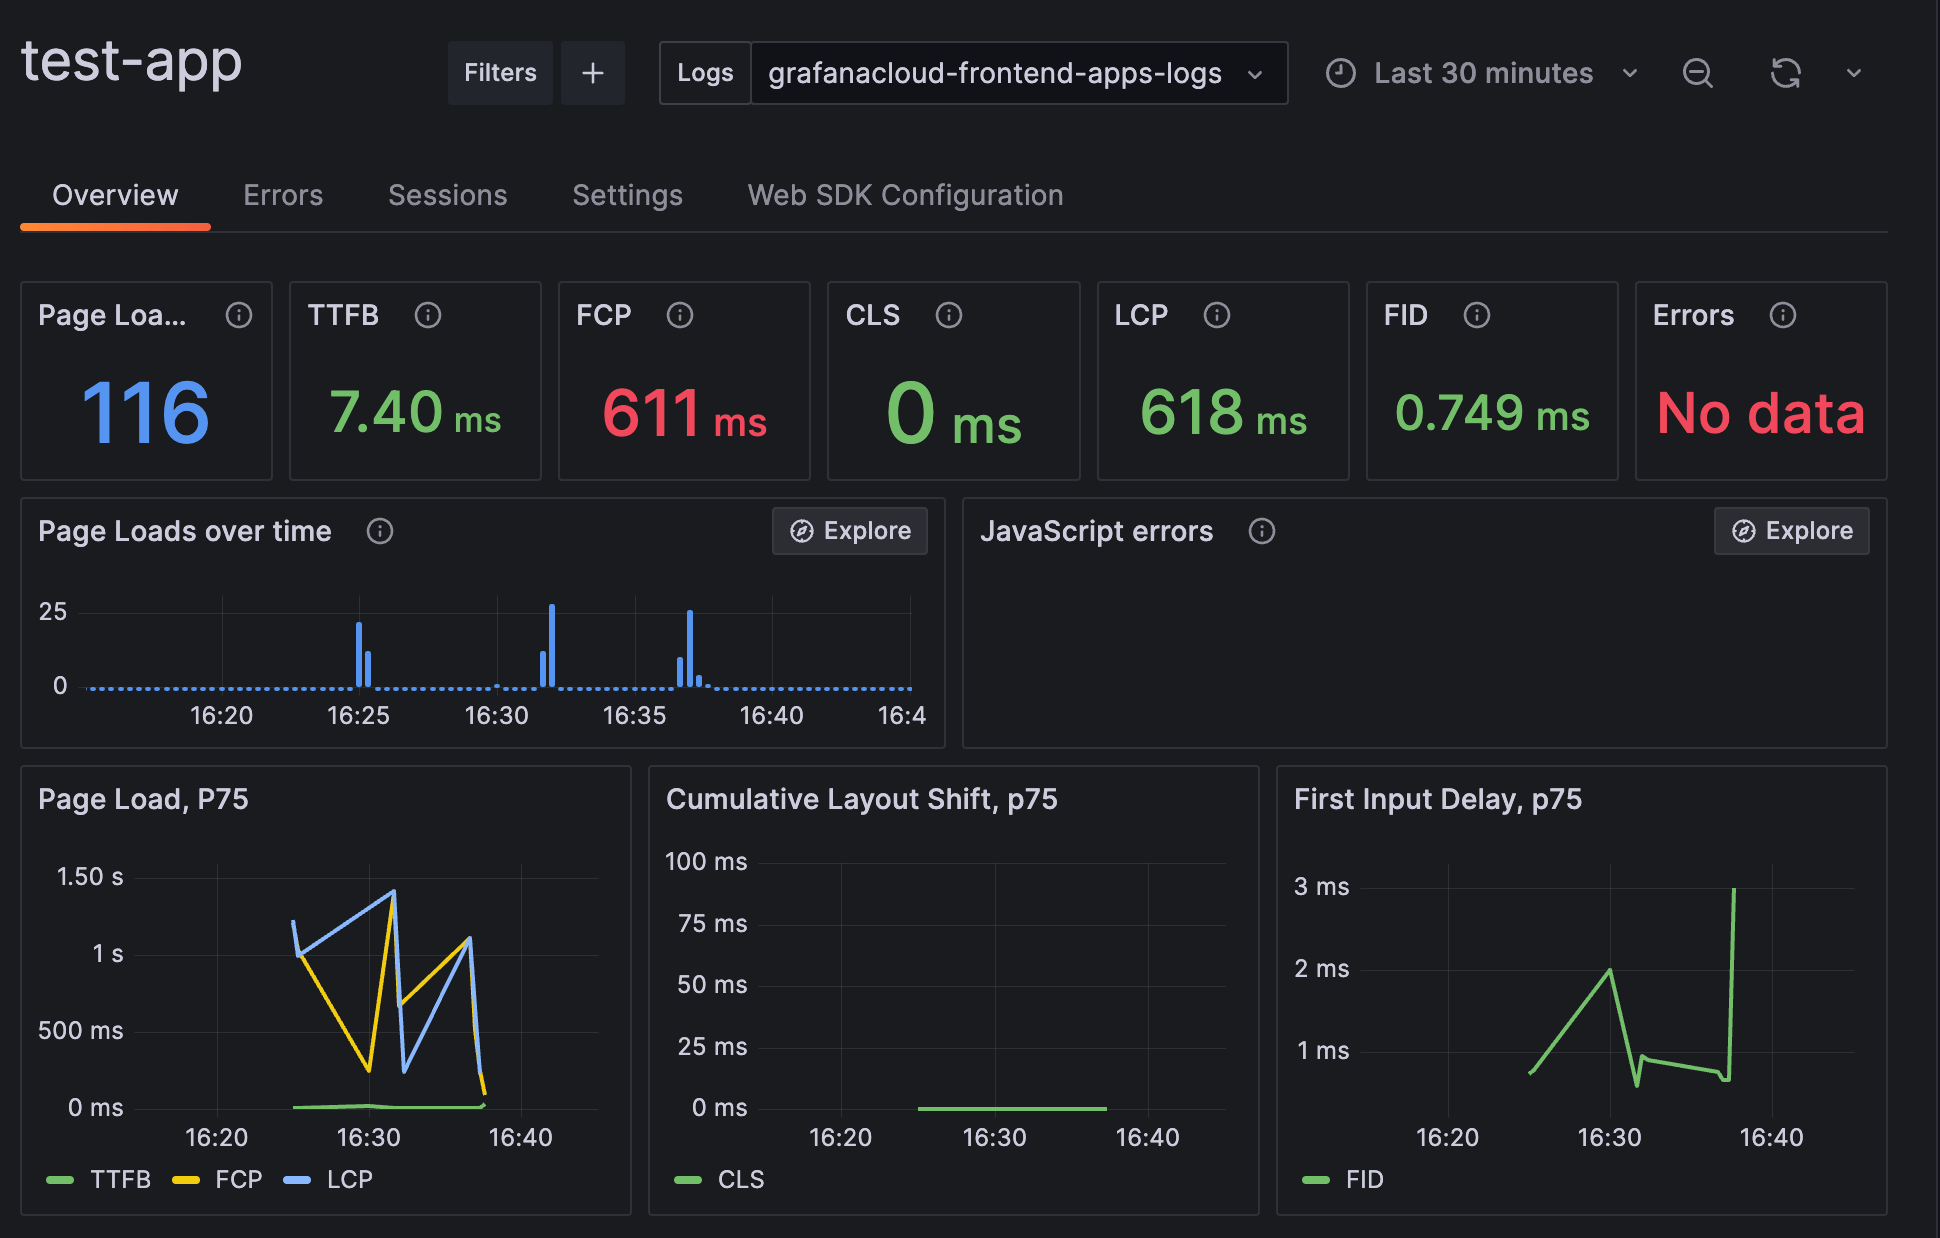
Pretty cool, right? This information can be used for troubleshooting slow load page times and errors, but it’s only the start of what Faro is capable of.
What if we wanted to record other business-specific metrics and events?
Step 4: Query and view custom metrics and events
By adding the Faro Web SDK to our sample application, as we did in step 3, we can now view some custom measurements and events.
Import the prebuilt dashboard into Grafana Cloud with the dashboard.json file that is included in the GitHub repo. Before we look at the dashboard, let’s see what is going on under the hood.
We added two custom events: a SignIn event that will capture user-specific information upon sign-ins, as well as a CartAdd event that will capture the value of users’ shopping carts. For the first custom event, we set some user info in main.js:
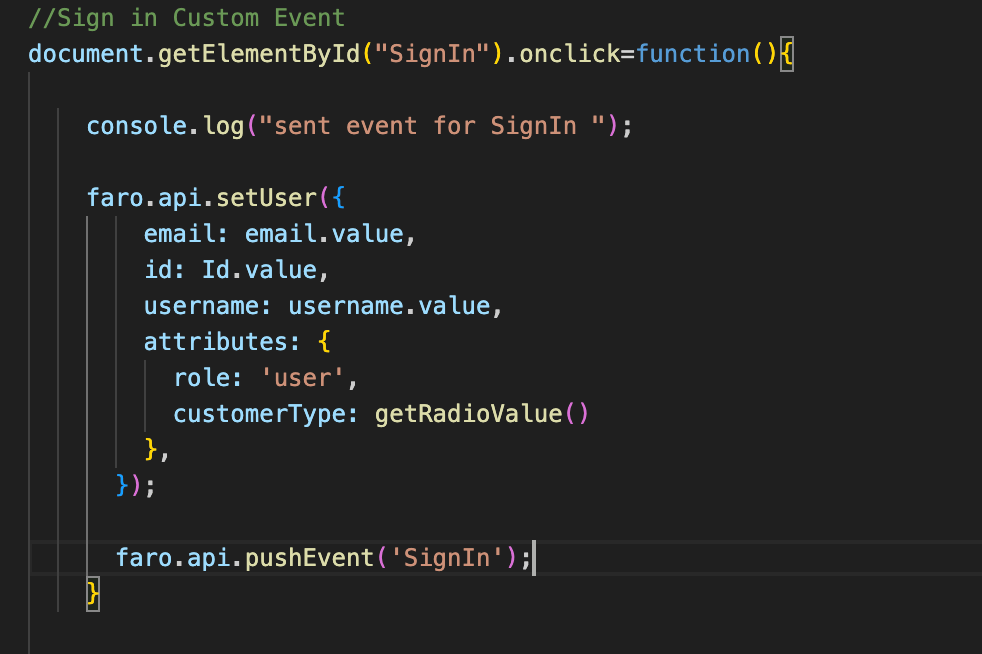
Here we call setUser() from the Faro Web SDK, which will set user-specific information inside the SDK session. The data in this example is randomly generated on page load, but you can override it on the web page by selecting View Profile. In a real-life example, you would probably have variables you could grab off of your web page to use here. In many cases, a data layer is already present if you are using Google Analytics.
Any data inside setUser() will be attached to future events.
We then send a SignIn event. This is a basic event that has no other information attached to it.
The other custom event we are sending here is when a product is added to a cart:
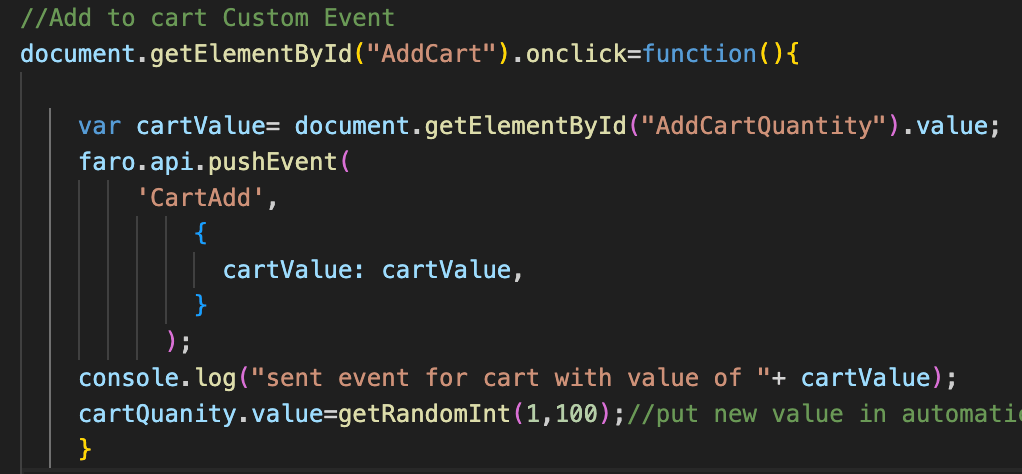
Similar to SignIn, we are using pushEvent(), but this time, we are adding a cart value with it.
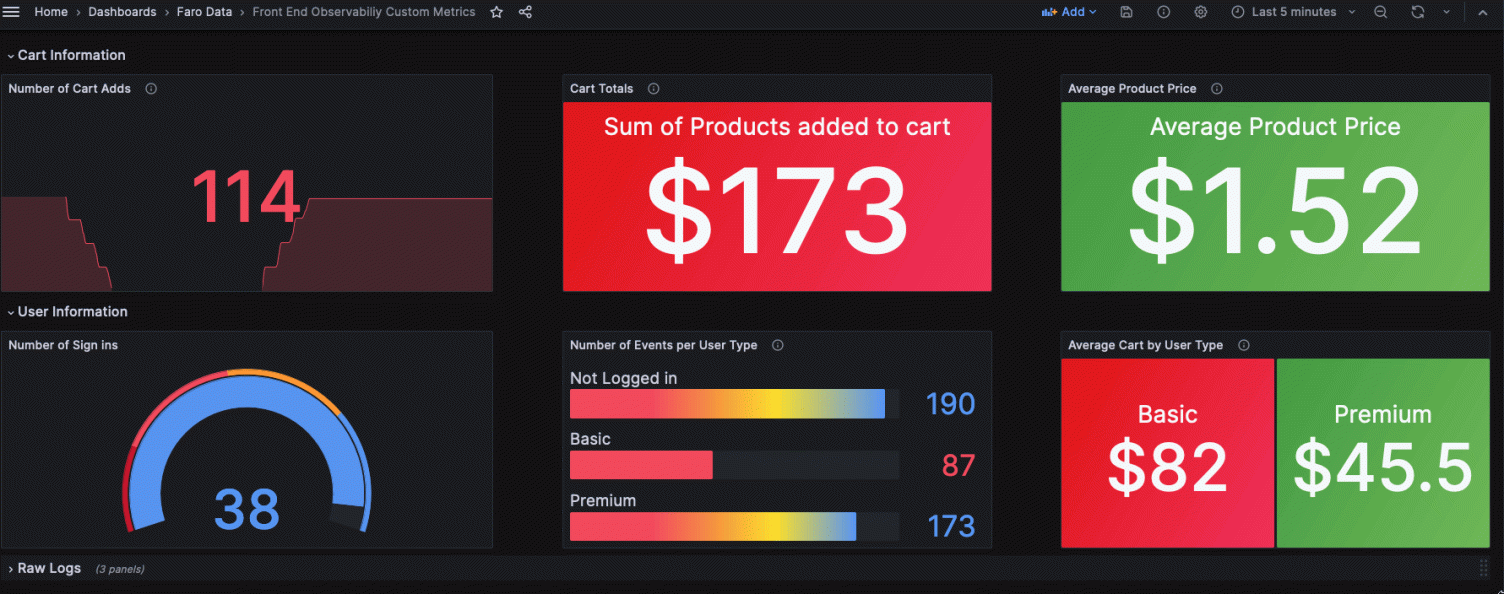
The Faro Web SDK sends all events to our Grafana Cloud Logs instance. Then we can use LogQL and Metric queries to add some business-level data to our dashboards:
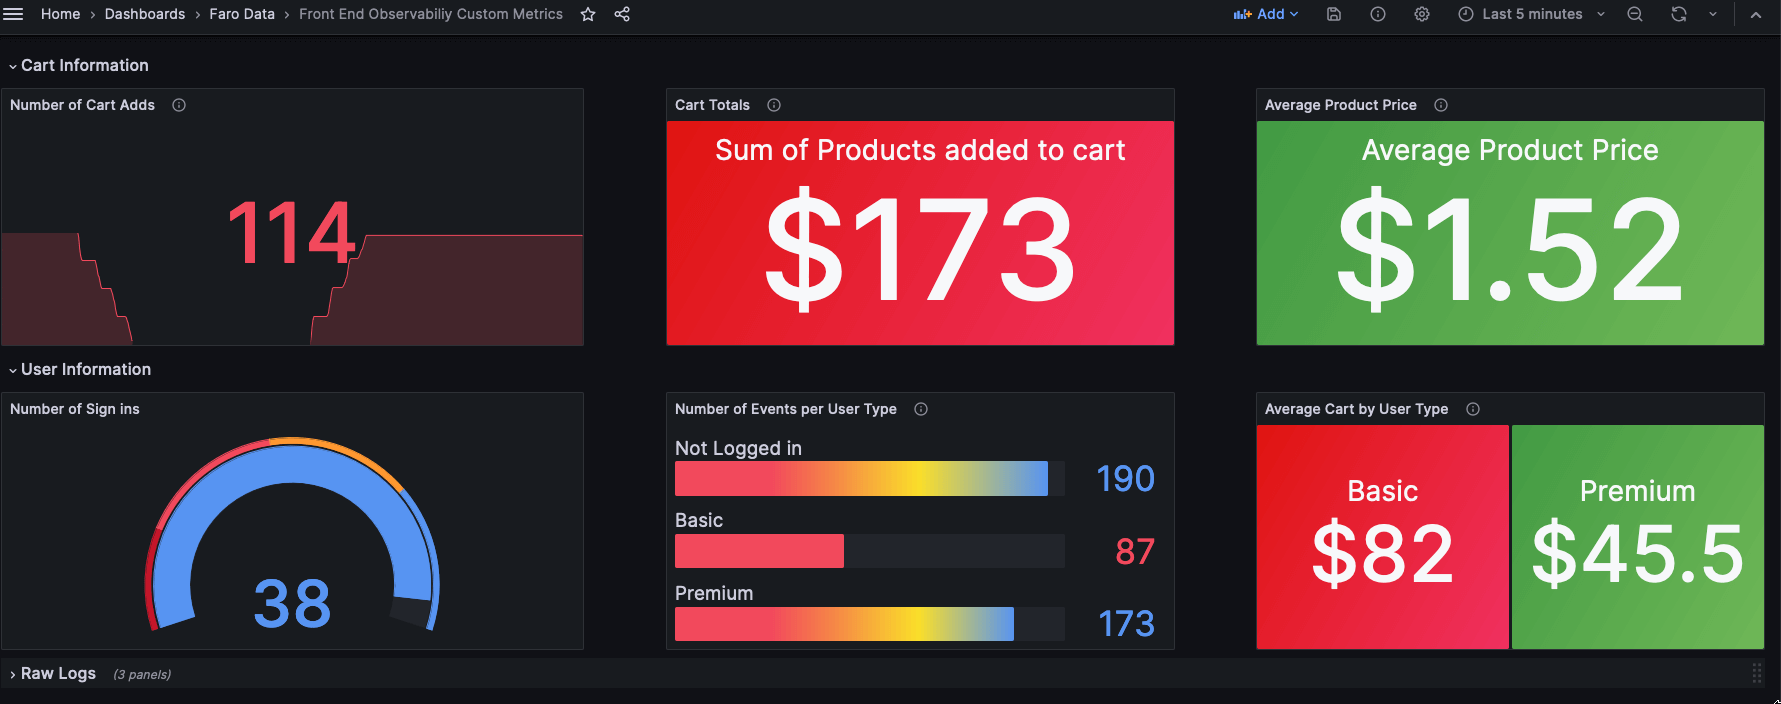
From just the two custom events we sent, we can use LogQL to create all of these metrics by parsing the data directly from the events in Grafana Cloud Logs.
Wrapping up
In the above tutorial, we saw how custom metrics and events in Faro, powered by the Metric queries capabilities of Grafana Cloud Logs, are a powerful way to quickly gain more insight into your applications.
On top of being able to visualize and track business metrics, as we’ve shown here, this can also be useful to identify issues. For example, in our sample app, if a bug broke the “Add to Cart” functionality for only premium users, our metrics would immediately show that because we are tracking this with a custom event. We could even be alerted if the average cart value for premium users dropped to zero and quickly rolled back.
To learn more, you can find Grafana Faro in GitHub or you can read our Grafana Cloud Frontend Observability documentation.
The easiest way to get started with Grafana Cloud Frontend Observability is with our forever-free tier in Grafana Cloud, which includes 10k metrics, 50GB logs, 50GB traces, 50GB profiles, and more. Sign up for a free account today!