
Simplify observability with the Grafana OpenTelemetry Starter and Spring Boot 3
To help simplify instrumenting Spring Boot applications with Grafana Cloud, we are excited to introduce the Grafana OpenTelemetry Starter, a project that connects the latest Micrometer enhancements from Spring Boot 3 with Grafana Cloud using OpenTelemetry. By using these tools, you will have logs, metrics, and traces in a single service — in the same easy way that you can use Prometheus with Spring Boot.
In this blog post, we will dive into the features, benefits, and step-by-step implementation of the Grafana OpenTelemetry Starter. Our goal is to help you get started as quickly as possible with monitoring your Spring Boot application so that you can spend more time exploring and correlating your logs and metrics in Grafana Cloud.
What is Spring Boot?
Spring Boot is a very popular microservice framework that significantly simplifies web application development by providing Java developers building blocks for production-grade applications, which are called Spring starters. The Grafana OpenTelemetry Starter is an example of a Spring starter.
What is OpenTelemetry?
OpenTelemetry is an open source observability framework that helps developers generate and manage telemetry data such as traces, metrics, and logs. It provides a vendor-agnostic way of instrumenting applications to collect and export observability data to various backends, including Grafana. In other words, OpenTelemetry makes it easy to switch to a different vendor without requiring changes to your application (except, in some cases, a property where to send data to).
How to instrument a Spring Boot 3 application with the Grafana OpenTelemetry Starter
The easiest way to try out OpenTelemetry with Grafana is with a free Grafana Cloud account. (If you don’t already use Grafana Cloud, you can sign up for free today!)
Let’s start by adding the Grafana OpenTelemetry Starter to your Spring Boot application:
Look for the most recent version of grafana-opentelemetry-starter and add it to your build.gradle
implementation 'com.grafana:grafana-opentelemetry-starter:1.3.1'
… or pom.xml
  com.grafana
  grafana-opentelemetry-starter
  1.3.1
Next, we add a couple of settings to application.yaml
spring:
  application:
    name: demo-app

grafana:
  otlp:
    cloud:
      zone: 553386
      instance-id: prod-eu-west-0
      api-key: eyJr...Nn0=
Or, if you use application.properties:
spring.application.name=demo-app
grafana.otlp.cloud.zone=553386
grafana.otlp.cloud.instance-id=prod-eu-west-0
grafana.otlp.cloud.api-key=eyJr...Nn0=
Finally, sign into your Grafana Cloud account and replace all example values in the file above.
- Go to grafana.com and sign in.
- Go to the Overview page
- Click on Details button in the Grafana section
- Copy Instance ID and Zone into the corresponding fields in the file
- On the left side, click on Security and then on API Keys
- Click on Create API Key (MetricsPublisher role) and copy the key into the file


Now you can start your application!
Explore your Spring Boot OpenTelemetry data in Grafana Cloud
Logs
Even if you don’t log anything in your application (which is totally fine), you can turn to logging to troubleshoot. For example, you can see exceptions that are thrown by your application. (Tracing can also do that).
While the application is running, log into your Grafana Cloud account. Select your Grafana Loki data source from Explore. In my case, it’s called grafanacloud-gregorzeitlinger-logs.
The default log output is quite hard to read - we’ll use the recommended Spring Boot log expression:
{exporter="OTLP"} | json | line_format "{{if .severity}}{{alignRight 5 .severity}}{{end}} {{alignRight 10 .resources_service_instance_id}}{{if .attributes_thread_name}}/{{alignRight 20 .attributes_thread_name}}{{end}}{{if .instrumentation_scope_name }} - {{alignRight 40 .instrumentation_scope_name}}{{end}}: {{.body}}"
When you click on a log line, you see more details, such as the full-stack trace of an exception.

Stack traces can be quite long, so keep scrolling until you see a small Copy icon on the right side. Use the stack trace to find the exact line of code where the error occurred (e.g. using IntelliJ IDEA “Analyze Stack Trace”).

Metrics
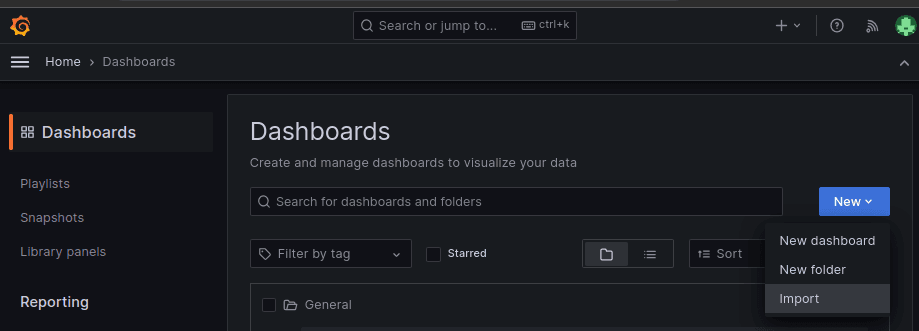
Next, let’s get an overview of the JVM health and the Spring Boot HTTP server using metrics. In Grafana Cloud, go to Dashboards > New > Import. In the following screen, enter 18887 and click Load.
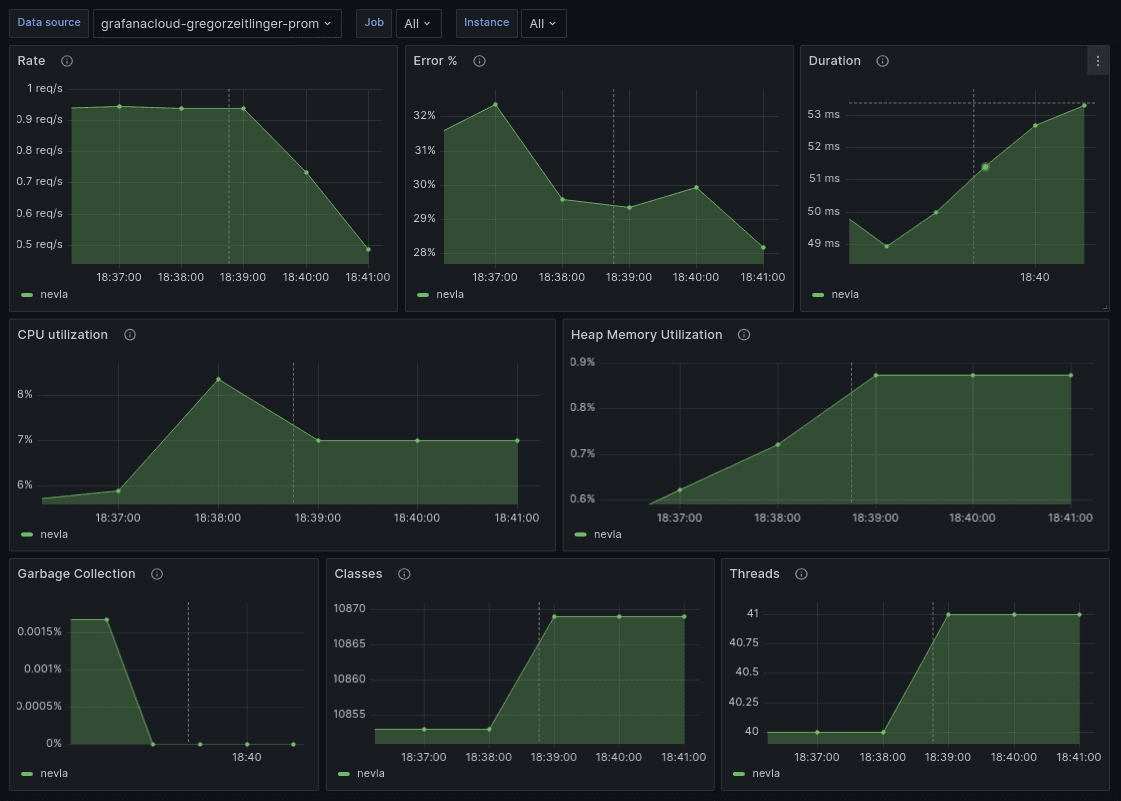
In the final screen, select the Prometheus data source:

The metric data is sent once a minute to Grafana Cloud, so it takes some time for the dashboard to populate. The top panel is an overview of the Spring Boot HTTP server using the popular RED metrics — rate, errors, duration. The second row shows the utilization of your CPU and heap memory. The last row displays the amount of (blocking) time spent in garbage collection as well as the current number of loaded classes and threads.
Learn more about OpenTelemetry, Spring Boot, and Grafana Cloud
This blog post just covered everything to get you started for a typical Spring Boot 3 application.
As a next step, you can read about …
- *Application Observability**, a complete observability solution powered by OpenTelemetry for instrumenting and monitoring applications and services. Read more in the Application Observability documentation.
- Advanced deployment options, which are recommended for production use cases. Read more on Grafana Agent configuration for OpenTelemetry
If anything is not working or you have questions about the Grafana OpenTelemetry Starter, you can find our team in the Grafana Labs Community Slack in the #opentelemetry channel.
If you’re not already using Grafana Cloud — the easiest way to get started with observability — sign up now for a free 14-day trial of Grafana Cloud Pro, with unlimited metrics, logs, traces, and users, long-term retention, and access to all Enterprise plugins.

