
Grafana JSON API: How to import third-party data sources in Grafana Cloud
Have you ever wanted to test out Grafana Cloud but don’t have any available data to monitor? Well, have no fear! With the Grafana JSON API plugin, you can query publicly available JSON endpoints.
The JSON API is a wonderful way to start using Grafana Cloud. You can quickly see data in action, and there are a multitude of things you can build, analyze, and monitor using the JSON API. It’s great for exploratory data analysis because you can visualize the data and create visualizations in a no-code environment. Plus, if you have a /health endpoint, you can quickly hit that endpoint and get instant feedback on whether your services are healthy or down. The possibilities are endless with the Grafana JSON API.
We’ve actually seen a lot of interest lately in using the JSON API plugin, as it lets you visualize data from any URL that returns JSON, such as REST APIs or static file servers. With that flexibility, you can pull from any number of repositories, so let’s have a little fun and pull in some data from a galaxy far, far away. In this tutorial, we’ll show you how to query a publicly available Star Wars API and make a dashboard with the data we get.
5 steps to start using the Grafana JSON API
You can build a dashboard with the Grafana JSON API plugin in a matter of minutes. Just follow these steps so you can start exploring the data and familiarizing yourself with the Grafana UI.
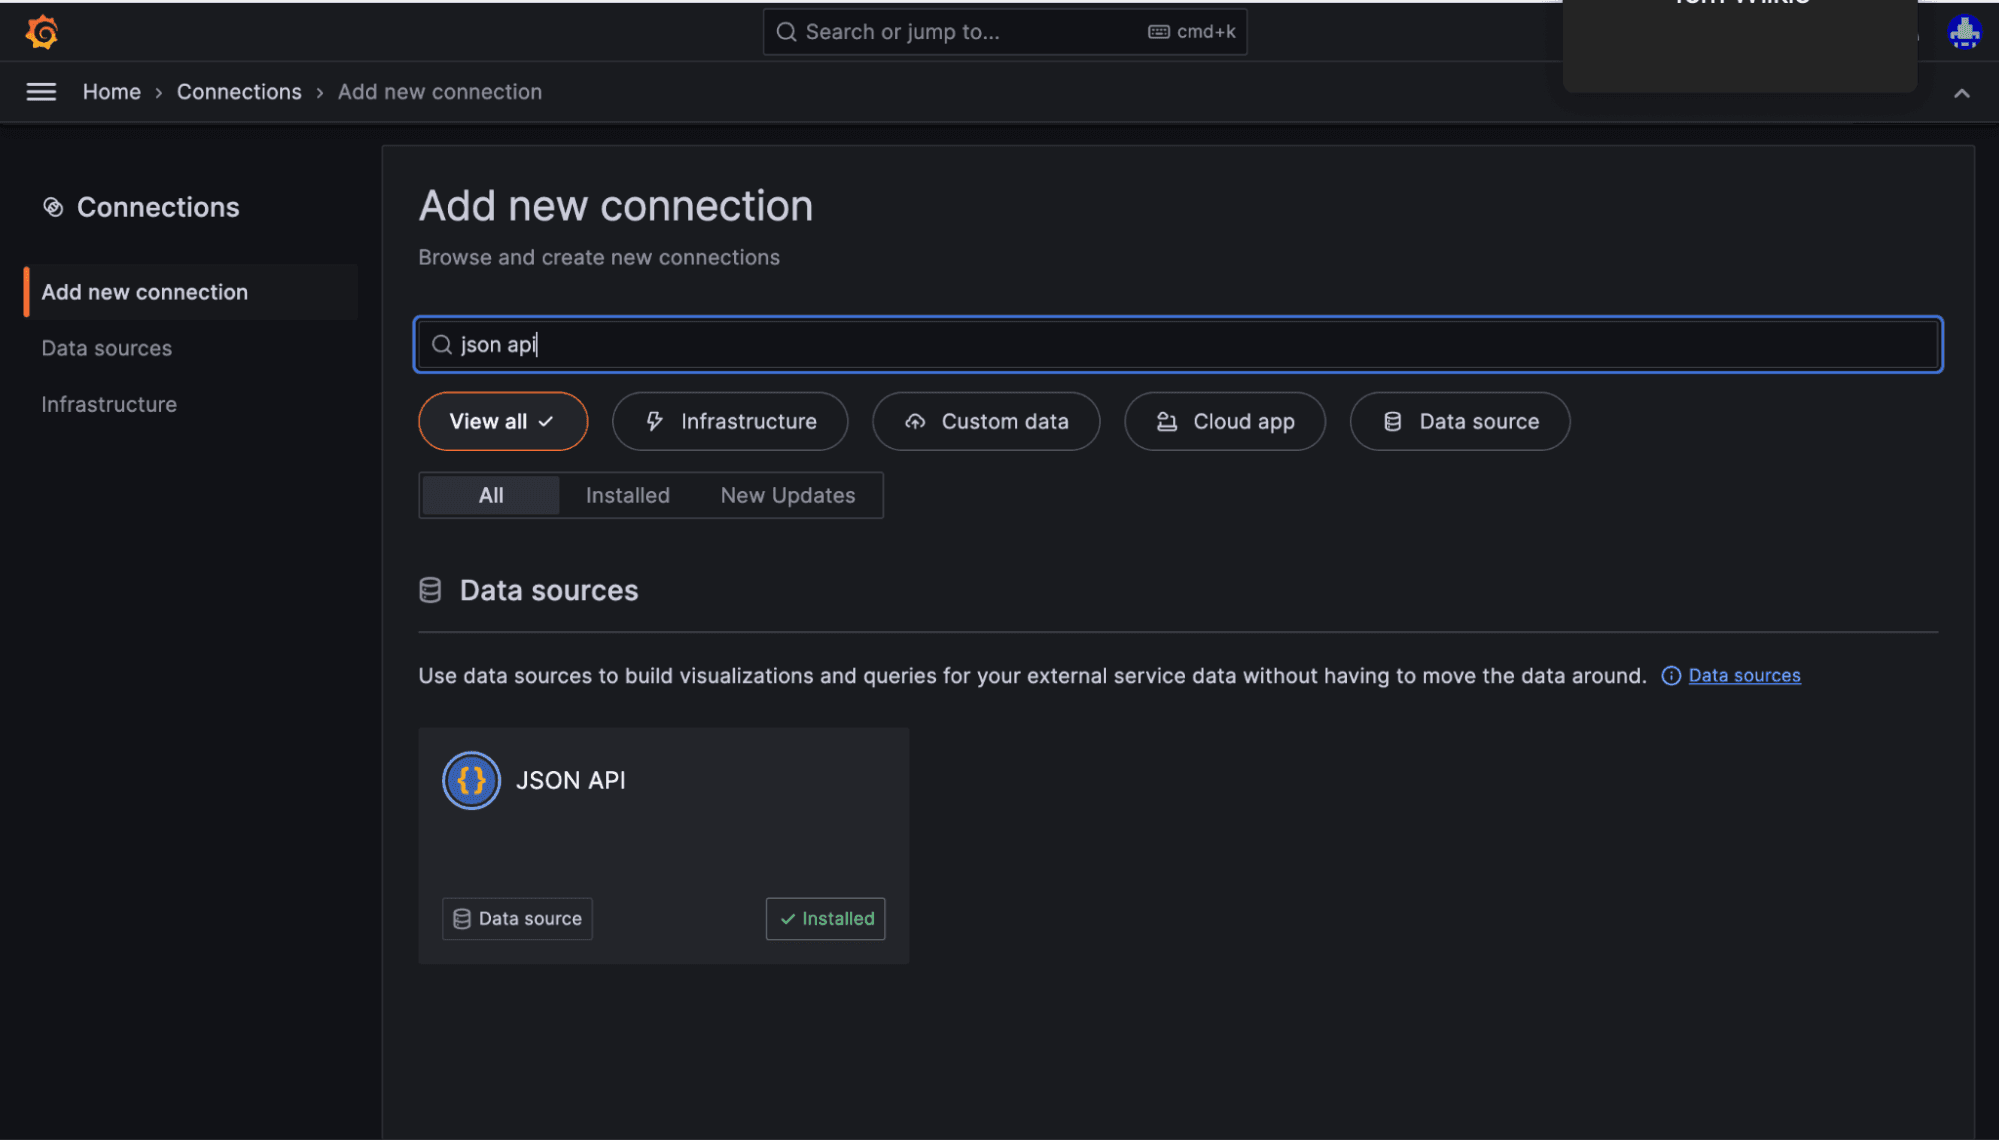
1. Find the JSON API card
Log into your Grafana Cloud account and navigate to the Connections panel. Search for JSON API and click the corresponding card. (If you haven’t used Grafana Cloud before, you can sign up for a forever-free account today!)
2. Create your data source
When you arrive at the JSON API data source, you will see an install button that takes you to the plugins home screen. From there, click get plugin, select your stack, and install the plugin. Once you’ve installed the JSON API data source, click Create a JSON API data source.

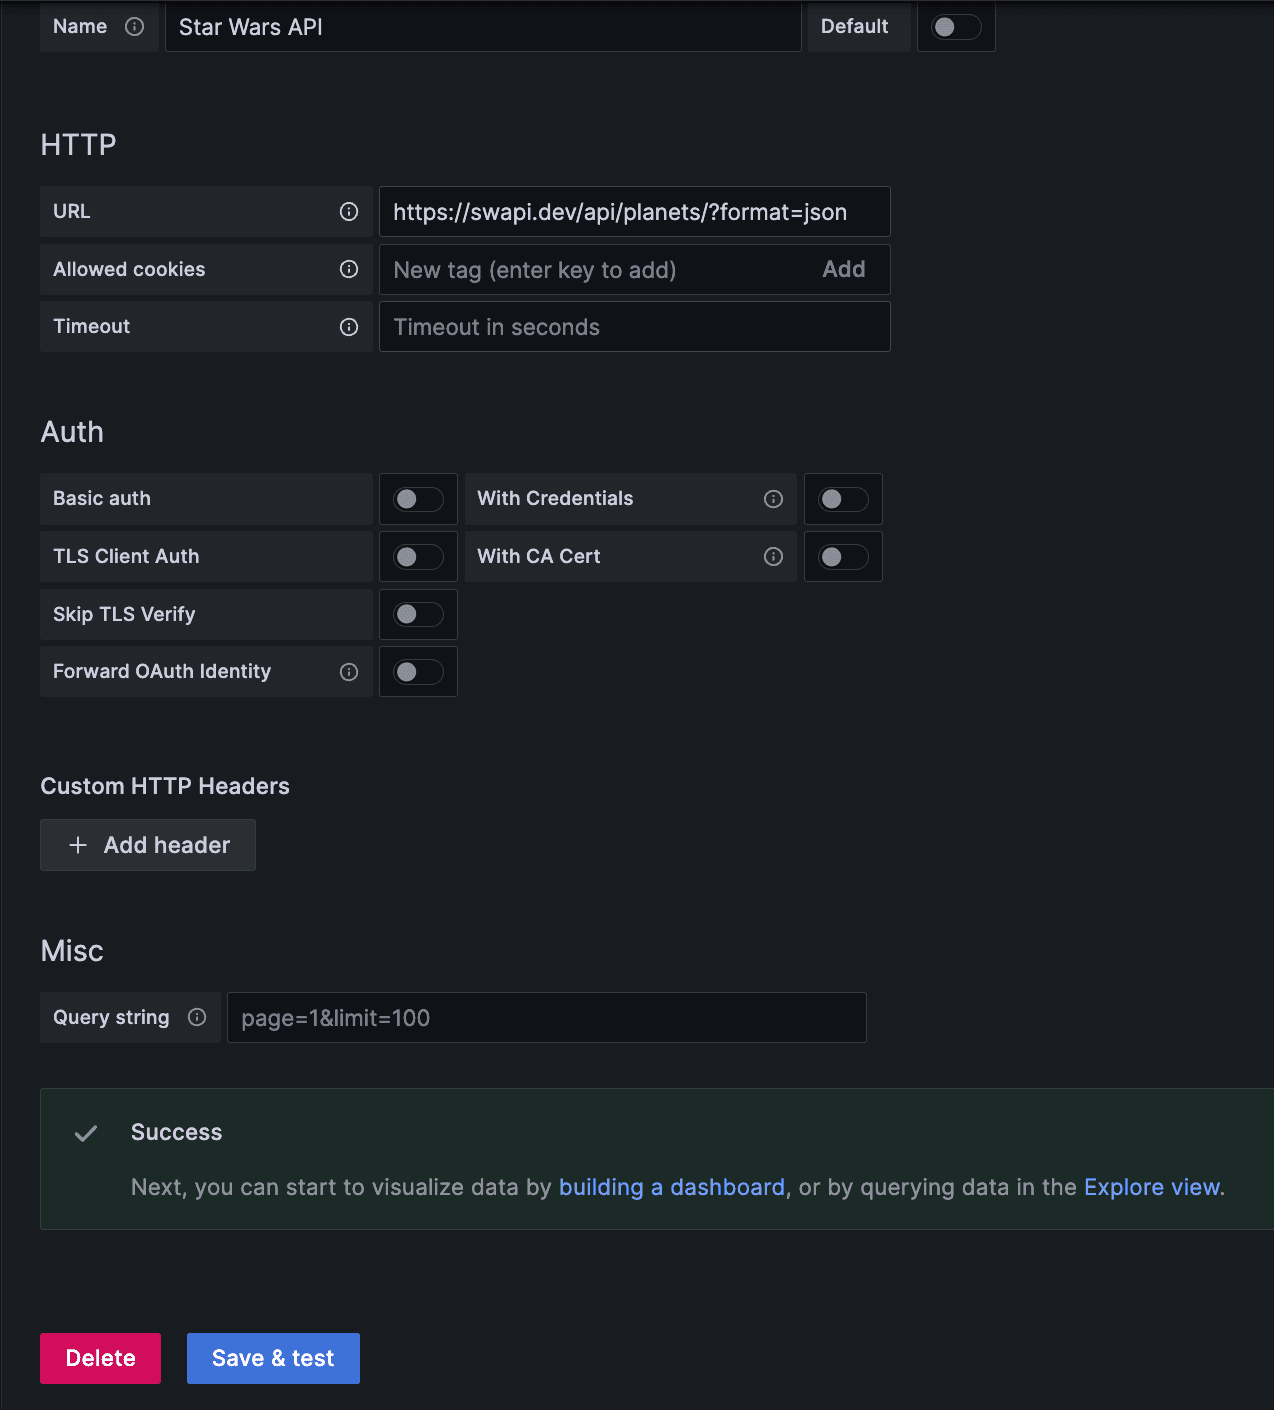
3. Build your dashboard
In the configuration page, enter a URL you would like to query. You can use any public URL that requires no authentication. For this example, we’ll be using the Star Wars API. Click Save & test. From there, you’ll see a success message with a link you can follow to visualize this data source in a dashboard. Click Building a dashboard to continue.
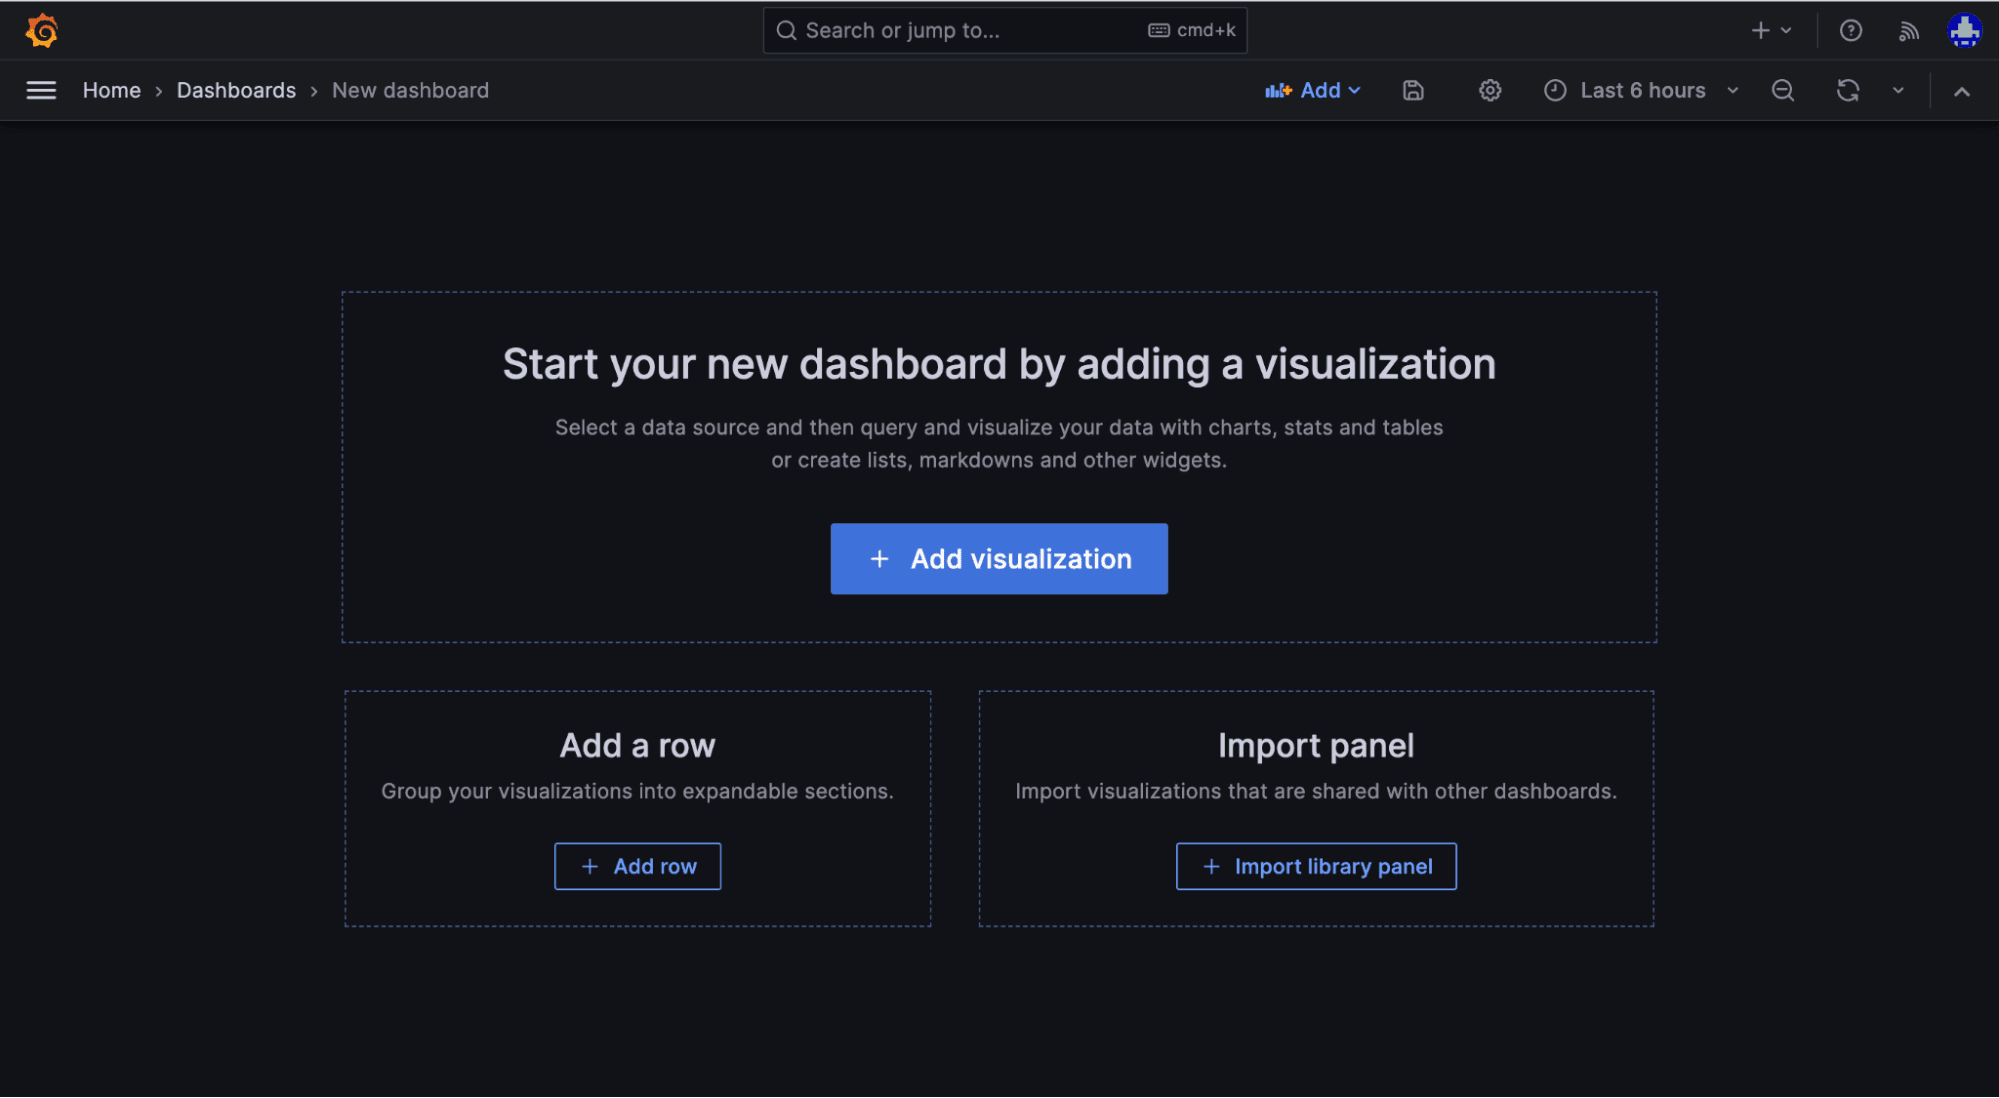
4. Add visualization
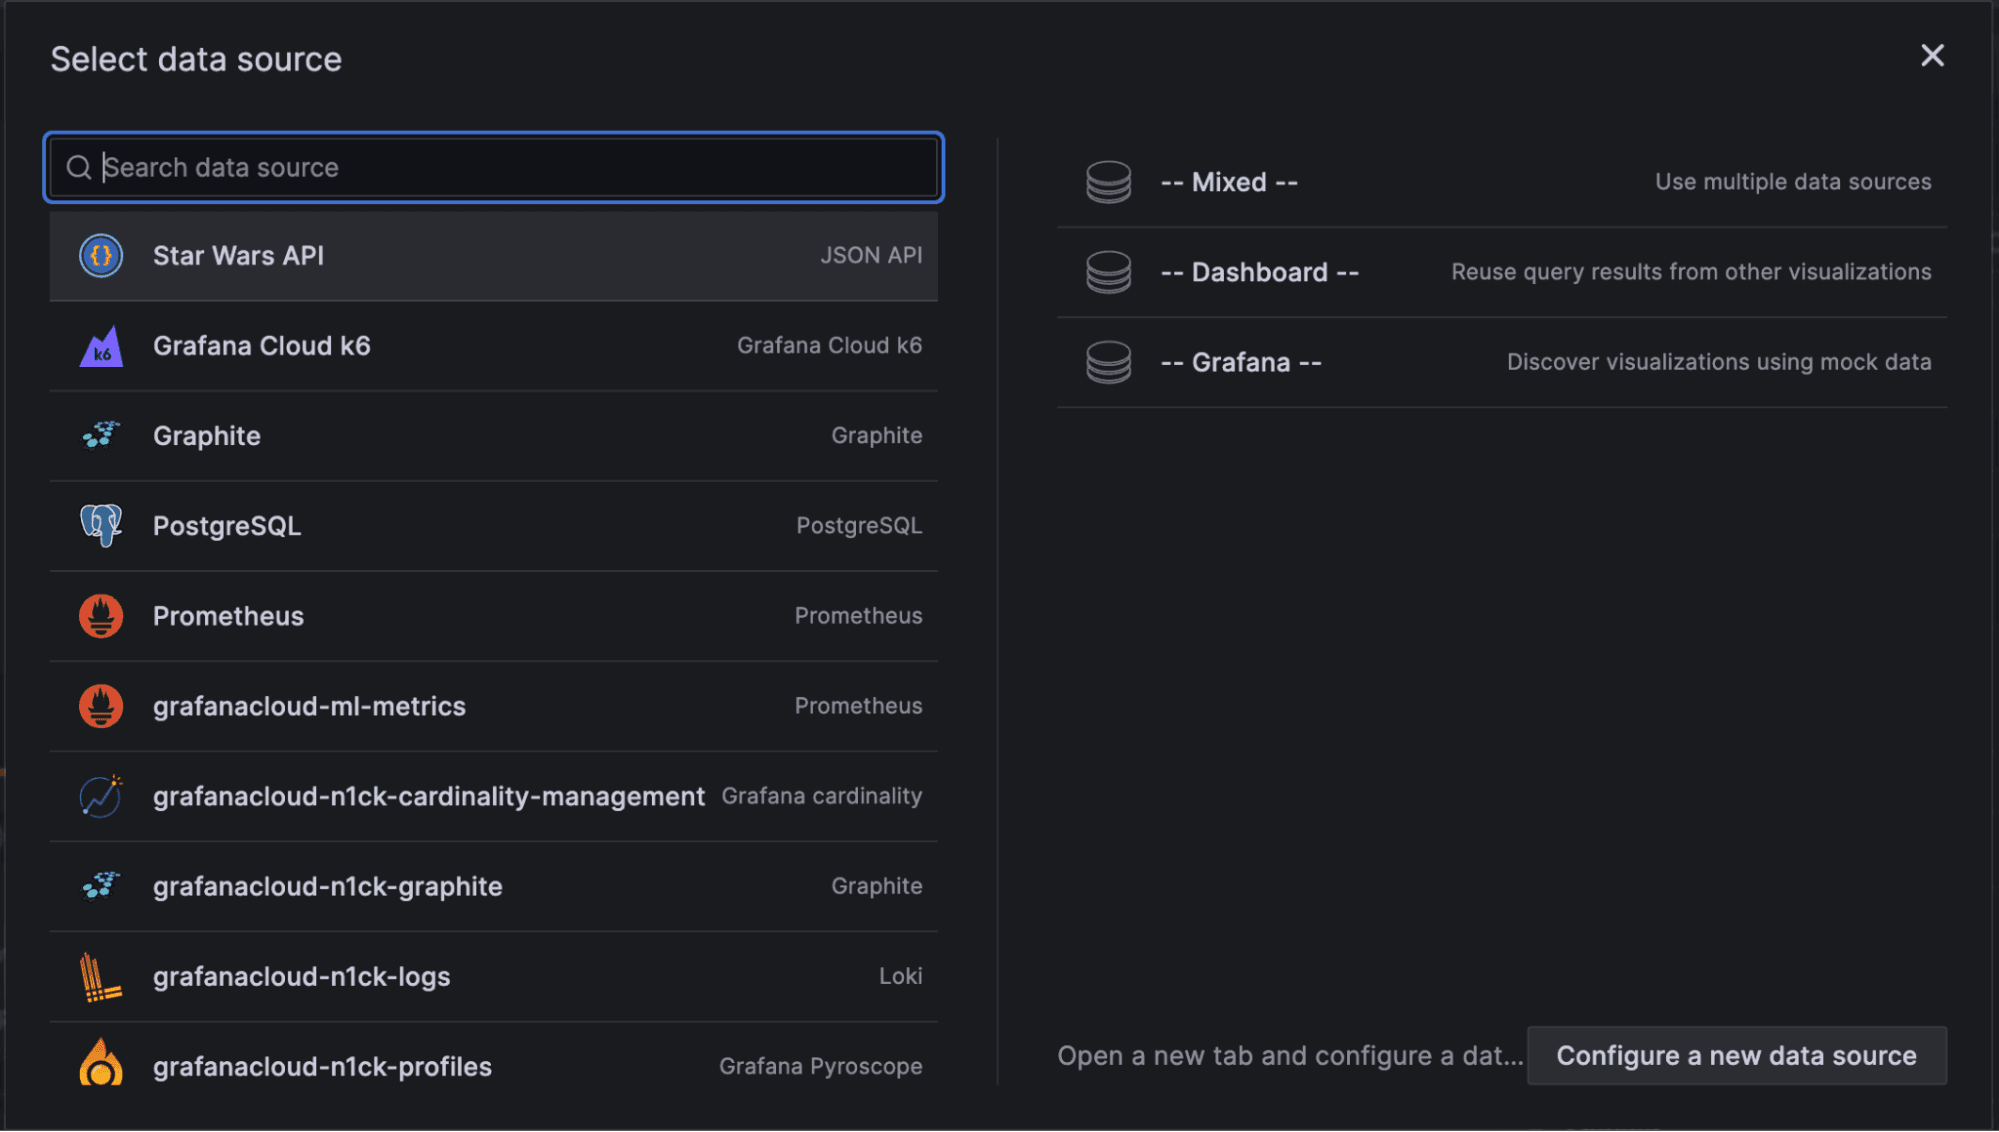
In the dashboard creation page, select Add visualization and select your “Star Wars” data source.
The Star Wars API presents us with a JSON data source of all of the planets in the Star Wars Universe, including data on temperature, planet name, spin rotation, and more. We’ve chosen it for this example because it meets our requirements as a public API requirements. It also has lots of quantitative data to show some form of number-related data — and, well, who doesn’t want to know which fictitious Star Wars planet has the longest rotational period? (Spoiler alert: It’s Kamino.)
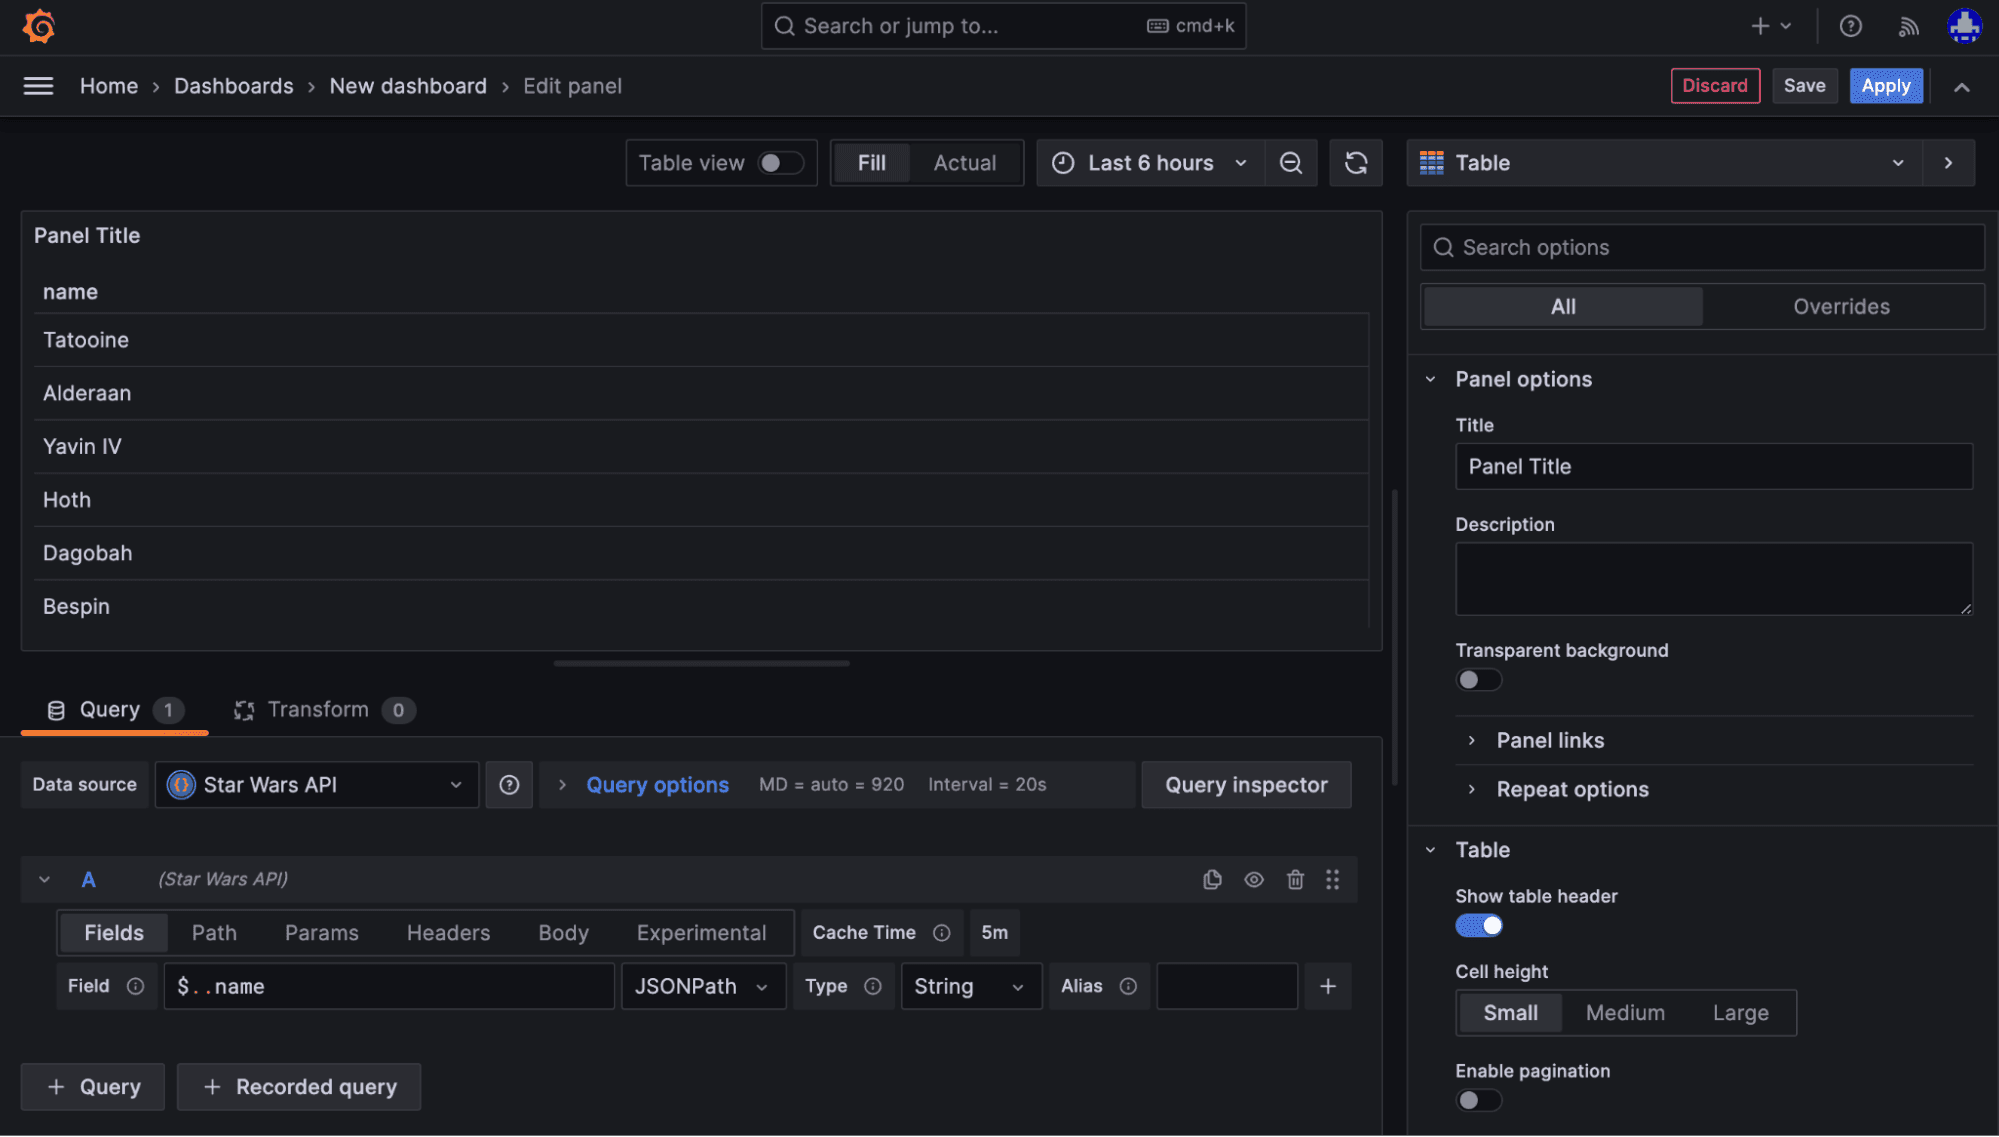
Once you’ve selected the API, you will be directed to the query editor with a default visualization set to Table. We can tabulate our data in the next step.
5. Add your query
Once the data source has been selected, we can add a query. Query the API’s name using the JSONPath query language. If we use $..name , this query will return the names of the Star Wars planets in a table visualization. To break down the query, the “…” (dot dot) syntax lets us go into two levels of nesting in the JSON.
Tip: If you are seeing errors in your query, make sure you are using the right case. Queries are case sensitive and there should be no spaces in the beginning or end of your query.
From there, if we want to get more advanced, we can add an additional query to work with quantitative data and use a wider range of visualizations that let you use field types, like Number. For example, let’s look at the rotation_period. This is a great way to easily see the value of visualizing your data in Grafana.
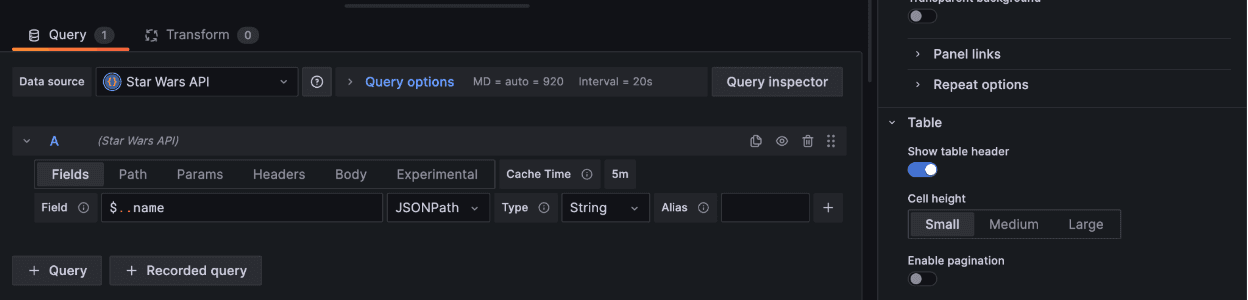
To view the rotation period, we can click the + icon to the right of the Alias field and type in $..rotation_period. At the top right of your screen, you will be able to see the table visualization. If you click the drop down and select bar chart, you can see the rotation period as a chart and the name of the planet in the labels in the chart.

Select Save at the top right of the screen to save your visualization. You’re now ready to view your dashboard!

Once saved, you’ll be redirected to the dashboard screen.
Next steps
Congratulations, you now have your first dashboard using JSON API! If you wanted to continue this experiment with the given data sets information, your next challenge would be to add $..population with a type of Number as a visualization panel of your choice and to add the planets’ climate $..climate as type String with a visualization of your choice to see if climate has a direct correlation with population size!
If you’re not already using Grafana Cloud, we have a generous forever-free tier that includes 50GB of profiles, along with 10k metrics, 50GB logs, and 50GB traces for 3 active monthly users. Sign up for free today!

