Grafana Pyroscope 1.0 release: continuous profiling for a modern open source observability stack
When we launched Pyroscope in 2021, we had one clear goal: Give developers a powerful open source continuous profiling tool for collecting, storing, and analyzing profiling data. Grafana Labs had a similar goal when they released Grafana Phlare, a horizontally scalable, highly available open source profiling solution inspired by databases like Grafana Loki, Grafana Mimir, and Grafana Tempo.
We realized how the strengths of these two open source projects complemented each other, and in March, Pyroscope became part of Grafana Labs. Since then, we have been working hard on bringing together the best of both continuous profiling projects into one tool, now called Grafana Pyroscope, that gives developers a deeper view into the resource usage of their code.
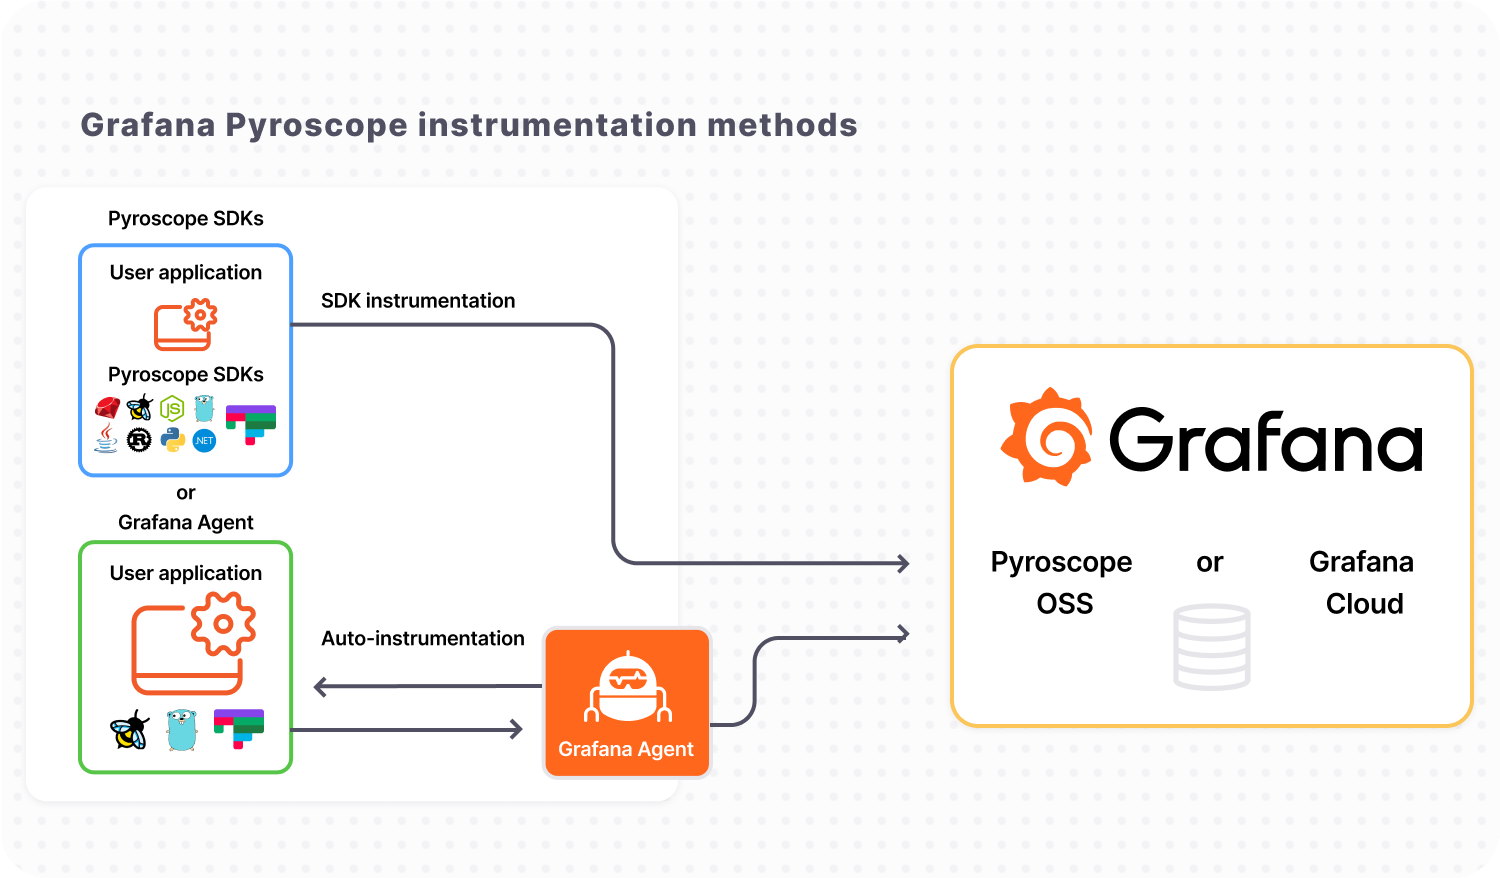
Today we’re proud to share the first release of the combined project: Grafana Pyroscope 1.0 is the most efficient and scalable open source profiling database, offering both low overhead, client-side instrumentation and reliable server-side capabilities.

Continuous profiling with Grafana Pyroscope 1.0: Proven scale with low overhead
Grafana Pyroscope 1.0 is built to ingest, store, and query workloads from any project of any size. We’ve tested it thoroughly and seen ingest rates at petabyte scale, profiling more than 50,000 application instances from around the world and more than 6,000 unique profiles per second.
We’ve also done more analysis to make sure the client-side tools work efficiently without causing any noticeable overhead in your applications.

How to upgrade to Grafana Pyroscope 1.0
The upgrade path to Grafana Pyroscope 1.0 only requires a few steps whether you are migrating from Phlare or upgrading from an older version of Pyroscope. For many, upgrading is as simple as:
- Migrate your configuration from the old format to the new format. (The old config is usually located at
/etc/pyroscope/server.ymland the new config is at/etc/pyroscope/config.yaml.) There’s a detailed description of all configuration parameters here. - Upgrade Docker image from pyroscope/pyroscope to grafana/pyroscope. Link to the new Docker image is here.
- Delete old data (typically found at
/var/lib/pyroscope).
That being said, since everyone’s setup is a bit different, we suggest checking our upgrade guide, whether you’re moving from Phlare or older Pyroscope versions.
The road(map) ahead for Grafana Pyroscope
We see this Grafana Pyroscope 1.0 release as a milestone, because it establishes a solid foundation for the project that’s built for scalability and interoperability with other telemetry signals. What we’ve learned over the past several years is that continuous profiling provides the most value when easily correlated with logs, metrics, traces, and other observability data.
To that end, for users of our fully managed observability stack in Grafana Cloud, we’ve also added Grafana Cloud Profiles, the hosted continuous profiling solution powered by Pyroscope. Grafana Cloud Profiles is available for users to add on across all tiers, including our generous forever-free plan which includes 50GB of profiles.
Now that we’ve released Pyroscope 1.0, we’re circling back to address some of the requests from the community that we had put on hold during this merge to help better accomplish this goal. (Thanks for your patience!) Here are some of the most common requests and items that will be coming soon:
Improved profiling workflows
We aim to build on the new Pyroscope foundation to add features that will insert profiling natively into your common workflows. This means adding features like flame graph diffs in GitHub PRs, canary deploys, profile-guided optimization (PGO), integrating profiling with load testing tools like Grafana k6, and integrating with visual editors like VS Code.
OpenTelemetry native profiling
It’s not just Pyroscope recognizing this increased desire for continuous profiling data. OpenTelemetry has also been working towards OTel-native profiling since the initial profiling proposal issue in 2020. We’ve been actively collaborating with and contributing to the OpenTelemetry profiling SIG and plan to ensure that profiling aligns seamlessly with OpenTelemetry’s patterns for logs, metrics, and traces. Our goal is not just to support ingesting this new format in the Pyroscope server, but also to contribute the advancements we’ve made in client-side instrumentation.
Profiling x tracing integration
We’ve already created an interesting POC where we link profiling and OTel trace spans, and this has been one of our most highly requested features. We plan to make this a key feature in Pyroscope 1.0+.
More granular client management
There’s a lot we can do to improve both how you add and manage profiling inside of your applications. We’re working on improving our client SDKs to add more real-time agent management features, such as sampling controls, ad hoc profiling capabilities (ability to turn profilers on and off), alternative instrumentation options (more pull mode support), and more.
Enabling efficient profiling with eBPF
We’ve drastically improved our eBPF integration and after extensive testing internally and feedback from the community we are excited about the possibilities for how eBPF can change how we profile. Our eBPF integration is incredibly strong for some languages (i.e., Golang), and we’re working to make it more robust for others (i.e., Python, Java, and .NET).
Training and learning modules on continuous profiling
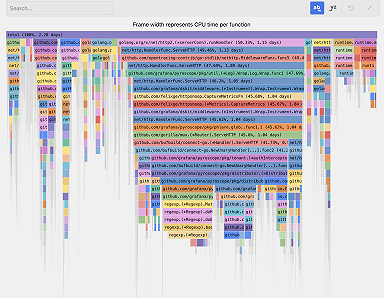
We understand that, for some users, flame graphs and continuous profiling data can be intimidating to get started with. Not only do we have plans for more external guides and case studies, but we will also add more in-product explanations and walk-throughs to the UI to improve usability.
Add continuous profiling for a modern observability stack
Grafana Pyroscope is designed to fit right into your existing workstreams and add critical and actionable context to your logs, metrics, traces, load tests, and more. With Pyroscope, you don’t just collect and see performance data; you get a deep understanding of how to use it to optimize infrastructure spend, simplify debugging, and enhance application performance.
Join us as we continue to evolve and improve continuous profiling with Grafana Pyroscope 1.0! We’d love to hear your thoughts and feedback. You can reach out to the Pyroscope team on GitHub or the #pyroscope on the Grafana Labs Community Slack.
Grafana Cloud is the easiest way to get started with continuous profiling, metrics, logs, traces, and dashboards. We have a generous forever-free tier that includes 50GB of profiles, along with 10k metrics, 50GB logs, and 50GB traces for 3 active monthly users. Sign up for free today!


