
A complete guide to metrics cost management in Grafana Cloud
The macro economy can put a lot of pressure on organizations to reduce costs, typically with the central SRE and platform engineering teams coming under scrutiny. One common workaround we’ve seen countless teams make is compromising their observability by ingesting fewer metrics in the name of cost savings. But for centralized SRE/observability teams, the response to macro conditions should not be monitor less, but rather monitor smarter.
In this blog post, we will review some of the common ways organizations have tackled metrics management in the past. We will also share how Grafana Cloud is shaping the future of metrics management with a breakdown of the framework and features that help organizations scale while maintaining control over their costs.
Five common ways SRE teams manage metric costs
1. Go back to developers
Go back to app teams and ask them to stop sending metrics that are not valuable to reduce the cost of observability.
- Pro: Nip the problem in the bud. If you don’t generate all these metrics in the first place, cost will not be an issue. Each service team knows their metrics best and are empowered to make the decision on what to drop or not even generate.
- Trade-offs: Requires coordination and buy-in from multiple stakeholders. As the teams take time to implement changes, you are still burning budget. Plus the lack of insights into what constitutes a “valuable” metric to intelligently reduce could result in potentially dropping a critical metric.
2. Create data silos
Spin up Prometheus across the organization to capture overflow metrics when it becomes too expensive to scale metrics within the main metrics provider.
- Pro: Easy, fast, and a budget-friendly option.
- Trade-off: It’s a temporary fix. Scaling Prometheus over time has its own challenges. And with data distributed across different systems, it’s extremely difficult to correlate different signals during an incident.
3. Create new manual processes
Analyze metrics usage by manually sifting through rules, alerts, and dashboards line by line to find labels to drop or reduce.
- Pro: Intelligent approach guided by data and heuristics. No compromise to observability because you only drop metrics or labels that aren’t being used.
- Trade-off: Burns valuable resources. The process is also painstakingly time-consuming and cumbersome.
4. Build an in-house solution
Take matters into your own hands and build a custom solution to meet your needs.
- Pro: Purpose-built solution, built by those impacted by the problem, is most likely going to meet all your needs.
- Trade-off: Takes resources (manpower and time) away from critical projects to focus on building a bespoke solution. Instead of scaling observability and building best practices to onboard teams, SREs spend their valuable time and skills trying to build and maintain the solution.
5. Do nothing
Keep pushing the problem away.
- Pro: Status-quo. Put off the problem, hoping it will either go away or someone else will have a solution for it and focus on patching less critical issues.
- Trade-off: The cost of doing nothing can turn out to be expensive in the future. You are likely to incur tech debt and undoing that at a later stage can be more expensive. You are unable to onboard newer teams or apps onto the observability platform, which can impact time-to-market and revenue. Your observability system might not be able to scale and will fall over with the overwhelming volume of metrics.
The common theme for most of these customers is the struggle to optimize their metrics within their chosen observability platform.
Grafana Cloud provides an innovative and reliable solution with predictable costs and a centralized suite of tools that allow you to optimize, attribute, and continuously monitor telemetry growth within one platform.
“We carefully watch our metric and cost consumption, and in the past, we manually evaluated every metric to identify what to drop, which was an extremely time-consuming and tedious process. Grafana Cloud Adaptive Metrics simplified this process for us by generating recommendations curated for our environment, reducing the amount of time spent by half. I wish I had this feature sooner.”
- DevOps engineer at Sailpoint
Below are the four key areas that Grafana Cloud focuses on to help you implement a cost-effective observability strategy. The goal? Toscale your metrics with predictable costs as well as identify and filter out low-value metrics.
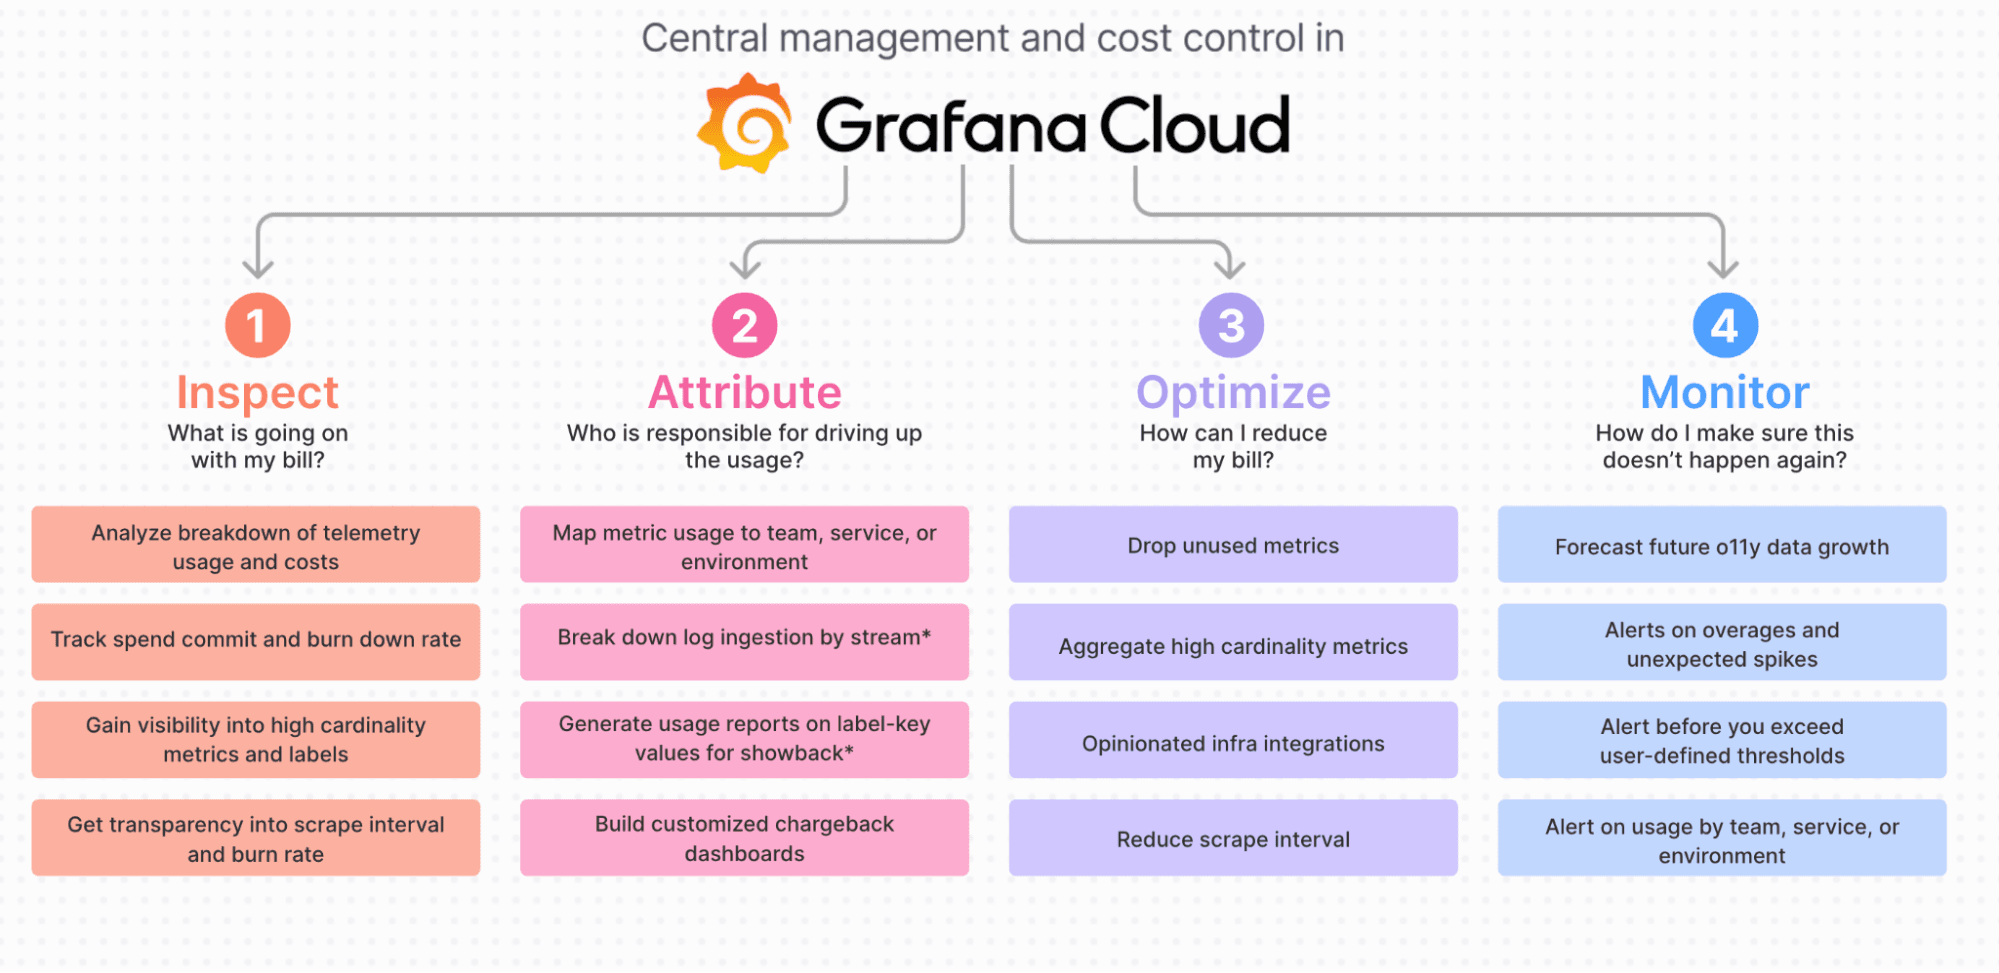
Inspect: What is causing my bill to increase?
Questions you should be able to answer:
This stage is about understanding the fundamental drivers of your observability costs. For example, how are you tracking towards your spend commit? How fast is the rate of burn? How does your observability bill compare to your infrastructure bill? We’ve found customers use their observability spend as a function of total IT spend (< 10%) as a north star metric.
If you find these questions difficult to answer ( i.e., you don’t have an out-of-the-box billing dashboard that breaks down your usage or any discernible way to figure out what actually causes your monthly bill to increase), then it’s time to re-evaluate your observability stack.
How Grafana Labs can help
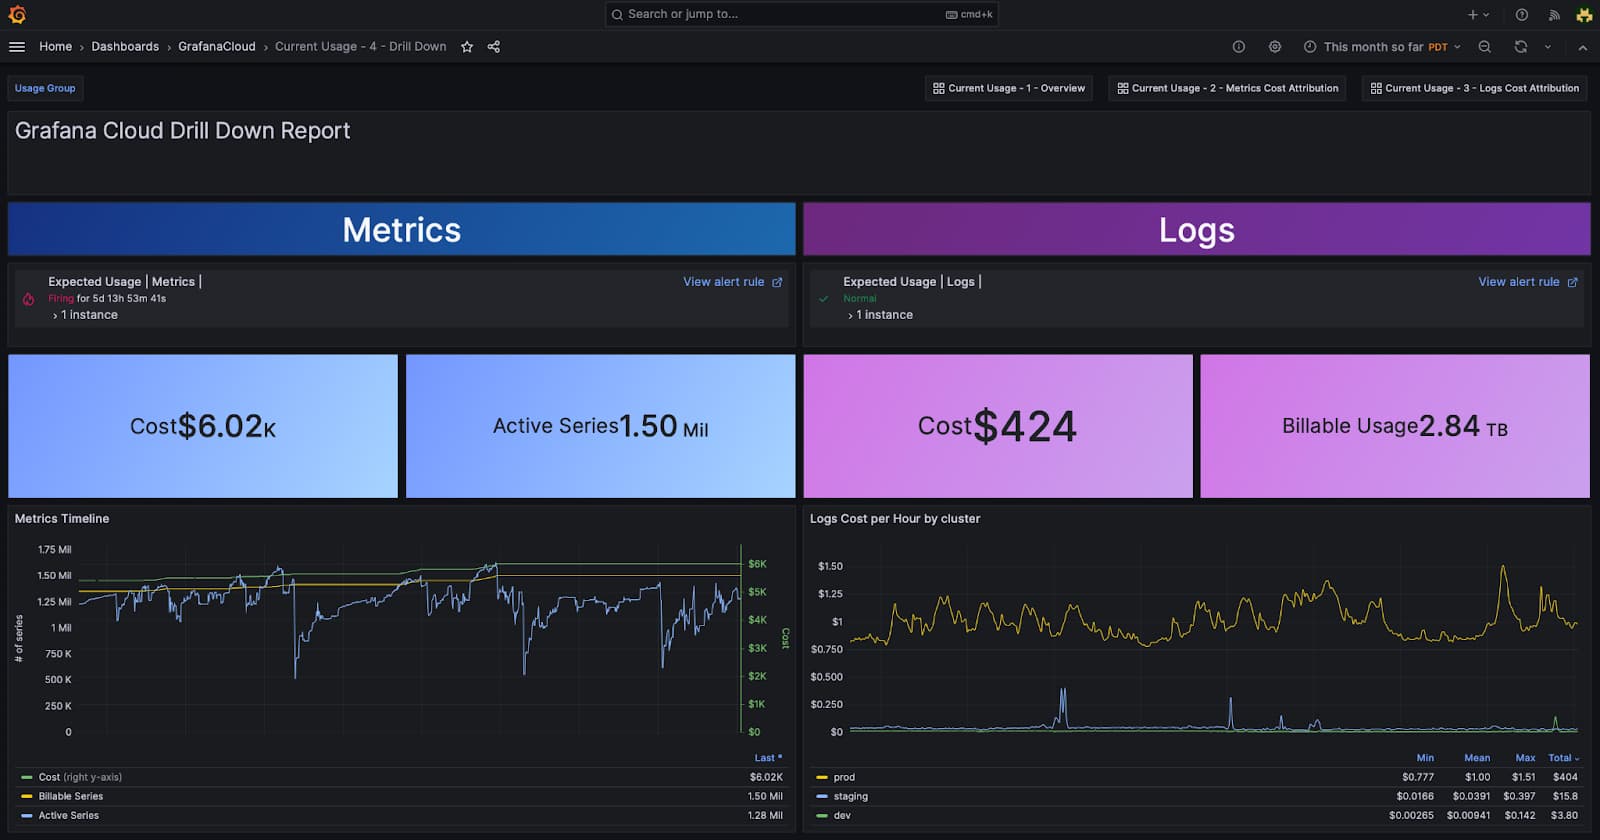
Grafana Cloud offers tools like the billing/usage dashboard to gain a detailed breakdown of monthly usage with a straightforward pricing framework — active series and data points per minute (DPM). With these out-of-the-box dashboards, customers not only get transparency on usage. They also get tools to systematically deal with metrics explosion as they scale. Apart from OOTB dashboards, we have seen our customers leverage the power of Grafana visualizations to create custom dashboards that give them a visual summary of how your costs are trending.

All tiers in Grafana Cloud (Free, Pro, and Advanced) also include a set of cardinality management dashboards to help identify high cardinality metrics as well as labels for the metrics driving up your bill. These dashboards give you insight into which of these high cardinality metrics are used vs. unused, so you have actionable insights if you want to reduce your bill by removing these unused metrics.

Attribute: Who is driving up the bill?
Questions you should be able to answer:
If you have the data that shows how your billing and usage is trending, as a centralized observability team, you might want to know who is responsible for driving up the usage, specifically which teams and environments are contributing the most to cardinality. Often, someone may have (accidentally or inadvertently) introduced a new label that has so many values that the number of overall series starts to increase rapidly. (Learn more about cardinality spikes on our blog.)
How Grafana Labs can help
Grafana Cloud Advanced includes usage groups to help identify the sources of metric volume in your environment. You can track the number of time series that have a certain label or set of labels applied over time so you can understand how different teams, environments, or applications are contributing to your overall series count. By providing this data as a time series, you can easily pinpoint on a Grafana dashboard how a change at a specific point in time led to an increase in your observability bill.
Additionally, for centralized observability teams, usage groups can be used to associate telemetry consumption to teams or environments and further create showbacks or chargebacks.


Optimize: How can I reduce my observability bill immediately?
Questions you should be able to answer:
This stage is focused around the levers to optimize your telemetry as you scale. Sudden cardinality spikes sent to your observability stack cause system stress (increase out-of-memory errors or crashes) as well as an increase in your bill.
How Grafana Labs can help
Adaptive Metrics is a cost management feature in Grafana Cloud that helps centralized observability teams identify and eliminate unused metrics to maximize the efficiency and ROI on observability spend. Metrics are transformed into lower cardinality versions of themselves at ingestion by aggregating away low-value labels, reducing a customer’s total count of time series persisted and therefore their bill.
Adaptive Metrics analyzes every metric coming into Grafana Cloud and compares it to how users access and interact with the metric. It analyzes the alerting rules, recording rules, dashboards, and 30 days of your query logs in Grafana Cloud to determine if a metric is unused, partially used, or an integral part of your observability ecosystem.
- Unused metrics: There has been no reference made to the metric based on any of those three signals.
- Partially used metrics: The metric is being accessed, but it has been segmented with labels to create many time series, and people are only using a small subset of them.
- Used metrics: All the labels on that metric are being used to slice and dice the data.
To determine how to best aggregate a metric, Adaptive Metrics looks at more than just your usage patterns. It also analyzes factors such as metric type (is it a counter or a gauge?), number of label values associated, and churn (how long is a time series alive?) so that it can provide efficient aggregation recommendations. Those recommendations are constantly recomputed, allowing them to reflect changes in your usage, thereby “adapting” to the environment.
We have seen our customers choose to aggregate unused metrics or completely drop them — all without breaking existing dashboards or queries. In fact, our initial tests in more than 150 customer environments show that on average, Adaptive Metrics users can reduce time series volume by 20%-50%.

Another way to reduce your bill is double-check your scrape intervals to see if there are opportunities to reduce the data frequency. The default scrape_interval for Prometheus is 15 sec, or 4 DPM, in Grafana Cloud. But if this frequency is not required, the default configuration can result in more data being stored than was forecasted.
To inspect your current scrape_interval, use the query below to find the number of samples scraped over the last minute, split by target:
count_over_time(scrape_samples_scraped[1m])

You can then inspect these metrics and increase the scrape_interval for less critical metrics to reduce costs. Often, less critical metrics can be set to a scrape_interval of 60 sec, which can reduce costs by up to 50%.
To learn more about adjusting scrape_intervals, take a look at our documentation.
Monitor: How do I make sure costs don’t rise again?
Questions you should be able to answer:
The always-on stage of cost management is to have the ability to continuously monitor the environment for any deviation from the norm and be proactively signaled when anomalies occur so you can ensure you don’t get surprised by overages or sudden spikes in usage.
How Grafana Labs can help
Grafana Cloud billing dashboards give users access to predictions around the future state of their systems with metric usage. You can also use Grafana Alerting to set up an alert for active series usage, you can also create an alert on usage groups, so you can get an alert when a team, environment, or application exceeds usage as well. Within alert rules, you can also set custom budgeting thresholds so you are alerted only when that criteria is met. This would be good for calling attention to unexpected spikes in usage.
To learn more about how to set up alerts, check out our billing and usage documentation.

Learn more about metrics management in Grafana Cloud
For more information on metrics management in Grafana Cloud, check out our Adaptive Metrics webpage and our documentation.
If you want to provide feedback on any of our metrics management tools, or if you have a feature request for Adaptive Metrics, please let us know! Leave a question or comment in the Grafana Cloud section of the Grafana community forums.
If you’re not already using Grafana Cloud — the easiest way to get started with observability — sign up now for a free 14-day trial of Grafana Cloud Pro, which includes unlimited metrics, logs, traces, and users, long-term retention, and access to all Enterprise plugins.

