
How we scaled Grafana Cloud Logs’ memcached cluster to 50TB and improved reliability
Grafana Loki is an open source logs database built on object storage services in the cloud. These services are an essential component in enabling Loki to scale to tremendous levels. However, like all SaaS products, object storage services have their limits — and we started to crash into those limits in Grafana Cloud Logs, our SaaS offering of Grafana Loki.
In this detailed blog post, we’ll dive into some recent performance and reliability challenges we encountered when we exceeded the amount of traffic our cloud vendors’ object storage services could handle. We’ll cover detection, troubleshooting, analysis and, finally, how we designed and rolled out a solution that grew our caches from 1.2TB to 50TB in size.
A brief primer on Grafana Loki
Grafana Loki is a time series database designed for storing and searching huge volumes of logs. Log lines are ingested into Loki with a timestamp, the log content, and, importantly, labels.
Labels can identify which application a log belongs to, which location a log came from, or any other metadata that is required to identify a particular set of logs. A unique combination of labels is called a “stream,” and each stream of logs is compressed into “chunks.” Chunks are the fundamental unit of work within Loki. When you run a query, Loki fetches these chunks from storage (usually an object storage service like Amazon S3), decompresses them, and processes the log lines according to your query.
While this post relates to Grafana Cloud Logs, the learnings apply to any self-hosted installation of Loki or Grafana Enterprise Logs.
Access patterns of log data
In observability use cases, log access patterns tend to skew towards recent data. Below is a graph showing the volume of chunk data consumed within various defined “buckets” of time. Over a 30-day period, we can see a definitive skew towards very recent data (less than 3 hours old), with almost 70% of chunks volume for the last 24 hours. This indicates a very high recency bias.

Several reasons contribute to this skew:
- Logs are generally used to understand what is happening right now or in the recent past.
- Grafana dashboards can auto-refresh, and only the latest data is retrieved on every refresh.
- Alerting and recording rules generally evaluate on recent data.
Following this, it would at first appear sufficient to cache only the last few hours’ worth of data. In the sections that follow, we’ll see how our intuitions and even our success criteria were proven wrong.
Caching
To understand the caching patterns of log data — and most observability data, in general — let’s compare two types of websites and how they might cache their data:
- News website: News, by nature, skews towards recency. Old news is less valuable than current news, so recent news articles will see higher traffic. Once a story publishes, we may see a curve similar to Figure 1 above: high request rates soon after publishing, with a slow but steady trail off over time. At some point, old news is very rarely accessed.
- Streaming service: A streaming service, on the other hand, may have TV shows and films that are popular and timeless. This data will be accessed regularly over long spans of time.
Observability data is far more like a news website than a streaming service. Any one single chunk is likely not going to be “hot” in the cache for very long and will soon be replaced by another, more recent chunk.
Why and how Loki caches chunks
Primarily, we cache chunks to improve query execution speed. When a chunk is not in cache, we have to fetch it from object storage – a process that can potentially be slow, wasteful, and expensive. A single query can address hundreds of thousands or even millions of chunks, and object storage APIs only allow single objects to be accessed per API call.
There are two important things to note about how Loki caches chunks:
- Loki caches every chunk that it retrieves for query execution. The query engine will first check if the chunk is in cache, and if not, it will retrieve it from object storage. Chunks are buffered in memory and written back to the cache asynchronously.
- Loki caches every chunk produced by ingesters. This is done for two reasons: As we’ve seen, log access is heavily skewed towards recent data, and ingesters create chunks with the most recent data. Secondly, these chunks need to be written to object storage, but since Loki enables replication via its distributors, it’s possible the ingesters could write the same chunk multiple times. Once a chunk is written to object storage, it is stored in the cache; the cache is checked before each write to object storage, so if the cache is present the ingester will not try to store it again.
How we previously sized our caches
Our Grafana Cloud Logs service ingests hundreds of terabytes of logs per day. The service is available in more than 20 cloud regions across three major cloud providers and, naturally, some are busier than others. Each installation of Loki in these regions is called a “cell.”
Each cell contains a cluster of memcached servers. We sized these clusters proportional to 1-3 hours’ worth of chunks. As we saw in Figure 1, with this capacity, we should be able to serve roughly 60% of chunk data out of cache.
When we initially set up our caches, our assumption was that all cells would follow this same data access pattern. Over time, some cells grew much larger than others, and our access patterns started to change.
Diverging access patterns
One of our largest cells, loki-prod3, was producing over 6TB of chunks a day. It had a memcached cluster of 200 instances, each with 1 CPU and 6GB of RAM. With 1.2TB of cache, that’s roughly 4-5 hours’ worth of capacity.
Our cells are multi-tenant, which means the compute resources are shared between customers.
Over time, some cells began developing skewed access patterns based on these customers’ different Loki usage models. For example, in loki-prod3, a vastly different distribution of chunk volume began to emerge:
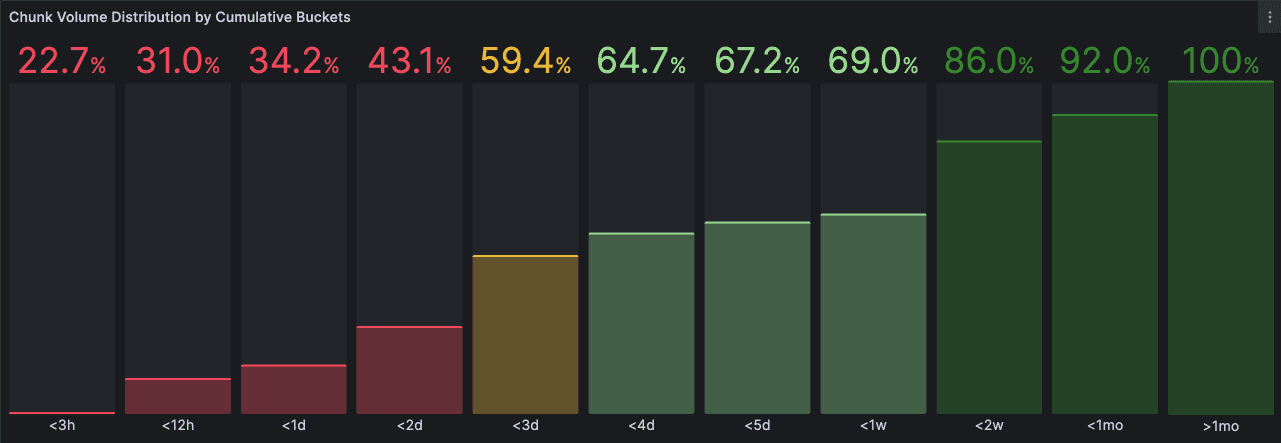
Compared to the general pattern, where ⅔ of chunk volume was requested for the last 24 hours, this cell requests that volume over a 5-day range. This means that customers in this cell are looking at much older data (generally 0-5 days) routinely, compared to the global pattern of mainly looking at the last 24 hours.
What was confusing however, was that when we looked at our cache’s key success metric (hit rate), everything appeared to be working quite well. Let’s dig in.
The “golden signal” of caching: hit rate
Hit rate is defined as the number of hits divided by the total requests retrieving items from cache. A high hit rate usually indicates a cache server is performing well (i.e., items that we need to fetch regularly are available in the cache when we need them.) If our cache is empty, the hit rate will be 0%, but as it fills up, we might expect that rate to approach 100%.
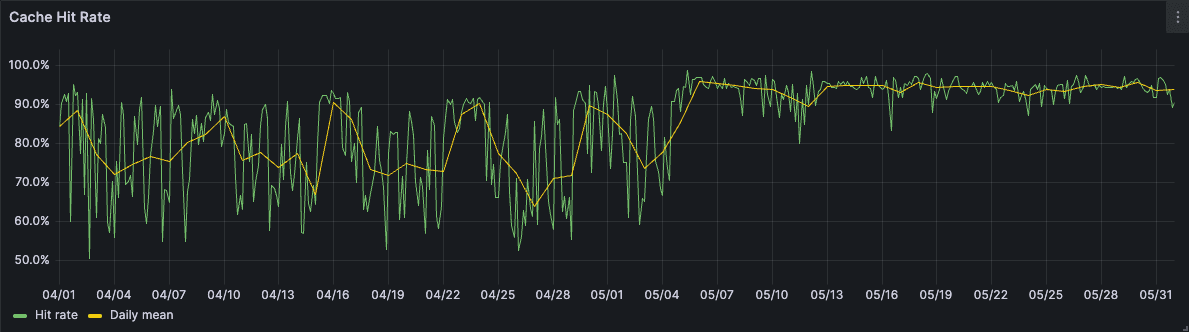
Figure 3 below shows the cache hit rate for loki-prod3 across a 30-day period:

We can see a quite satisfactory hit rate: 70+% of the items we request from cache are there when we need them. How can this be true? If we’re only able to store ~3 hours’ worth of data in cache, and only 35% of the chunk volume is requested for the past 3 hours, how is there such a high hit rate?
One possible (but incomplete) explanation could be that Loki automatically splits range queries by “intervals” to parallelize execution. The split_queries_by_interval config option controls this, and it defaults to 30 minutes. max_chunk_age, however, defaults to 2 hours — which means a single chunk can be referenced by multiple sub-queries in a short span of time.
Hit rate is only one lens through which to view cache behavior. As we’ll see, the hit rate can be quite deceiving if we don’t consider it in the context of “churn.”
Churn
Memcached uses a Least-Recently Used (LRU) cache replacement policy, to retain frequently used items and discard (evict) the least frequently used items to make space for new ones. This mechanism breaks down if we are constantly adding items to the cache but it is insufficiently large.
Cache “churn” is defined here as a stored item that is not retrieved even once before it is evicted (memcached calls this an unfetched eviction). Churn is a particularly bad state for a cache because it means it is ineffective at best and, at worst, just wasting resources.
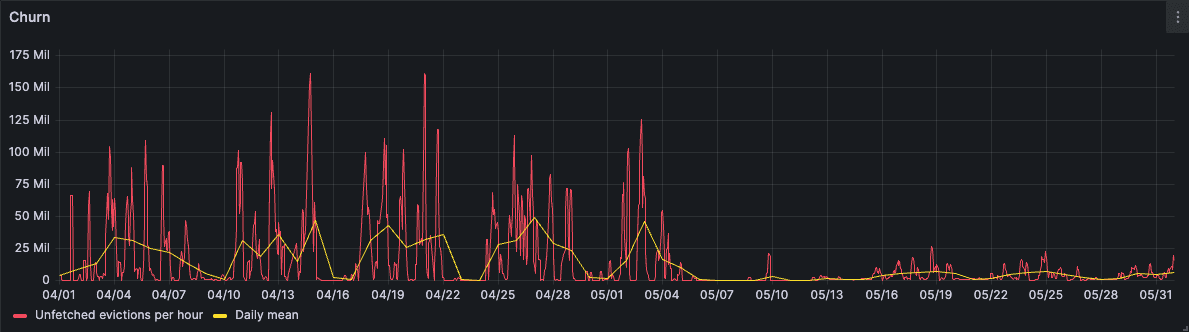
Figure 4 below shows loki-prod3’s excessive churn rate on an hourly basis.

This shows that we’re evicting as many as 150 million chunks per hour to make space for new chunks! Those chunks will then be evicted before they can even be accessed once.
Visualized a different way, in Figure 5 we can see the cache being fully replaced (meaning, every item is evicted) up to 40x an hour:

As we’ve seen, it’s possible to have a reasonably high hit rate even though the cache is constantly being churned: our cache access patterns skew towards recent data, almost all of which will result in hits, with the remainder of the requests resulting in misses.
The problem(s)
Our caches were too small to hold the amount of chunks we needed.
The more chunks we evict from cache, the more chunks we need to re-fetch from object storage. The more we fetch from object storage, the slower queries become to process and the more expensive our service becomes to run.
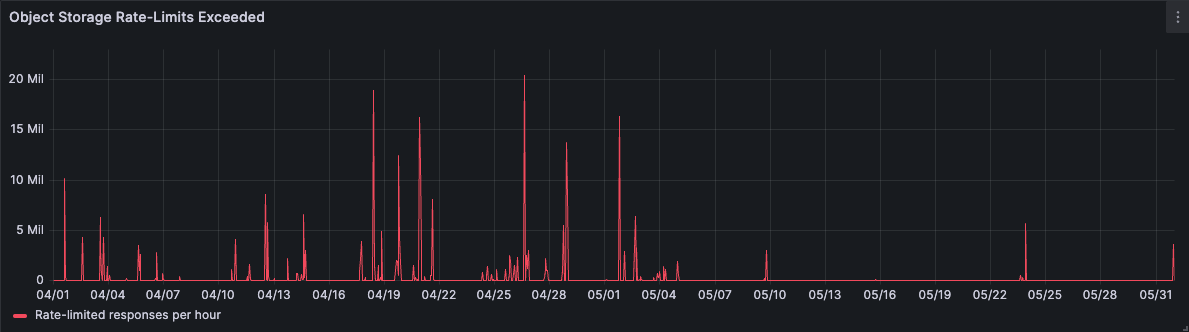
As time went on, though, we would face an even greater problem: object storage rate-limiting.
Rate-limiting
Loki provides first-class integrations with object storage services like Amazon S3, Google Cloud Storage (GCS) and Azure Blob Storage. These services have enabled our community as well as ourselves, in our Grafana Cloud Logs service, to scale in the face of ever-increasing demand.
These services are provided regionally, with multi-tenancy at their core. As with any distributed system, certain limitations have to be put in place to prevent one tenant from negatively affecting the performance and reliability for others (the so-called noisy neighbor problem). These limitations come in the form of “rate-limits,” which limit how fast a tenant can retrieve data, or how many requests a tenant can make per second.
Under the right conditions, Grafana Cloud Logs was that noisy neighbor. Our tenants would make requests that required too much chunk data to be retrieved, which would issue too many requests to our object storage provider.
When we reach a particular threshold, our requests start to be rejected with 429 Too Many Requests or 503 Service Unavailable. Loki has the ability to retry failed chunk requests, so this does not fail queries — however, it does introduce additional churn and latency.
“The Incident”
In 2022, a large customer was running large-scale test queries that addressed millions of chunks. Most of these chunks were not found in the cache, so they were retrieved from object storage. We bumped into the rate-limits several times until a threshold was breached and a more severe rate limit applied; suddenly we had effectively lost all access to our storage bucket! This was truly a nightmare situation, and took us 24 hours to resolve with the provider.
This added further momentum behind our new resolution: we needed to avoid rate-limiting as much as possible to maintain a high level of performance and reliability for our service.
Working towards a solution
As we’ve seen, this loki-prod3 cell and others have a vastly different access pattern than the overall pattern. We needed to size the cache on this cell to meet the demand. We needed a solution that would mitigate our problems in the short term to buy us time to solve them permanently in the mid-long term.
Sizing
As we saw in Figure 2, in order to cache a critical mass — let’s say ⅔ — of chunks, we would need to cache ~5 day’s worth of chunks.
loki-prod3 was generating 6-8TB of chunks per day at this stage. We decided to overestimate slightly by aiming to store a full week’s worth of chunks, which would require 50TB of cache.

Cost
Below is a table calculating the monthly cost per CPU core and GB of RAM on the instance types we used for our previous memcached clusters. We derive an estimate by evenly splitting the cost of the instance between these two resources.
Google Cloud (source) | AWS (source) |
Instance type: n2-standard-8 | Instance type: m5.2xlarge |
CPUs: 8 | CPUs: 8 |
Memory: 32GB | Memory: 32GB |
Monthly on-demand cost: $283.58 | Monthly on-demand cost: $280.32 |
Cost per CPU: $17.72 | Cost per CPU: $17.52 |
Cost per GB RAM: $4.43 | Cost per GB RAM: $4.38 |
Recall from above that we had a cache of 1.2TB in size. Given the need to scale to 50TB (42x growth), and given the above cost per GB of RAM, it would cost us over $200,000 extra per month! This was clearly untenable, so we needed to find a more cost-effective option.
Local SSDs
We discovered that GCP, AWS and Azure all offered some form of local SSDs. Local, in this case, means physically attached to a virtual machine instance, which is essential for cache; cache workloads are very latency-sensitive. In recent years, SSDs have been steadily growing in capacity, decreasing in price, and increasing in throughput. SSD throughput and latency are just a couple orders of magnitude away from DRAM speeds now, and this makes them compelling to use in cache.
Cost-wise, they are equally compelling. At the time of publication, a 375GB SSD in GCP costs $30/month (or $0.08/GB/month!). AWS’ and Azure’s SSDs are built into the cost of the instance and are a bit more complex to calculate, but still represent a far more attractive cost per GB of cache.
Using these local SSDs, we would be able to drive the cost per GB of cache down about 98%, making this a viable solution. Now that we knew how we’d store the cache, we wondered how we’d manage it.
Solution: memcached
It turns out that memcached has already addressed the problem of expensive RAM-based caching. memcached added a feature called “extstore” in mid-2018 which seemed to directly address this problem.
extstore is quite simple, conceptually: Items that cannot fit into the LRU (in RAM) are simply transitioned to disk. In essence, extstore keeps all of its keys in RAM, and the values are split between RAM and disk.
It really is quite profound in its simplicity and ease of use. All one needs to do to use it is specify a path on disk and a size limit (-o ext_path=/data/file:5G). We won’t cover much of extstore’s internals here, because they’re covered in depth in memcached’s excellent documentation.
Using memcached extstore was an extremely attractive option for us for numerous reasons:
- Operational familiarity: We’ve been running memcached clusters in production for many years, and we know how to deploy and upgrade them; plus, it’s 20-year-old software at this point and incredibly stable.
- Zero code changes required: memcached is still exposing the same APIs, and the clients (our querier components) have no idea that an item is coming from RAM or from disk; we can use our existing memcached client code without any changes.
- Time-to-value: We were able to focus exclusively on solving the problem rather than wrestling with configuration and tuning. Testing to production rollout took just two weeks!
Additionally, extstore has been written in a mechanically-sympathetic fashion to not burn out the SSDs. This both improves performance and slows the rate of disk aging.
Results
We provisioned a 50TB cache, capable of storing over 100 million chunks, on May 4, 2023 in loki-prod3.
Object storage
Figure 7 below shows how we reduced our requests to object storage by 65% over a one-month observation window.

Rate-limiting was all but eliminated as well. We still anticipated some rate-limiting based on localized hot-spotting of heavy queries, but in general it appears our modeling was correct: By increasing the cache size to accommodate a critical mass of objects, we very rarely bumped into rate-limits from then on.
Success metrics
Cache hit rate significantly improved to 90%+ following the rollout, and continued to improve as the cache filled passively from queries being run.
Churn also dramatically dropped following the rollout.
Visualized a different way in Figure 11, notice how before the rollout we were fetching roughly the same amount of data from the store and from cache? Following the rollout, the overwhelming majority of chunk volume was retrieved from the cache. This is perhaps the single graph to best represents our success:

Both the 50th and 99th percentiles of query throughput were slightly improved by this change. We actually expected to see further performance improvement from this change, but clearly our bottlenecks are not in data access right now.


Cost
Below is a table comparing our previous and new memcached configurations:
Previous configuration | New configuration |
Shared | Dedicated |
200 instances | 33 instances |
1 CPU, 6GB RAM | 6 CPU, 5GB RAM |
- | 4 x 375GB SSDs (1.5TB) |
Total cache: 1.2TB | Total cache: ~50TB |
Monthly cost: $8860 | Monthly cost: $8708 (-$152) |
That’s 42x the capacity for essentially the same cost!
Trade-offs
Software engineering is about balancing trade-offs carefully. Our solution is not perfect; let’s look at the warts together.
Latency
As one might expect, adding disks into the architecture would cause a steep increase in latency:

This is measuring the median (50th percentile) latency of requests from our querier components to memcached. Before the rollout, the latency was fairly stable - usually in the low single-digit millisecond range; following the rollout, we saw latencies becoming far more volatile. SSDs have their limitations, and memcached extstore works around them about as well as can be expected. We have a fundamentally random (as opposed to sequential) workload, and disks tend to perform worse with random reads and writes.
However, this increased latency is entirely tolerable when you consider two factors:
- Cache operations can be batched, whereas object storage operations are per object.
- Object storage latency is typically much worse than reading from disk; ultimately there’s a disk somewhere (“the cloud is just someone else’s computer”) and a network in between, so by definition it’ll be slower than just accessing a local disk.

Operational complexity
By introducing disks into our cache architecture, we now have a few new failure modes:
- Disks can fill up: if the SSD were to fill up, memcached would not be able to write any new objects. This is mitigated by configuring an appropriate size for
the ext_pathvalue as we saw above (watch out for filesystem reserved space!); extstore will never exceed this size. - Disks can age: as SSDs receive writes over time, their health diminishes and their latency starts to increase. We mitigate this by monitoring each disk’s read/write latency, and if it breached some threshold (median latency of 50ms over 30 minutes), the disk is considered too unhealthy to use. In these cases we drain the node and re-provision (hopefully fresh or repaired) SSDs.
- The disks are not managed by us: the underlying disks might encounter some hardware failure, and the whole instance on which the disk is mounted could be taken down while the disk is replaced or repaired. In these scenarios we would not know why the instance went down, and we would lose that portion of the cache.
Larger losses
Bigger caches = larger losses from instance failure. Previously we had 200 instances running memcached, so losing one instance would be 0.5% (6GB) of the cache. Now with 33 instances, each instance failure loses ~3% (1500GB) of the cache. Isolated instance failures are designed for and expected (this is why we didn’t set up 17 instances with 3000GB SSD each), but it’s a lot of data to lose at once. It’s not entirely problematic, since we can just refill the cache, but it requires time and money because we fill caches passively from the object store.
Durability
Related to losses, we should discuss the durability of the data on these SSDs. Neither GCP nor AWS guarantee that an SSD will retain its state in all situations. Also, memcached cannot currently “rehydrate” a cache (but there is active work being done on this) from an SSD between server restarts. These are not strictly trade-offs because the caches were not durable beforehand when they were stored in RAM.
Currently, when an upgrade of the memcached cluster or the underlying compute instances are required, we lose the whole cache. Once extstore can rehydrate the cache from disk, the cache will be durable across restarts of the memcached server. When an upgrade occurs on the underlying compute infrastructure, which requires destroying existing instances and creating new ones, we currently have no planned mechanism for retaining the cache.
Other considerations
This post is already quite long so we omitted any discussion of network throughput, but we would be remiss to not mention it. Monitoring and operations are also worth a brief mention.
Network throughput
Network throughput is one limiting factor in the cloud when dealing with data of this scale. Our cache for loki-prod3 ended up requiring 500Gbps of network throughput, and each of the n2-highcpu-8 instance type is rated for 16Gbps: totalling 528Gbps across the 33 instances.
Monitoring and operations
We made extensive use of Prometheus, Alertmanager, Grafana (and, of course, Loki!) when analyzing, deploying, and monitoring this solution. The memcached_exporter and node_exporter were both essential for observing the behavior of both the caches and their underlying disks and networks.
Acknowledgments
Memcached’s maintainer, @dormando, was incredibly helpful throughout this project and was extremely generous with his time. Thank you! Also, a special shoutout to my colleague Ed Welchwho helped design and implement these changes.

