Reduce MTTR with Grafana, Grafana k6, and Prometheus: Inside DHL’s observability stack
Each year, more than 296 million packages are shipped around the world via DHL and their premium service, Time Definite International. And at DHL Express Switzerland, a local unit of the international logistics and shipping company, the IT team provides solutions for tracking customs clearance progress, analytics, mobile and optical character recognition (OCR) scanning, and warehouse management on every package that moves through Switzerland.
It’s a complex operation that requires a multi-layered business and IT framework where every minute and every shipment counts. Translation: There’s very little room for downtime, false alarms, errors, and failed requests.
In their recent GrafanaCON 2023 talk, “Transforming IT and business flows at DHL Express with Grafana, k6, and Prometheus” (now available on demand), Head of IT Djamel Djedid and Lead Architect Michael Lerch shared how their phased approach to implementing a Grafana-centric observability solution has helped DHL Express Switzerland resolve issues faster, save manpower, and expand its observability beyond traditional IT monitoring.
Phase one: POC with Prometheus + Grafana
In early 2020, the team identified the need for a more modern and scalable SRE solution. Their legacy monitoring system was siloed, which meant that their teams were often reactive when issues arose.
They ran a proof of concept with Grafana and Prometheus, eventually making the decision to migrate critical legacy watchers to Prometheus. With the support of Grafana training and self-learning, the team implemented their new stack at a larger scale just in time to tackle a busy period for the business — and to much success.
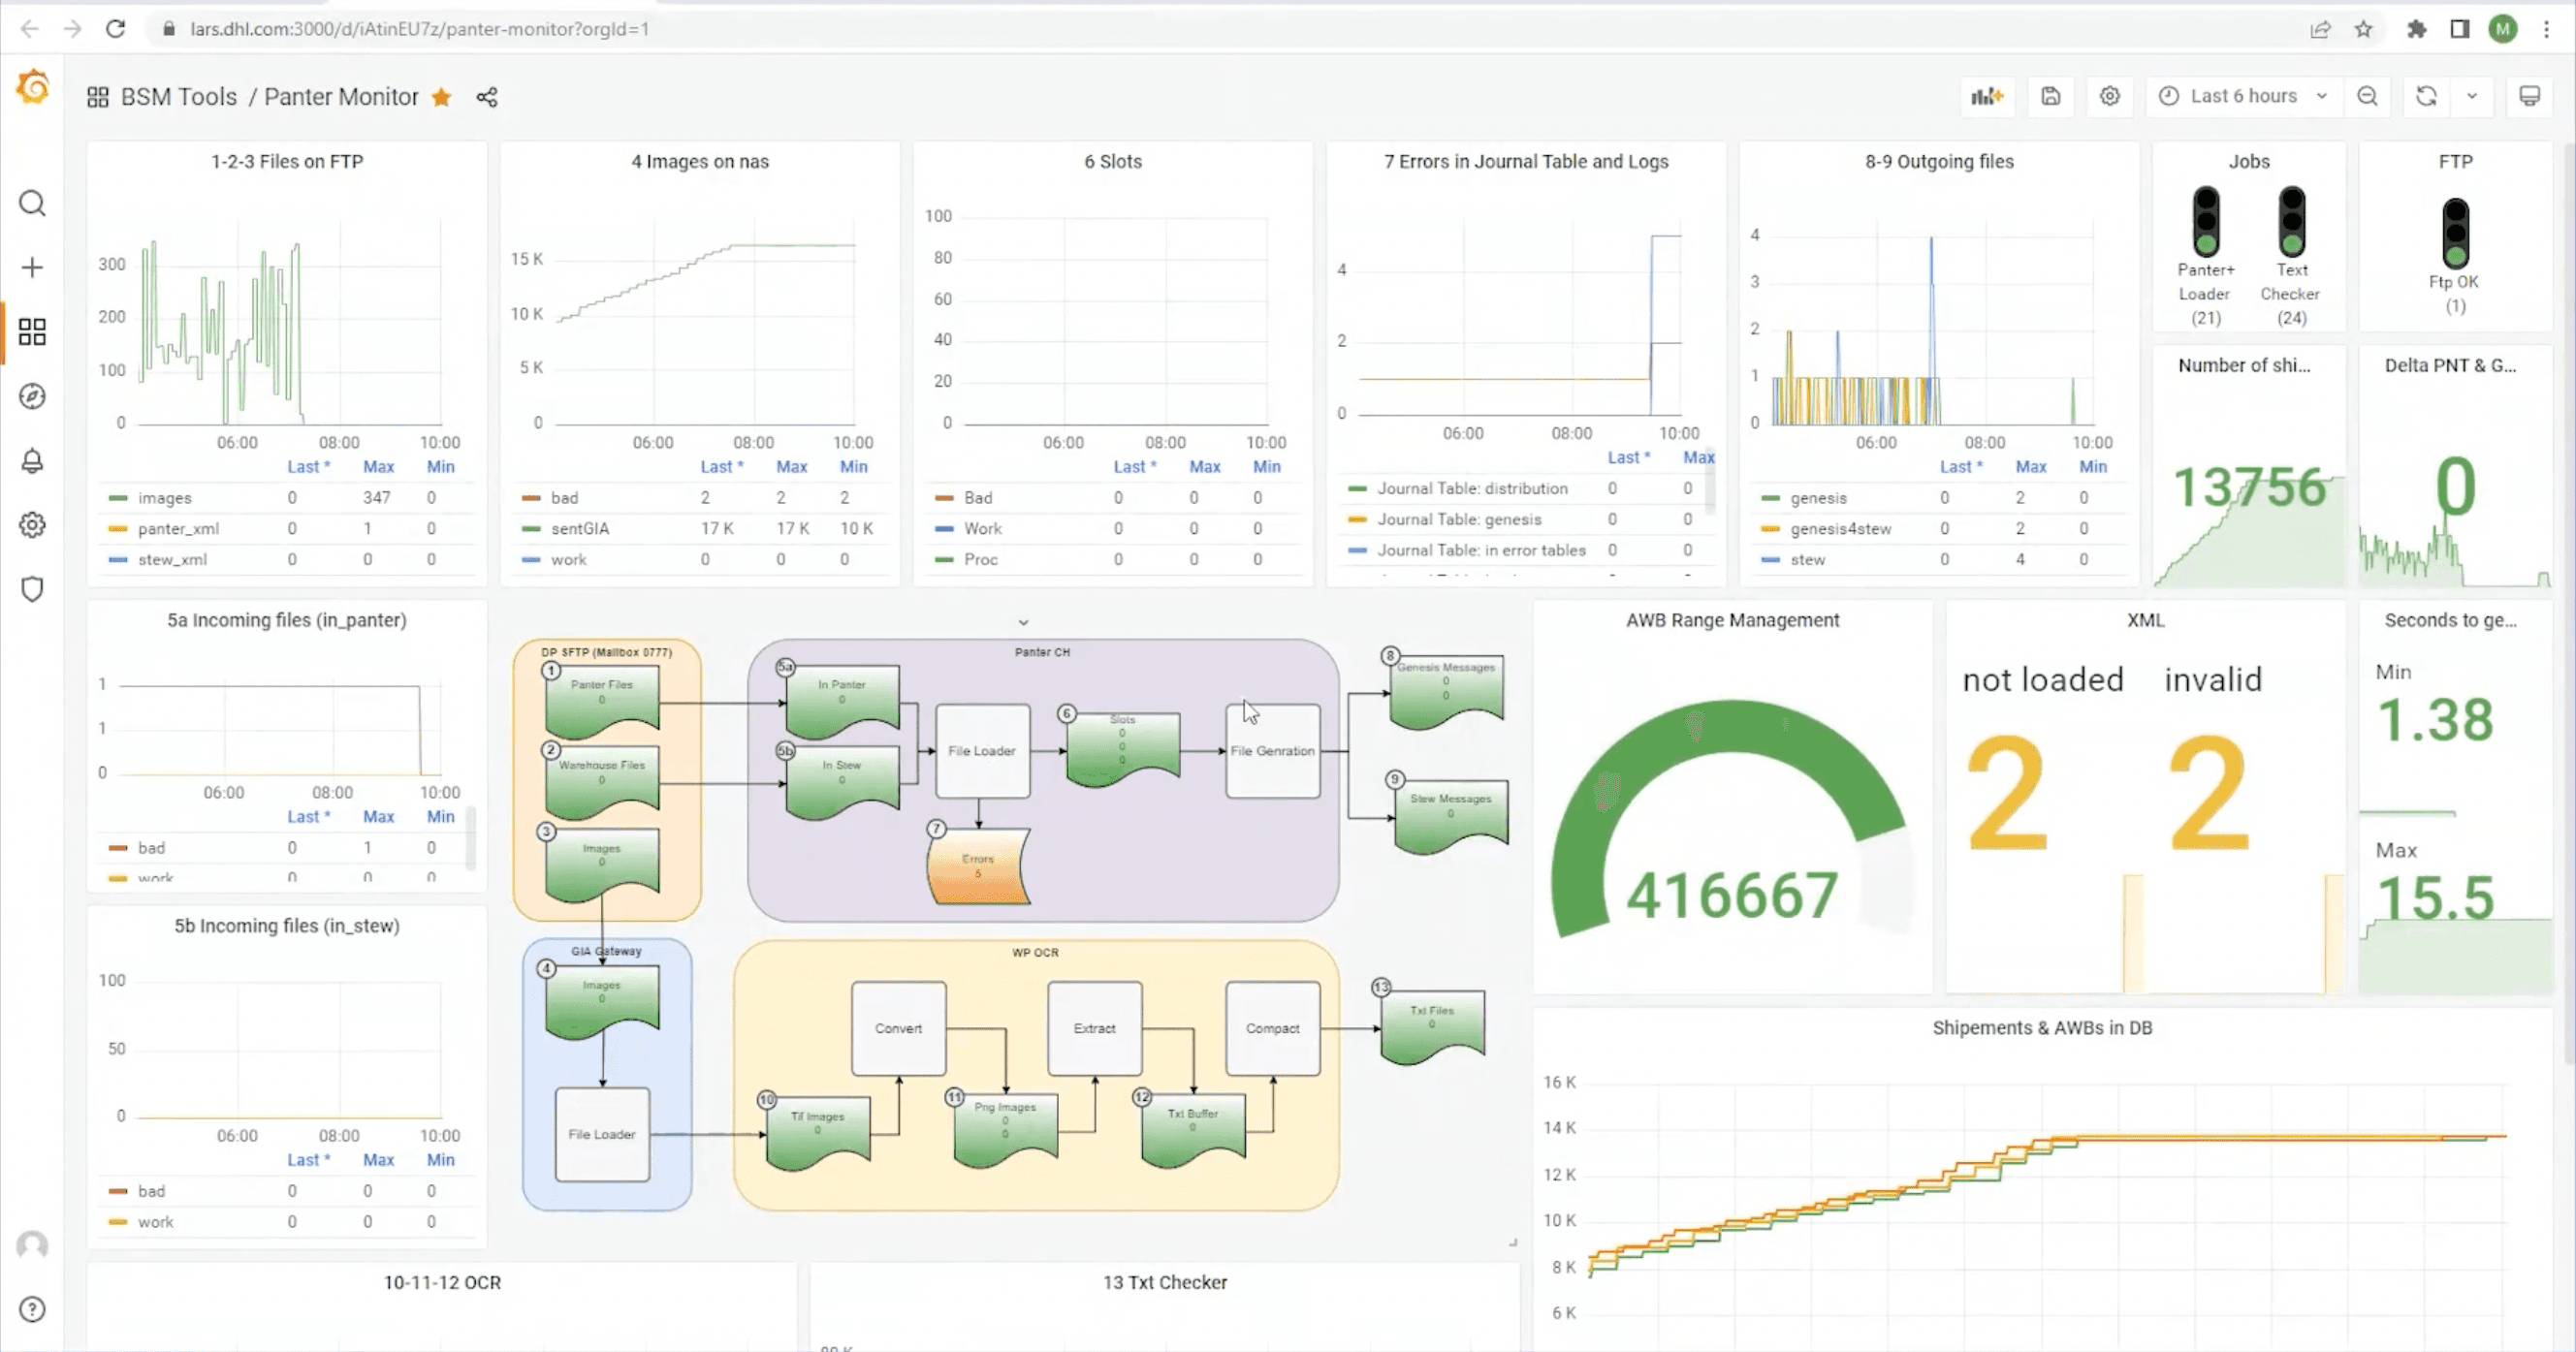
They developed Grafana dashboards like the one below, which monitors global customs clearance data. These dashboards allow the team to quickly see and share where bottlenecks are occurring and identify how to resolve them.

Phase 2: Full speed ahead with Grafana Alerting
In 2021, the team was ready to move to a more robust implementation of Grafana dashboards and Grafana Alerting. They built additional dashboards and integrated alerts with Microsoft Teams and their internal Wiki.
“Our alerts contain the name of the application, a description of the issue, a link to the Grafana dashboard, as well as a link to a wiki in Microsoft Teams containing remediation instructions,” said Lerch. The result? No matter who is on duty, they can quickly address issues that arise and resolve them faster than ever before.

At the time, the team also made a huge shift. “We decided that SRE and observability would be a default attribute of every new application,” said Djedid. From that time on, every new application had to come with its own Grafana dashboard and monitoring. This approach delivered a huge improvement during the subsequent surge in business for DHL Express. Most issues were proactively detected and resolved, driving higher customer satisfaction.
Phase 3: Load testing with Grafana k6 for a smooth cloud migration
After implementing Grafana, the team started an infrastructure modernization project in 2022 to move some of their servers from on-premises data centers to the public cloud. “We needed to monitor performance and ensure the migration wasn’t negatively impacting performance for end users,” said Djedid.”We wanted a tool that could measure the latency between the user and the on-prem server and the cloud server.” Enter Grafana k6.

Performance testing with Grafana k6 took the guesswork out of moving from on-prem servers to the public cloud for DHL Express Switzerland.
By developing k6 scripts to measure the main trends of their business-critical applications, the team could test performance for different user scenarios in both the on-prem environment and the cloud environment. Load testing revealed that the cloud servers were much more stable for a larger number of users. “Grafana k6 really helped us be confident that the solution we were implementing was reliable and scalable,” said Lerch.
Phase 4: Adding Grafana Loki, Grafana OnCall, and beyond
As of 2023, the team has grown their Grafana implementation to 80 alerts, 40 dashboards, and 60 active users. They’re also planning to add Grafana OnCall for incident management, and they’re exploring Grafana Loki for logs as well.

“This observability stack provides so many benefits,” said Djedid. But his favorite part is the clean and comprehensive view he gets of all DHL Express systems each morning at his desk.
“I love arriving each morning and looking at the Grafana dashboards showing everything is OK,” he said. “You don’t need to scroll emails or hope that no one will ring or ping you — you already know.”
To see more dashboards from the DHL Express team and learn more about their cloud migration load testing, watch the full GrafanaCON talk. All sessions from GrafanaCON 2023 are now available on demand.


