How to monitor pool water levels from anywhere with Grafana
I’ve had a swimming pool at my house in Massachusetts since 2016. One of the problems that pool owners like myself face when we go on vacation or leave for several days is evaporation from the pool and the water level dropping below the skimmers.
This can happen due to sunlight and warm temperatures. It can also happen when temperatures drop at night and the pool is being heated — the water temperature is warmer than the air, causing the water to evaporate. When the water level drops too low, the pump starts ingesting air instead of water and can quickly destroy itself. The cost to replace most pool pumps is well over $1,000, so it’s imperative that the water volume stays high enough while the pump is running.
Grafana Labs is a remote-first company, so I work from my home, which makes it easy to keep tabs on my pool levels. One of my daily habits involves going outside and checking on my pool. Think of it as the at-home equivalent to taking a walk to the water cooler when you work in an office.
However, I recently attended a weeklong in-person onboarding for my new role as a senior solution engineer, and when I returned home, I found my pump running with no water going through it. Fortunately, I think it had just happened that day and my pump didn’t sustain any damage. Still, I realized I had to come up with some kind of solution before my family and I went on a 10-day vacation a few weeks later.
In this blog, I’ll describe the solution I built using a mechanical device, an IoT-enabled device, a home weather station, a Raspberry Pi, Prometheus, and Grafana Cloud (including Grafana Cloud Metrics and Grafana Cloud Logs). Follow along to learn how to monitor your pool from anywhere and visualize the data on a single pane of glass to answer these questions:
- How many gallons of water were automatically added to my pool in the last 24 hours?
- Did the pool get filled to the desired level?
- What was the temperature at my house in the last 24 hours?
- How much rainfall accumulated at my house in the last 24 hours?
- Is my Python Listener running?
- How does this water consumption compare to past usage based on accumulated rainfall and air temperatures?
Getting on the level
Before I even thought of integrating Grafana with my pool, the first thing I did was look at lots of different solutions for filling the pool automatically or detecting water loss. There were some interesting options, but they were very costly to retrofit. They would have involved cutting concrete, running water lines, and running electrical lines.
I found the most cost-effective approach was a mechanical device called a Pool Sentry, which is basically a device with a float that works exactly like a toilet. The water level drops, the float goes down, and the water valve opens to allow water from the hose to fill the pool. As the water level rises, it moves the float up until it reaches the desired height and then the valve closes to stop the flow of water.

This was a great fix, but I didn’t like the idea of the outdoor spigot being turned on 24 hours per day, in the event that something happened to the attached garden hose or the Pool Sentry. I also didn’t receive any data from the Pool Sentry since it wasn’t a smart device — there was no way to know how much water was being added to the pool or if it was full.
To solve this problem, I found the LinkTap G2S, an IoT-enabled smart water controller you can attach to a garden hose. It even had a flow meter built into it to monitor how much water was being consumed. Combining the LinkTap with the Pool Sentry allowed me to define a schedule to turn the hose on for two hours a day so I could monitor how much water the Pool Sentry added to the pool.

As you can see from these screenshots from the iOS app on my phone, the LinkTap G2S collects all sorts of interesting data, including daily watering history.

Diving in to Grafana
Once I saw all the data coming from LinkTap, I thought to myself how cool it would be to bring this data into Grafana. LinkTap has a REST API you can use to access the data. They also have an API that allows you to connect your own listener to receive all events from your LinkTap device. I decided to write a short Python script that functions as an HTTP listener and writes the events to a log file. Here is a sample of the log output. I’ve redacted my identifying information, so just replace that with your own information if you plan to use this code:
{"message": "", "msg": "wateringOn", "gatewayId": "[gatewayId]", "deviceId": "[deviceId]", "totalMin": 120, "totalSec": 0, "onMin": 120, "onSec": 0, "vel": 0, "vol": 0, "battery": "100%", "signal": 54}
{"message": "", "username": "[username]", "event": "watering start", "title": "Watering started on 7/19/2023", "content": "TapLinker started watering at 12:32 for 120 min", "gatewayId": "[gatewayId]", "deviceId": "[deviceId]", "workMode": "M"}
{"message": "", "msg": "flowMeterValue", "gatewayId": "[gatewayId]", "deviceId": "[deviceId]", "vel": 8517}
{"message": "", "msg": "flowMeterValue", "gatewayId": "[gatewayId]", "deviceId": "[deviceId]", "vel": 14621}
{"message": "", "msg": "wateringOn", "gatewayId": "[gatewayId]", "deviceId": "[deviceId]", "totalMin": 120, "totalSec": 0, "onMin": 119, "onSec": 0, "vel": 14295, "vol": 14295}
{"message": "", "msg": "wateringOff", "gatewayId": "[gatewayId]", "deviceId": "[deviceId]", "end": {"Y": "20230719", "H": 14, "M": 12, "ss": 31, "D": 0, "S": 0}, "vel": 0, "vol": 0, "ecoFlag": 0, "battery": "100%", "signal": 54}

LinkTap API -> Python Listener -> Grafana Cloud Logs <- Grafana
I dug up an old Raspberry Pi that had been collecting dust and deployed Raspberry Pi OS onto it. I installed Promtail and Prometheus onto it using Docker, and I wrote a short Python script that functions as a listener to receive the events. I also wanted the service to start in case there was an unexpected reboot, so I created a service for it using systemd.
Next, I connected Promtail and Prometheus to Grafana Cloud, which allowed me to have my log data and metrics in Grafana. However, the raw log data wasn’t as interesting as a time series graph. The whole point of getting the data into Grafana was so that I could have a visual representation of it! I had to tap into some of my peers at Grafana Labs to figure out how to use the unwrap function to separate the metrics from the log in order to display a time series:
sum(sum_over_time({filename="/home/brian/python-scripts/logs/linktapEvents.log"} | json | msg="wateringOn" | __error__="" | unwrap vol [1m]) / 3794)The result is a beautiful graph!

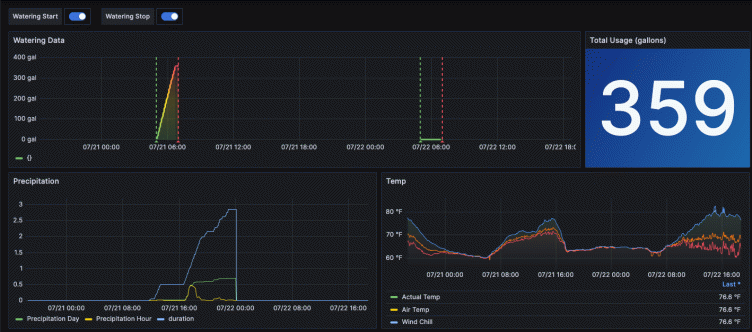
As you can see, I set it up so Grafana creates annotations automatically from the wateringOn and wateringOff events, so now I had the vertical green and red lines on my time series graph indicating the start and stop times.
For example, in the graph above I can interpret the flattening of the line shortly after 06:00 as the time when the Pool Sentry stopped the water flow and the pool was filled to the desired level. I also added a gauge visualization showing the total water consumption during a given time period.
I also created a probe using the Prometheus BlackBox exporter to monitor the status of my Python Listener and added it to my dashboard. That way, I know if something happens to my Python Listener.

Once that was all in place, it raised other questions: If no water was being added to the pool on a given day, was that due to rain or not? Also, how would I know if the temperature got cold so that I can interpret water loss due to low temperatures? To address these issues, I installed a Tempest weather station based on the recommendation of some of my peers. I was able to run an exporter I found in GitHub using Docker and exported the data to Prometheus, which then wrote the metrics data remotely to Grafana Cloud Metrics, which is powered by Grafana Mimir.
`Tempest -> Tempest Cloud <- Tempest Exporter <- Prometheus -> Grafana Cloud Metrics`The Tempest exporter pulls its data from Tempest Cloud. My local instance of Prometheus then scrapes that data and publishes it to Grafana Cloud Metrics so I can visualize it in Grafana Cloud.

With these additions, I could bring together data from two IoT devices into a single pane of glass to evaluate water consumption, rainfall, and the ambient temperature. As you can see from the screenshot above, 270 gallons of water were added on a rainless day, and the water turned off after the water reached the desired height.
And in the example below, two separate days — one dry and one rainy — are visualized, and you can see how the system responded appropriately on each occasion.

Pool monitoring reflections
This project has been a lot of fun for me. As a new Grafanista, it gave me some real life use cases where I was personally invested in learning our products. It also worked flawlessly while I was on vacation with my family. A friend stopped by the house to check on things but he didn’t need to make any changes. I was even checking my dashboards daily from Italy and seeing how much water was added to the pool and knew that I wasn’t having a problem.
Given how successful it was, I’m looking at more ways I can use Grafana to monitor the pool. For example, I’d like to integrate some alerting in a future iteration so I can receive proactive alerts if something goes wrong.
And if you’re looking to monitor your pool volume, hopefully this solution can work for you too!


