How Qonto used Grafana Loki to build its network observability platform
Christophe is a self-taught engineer from France who specializes in site reliability engineering. He spends most of his time building systems with open-source technologies. In his free time, Christophe enjoys traveling and discovering new cultures, but he would also settle for a good book by the pool with a lemon sorbet.
One of the most common types of incidents I deal with as a site reliability engineer at Qonto — a fintech company that focuses on simplifying and streamlining banking processes for businesses — is networking. As other SREs know, a single mistake can leave users with a bitter taste of disappointment and make your product look unreliable.
Qonto offers a digital banking platform that allows users to open business accounts, make payments, manage expenses, and access various financial tools. Our goal is to empower and energize small and medium-sized enterprises (SMEs) and freelancers through an intuitive and reliable financial solution.
For Qonto SREs, our priorities are ensuring minimal downtime and avoiding partial outages for our users. To address the inevitable networking incidents, our objective was to achieve complete observability of all network traffic going around in our networks by ingesting 40,000 records per second, resulting in approximately 30 TB of compressed data per month.
Yes, that is a significant amount of logs.
When I joined Qonto in 2022, we were exclusively using Elasticsearch for log ingestion and search, and to be honest, we were a little concerned with the cost implications that extra quantity of logs would have on our existing Elasticsearch clusters. As a result, we started exploring alternative tools. We would only make a switch to something that offered substantial advantages — and we found that with Grafana Loki.
Since January 2023, we’ve been leveraging Loki to ingest all of our network logs. Loki’s query language, LogQL, is very powerful, and we use it to effortlessly detect blocked traffic to specific TCP ports or IP ranges, searching through hundreds of gigabytes in a matter of seconds. That alone has made networking (almost) fun again for us!
In this post, I’ll take you through how we came to our decision to use Grafana Loki to build our network observability platform, our new architecture, and how we now explore our logs with Loki.
Grafana Loki vs. Elasticsearch
When it came to selecting our network log datastore, we needed a product that could do the following:
- Log all network traffic (VPC flow logs) while being cost-efficient
- Generate metrics and trigger alerts, ideally using our existing Prometheus and AlertManager setup
- Enable efficient search and filtering of logs
Three options were on the table: AWS’s native toolchain (CloudWatch Logs, Athena, Glue, etc.), Elasticsearch, and Grafana Loki.
The AWS toolchain option was quickly discarded due to its high pricing. Although it offers a fully managed service, the cost of $0.59/GB of uncompressed data was significantly higher compared to the other solutions at this scale. (In our case, data transfer costs within AWS would be negligible because we use VPC endpoints.)
We were down to two options, and here’s how they compared:
| Grafana Loki | Elasticsearch | |
|---|---|---|
| Cost of ingesting data | low | low |
| Cost of storing data | low | high |
| Cost of requesting data | high | low |
| Support for Prometheus Metrics / Alerts | ✅ | ❌ (need to use Elastic’s monitoring/alerting stack) |
| Monthly ingestion cost estimate for 30 TB of compressed S3 data, based on eu-west-3 pricing | $5,600 | $5,600 |
| Monthly cost estimate for 30 TB of compressed data (cost of running a cluster and storing data with 1-month retention), based on eu-west-3 pricing | $1,000-$2,000 to run Loki and store data on S3 | $7,000-$8,000 to run Elasticsearch and store data on AWS EBS (gp3) |
| Total price | $6,600-$7600 | $12,600-$13600 |
While Elasticsearch is a remarkable product, it didn’t align perfectly with our use case due to its high storage cost. To be fair, searching logs stored in S3 is possible with Elasticsearch, but the Searchable Snapshot feature requires an Enterprise license scheme, resulting in significant annual costs.
Typically, we access our extensive quantities of network logs for investigation purposes, such as when we encounter an issue like a connection timeout error message. Because network logs are high-volume and infrequently accessed, we decided to focus on optimizing storage and ingestion costs, rather than query costs.
In that regard, Grafana Loki emerged as the most suitable candidate.
Overview of our new architecture
This a high-level overview of our setup, which has proven to be resilient over time — in fact, we hardly ever think about it.

The components
Loki: Deployed in microservice mode using the loki-distributed Helm chart
Prometheus: Receives metrics from Loki-ruler and triggers alerts (more on that later)
AWS Resources:
S3 buckets:
- One to temporarily store the incoming raw VPC Flow Log files to be ingested
- One to store Loki’s data
Lambda Function:
The Lambda Promtail function is deployed with an SQS trigger
- Lambda Promtail is a subproject of Loki and serves as a connector to ingest logs from AWS-managed services such as CloudFront, VPC Flow Logs, AWS Load Balancers etc.
SQS:
One main queue that receives S3 notification events whenever a new file is dropped in the VPC Flow Log bucket
One Dead-Letter Queue (DLQ), that receives events that failed to be processed
- In case of an error during the ingestion process, Lambda directs the S3 event to a Dead-Letter Queue (DLQ), allowing for later reprocessing using AWS SQS’s DLQ Redrive feature. This feature enables the messages to be returned to the main queue, where they can be retrieved again by the Lambda function.
Exploring Loki logs using Grafana
Due to LogQL’s striking resemblance to the PromQL syntax of Prometheus, we found ourselves familiar and comfortable with Loki’s syntax in no time.
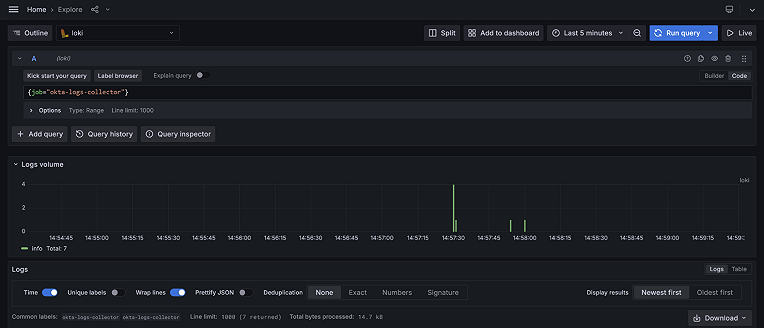
After adding Loki as a data source in Grafana, we were ready to explore our VPC Flow Logs using Grafana’s Explore tab.
Here’s a sample query:
{__aws_log_type="s3_vpc_flow", __aws_s3_vpc_flow_owner="<aws-account-id>"}
|= "REJECT"
| pattern `<acc> <vpc> <eni> <srcIP> <destIP> <sPort> <dPort> <protocol> <pkt>
<bytes> <start> <end> <action> <pktsrc> <pktdest> <tcpflag>`
| srcIP = ip("10.0.0.0/8")
| line_format `srcIP: {{.srcIP}} destIP: {{.destIP}} srcPort: {{.sPort}} destPort: {{.dPort}}
action: {{.action}} protocol {{.protocol}} tcpflag: {{.tcpflag}}`
It searches for all REJECTED network traffic
It parses the log record using a pattern expression and rewrites the log format using the `line_format` keyword.
It keeps only records with:
- A source IP from the 10.0.0.0/8 CIDR range
And voilà!
*")
Producing metrics and alerts out of network logs
At Qonto, we mainly use Prometheus and AlertManager to manage metrics and alerts. Leveraging Loki Recording Rules, the Loki Ruler can easily create Prometheus metrics. We then use these metrics to trigger alerts when an unexpected event occurs. Here are a few examples of queries we find useful:
To observe the rejected traffic count over the last minute
# Name of the Prometheus metric created
- record: loki:per_aws_account:rejectedflowlog:count1m
# LogQL query
expr: sum by (__aws_s3_vpc_flow_owner)
(count_over_time({__aws_log_type="s3_vpc_flow"}[1m]
|= `REJECT`
| pattern `<_> <_> <_> <srcIP> <_> <_> <_> <_> <_> <_> <_> <_> <_> <_> <_> <_>`
| srcIP = ip("10.0.0.0/8")))
# Extra labels
labels:
team: sre
The above metric is referenced in a PrometheusRule to alert on a surge in blocked traffic.
To get the top 20 destination IPs with the largest network throughput
- record: loki:top20dstip:egressbytes:sum1m
expr: topk(20, sum by (__aws_s3_vpc_flow_owner, destIP)
(sum_over_time({__aws_log_type="s3_vpc_flow"
,__aws_s3_vpc_flow_owner="<account-id>"}
|= "ACCEPT"
| pattern `<_> <_> <_> <_> <destIP> <_> <_> <_> <_> <bytes> <_> <_> <_> <_> <_> <_>`
| destIP != ip("10.0.0.0/8")
| unwrap bytes[1m]) > 1000))
labels:
team: sre
This metric computes the egress data volume per destination IP. The focus here is cost and security, rather than reliability. The metric was helpful to reduce our data transfer costs on AWS. We used it to identify that most of the data was sent to specific external services. We then optimized costs by tuning compression settings on some data transfers to external SaaS services and enabling missing VPC Endpoints (AWS ECR in particular).
Expanding our horizons
The success we’ve had internally with VPC Flow Logs has encouraged us to expand this approach to other use cases. As our needs evolve, we gradually extend Lambda Promtail’s capabilities to support ingesting logs from other AWS services. We recently contributed to the project to support CloudTrail logs ingestion and CloudFront log ingestion in batch mode, and we still have many ideas for the future.
I hope that this post has provided you with valuable insights to help you build your upcoming observability platform, leveraging the power of open-source technologies like Grafana Loki.
Happy logging and monitoring! (Interested in joining a challenging and game-changing company? Consult our job openings at Qonto!)
Want to share your Grafana story and dashboards with the community? Drop us a note at stories@grafana.com.