
Unify your observability signals with Grafana Cloud Profiles, now GA
Observability has traditionally been conceptualized in terms of three core facets: logs, metrics, and traces. For years, these elements have been seen as the “pillars” of observability, serving as the foundational components for system monitoring and delivering key insights to improve system performance.
However, with the exponential growth in system complexity, a more comprehensive and unified perspective on observability has become necessary. Continuous profiling, which provides insights into resource usage and latency down to the code level, offers just that. It doesn’t merely append another pillar — it challenges the whole notion of separate pillars. Instead, it promotes a holistic, integrated viewpoint of system health and performance.
In line with this shift in observability, we’ve been working on seamlessly integrating profiles with metrics, logs, and traces within our fully managed Grafana Cloud observability stack. Today, we’re thrilled to announce that Grafana Cloud Profiles, powered by Grafana Pyroscope OSS, is now generally available.
Enabling teams to correlate profiles with logs, metrics, and traces within Grafana further breaks down the traditional silos of observability. At the fintech startup Alpaca, “every nanosecond counts when pushing the performance envelope of our high throughput and low-latency trading systems,” says Chief Technology Officer Raja Bhatia.
“In addition to the highly intuitive ad hoc exploration that Pyroscope offers, the integration with Grafana gives us a holistic observability platform that helps correlate our application metrics within continuous performance profiles insights from Pyroscope – all within a single Grafana dashboard, which is critical to our performance and scale.”
— Raja Bhatia, Chief Technology Officer at Alpaca
Why correlate profiles with metrics, logs, and traces?
The “pillar” metaphor implies the existence of distinct entities, each contributing separate insights to system monitoring. This perspective, while helpful for conceptualizing observability, doesn’t fully capture how connected and dependent these elements are on each other. Logs, metrics, and traces aren’t siloed aspects — they operate collectively, influencing the overall health and performance of a system.
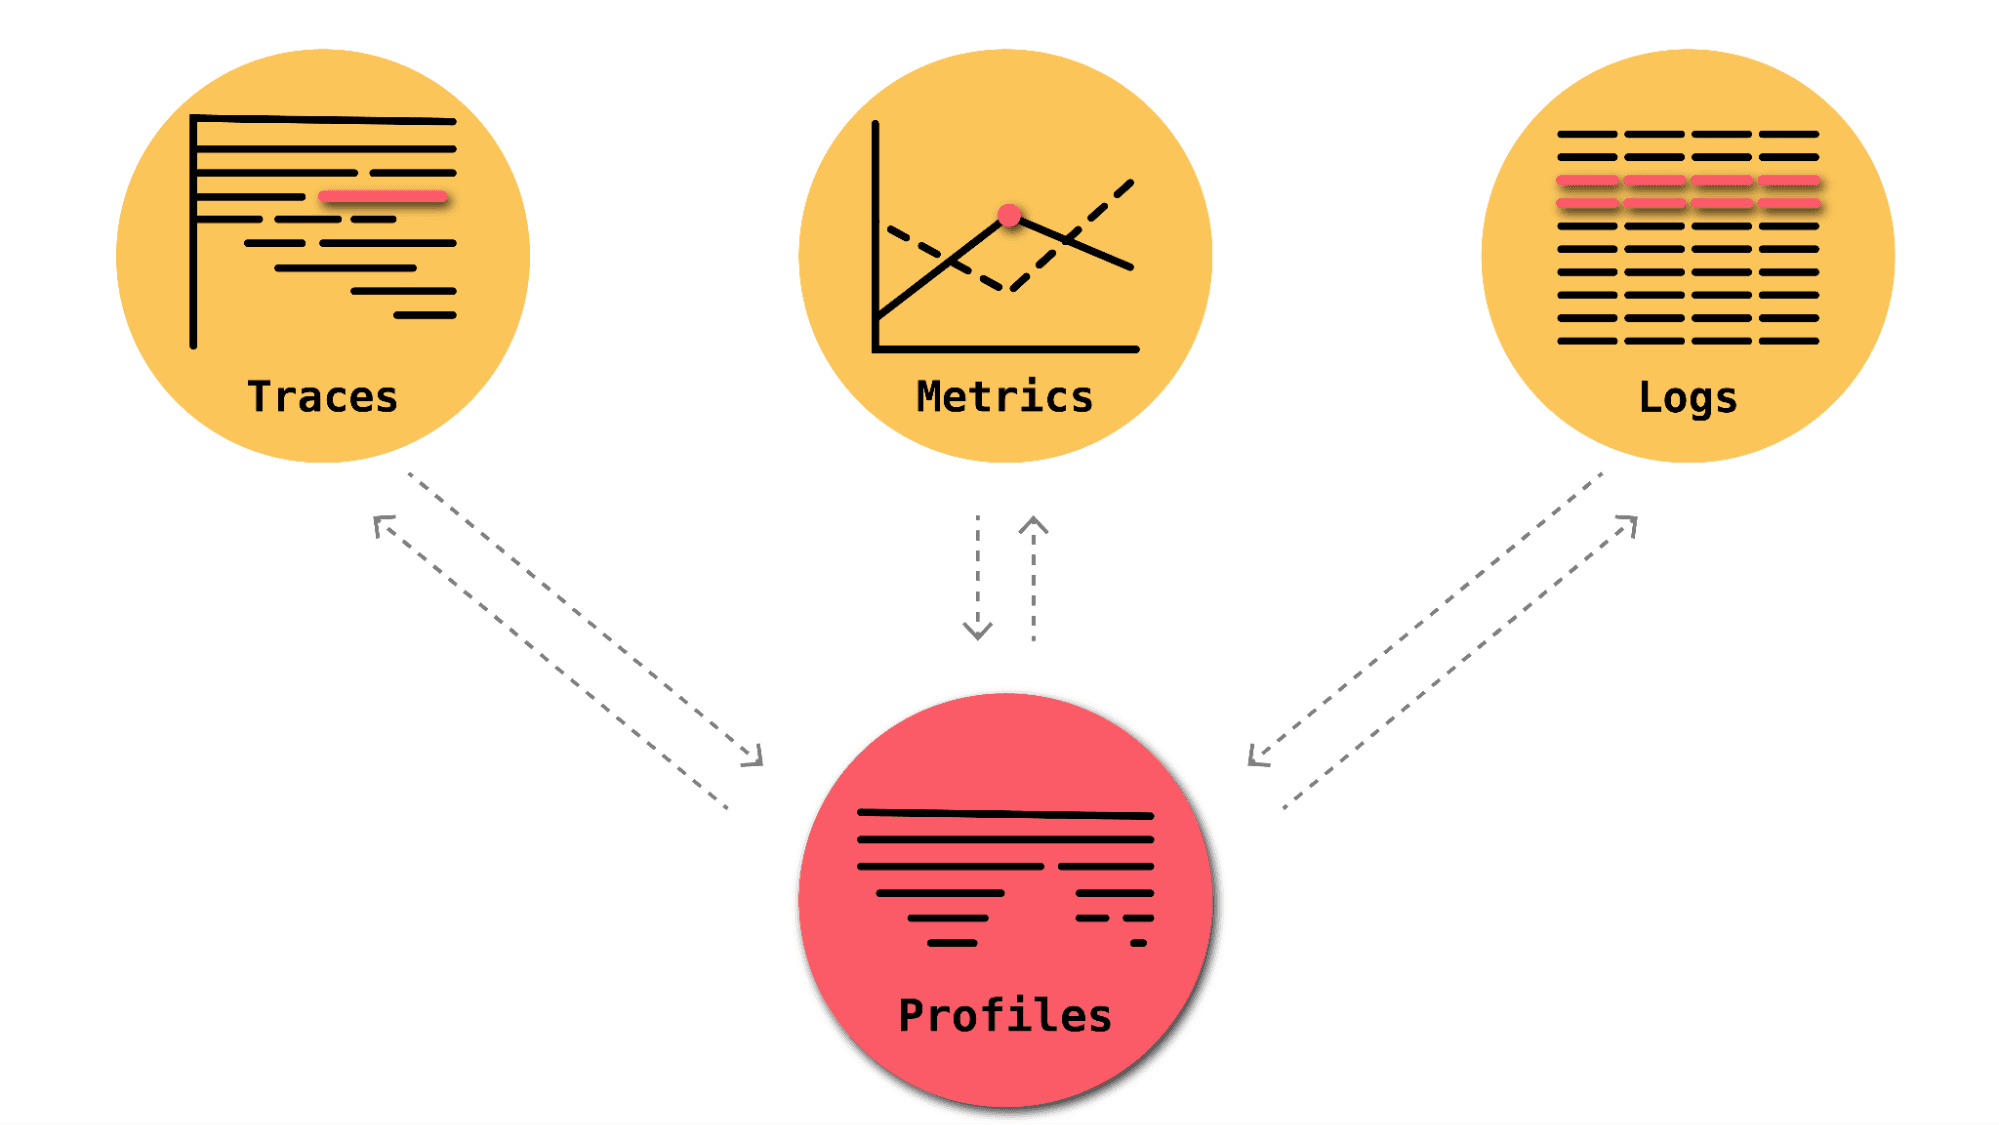
Continuous profiling brings a dynamic, granular perspective to resource usage. It offers in-depth insights into “why” a system behaves the way it does and “where” performance can be improved. It merges the realms of logs, metrics, and traces into an interconnected landscape, providing a unified, comprehensive view of your system.
Let’s look at a couple of specific examples to illustrate how correlating profiles with metrics, logs, and traces can enhance your ability to optimize infrastructure spend, simplify debugging, and improve application performance.
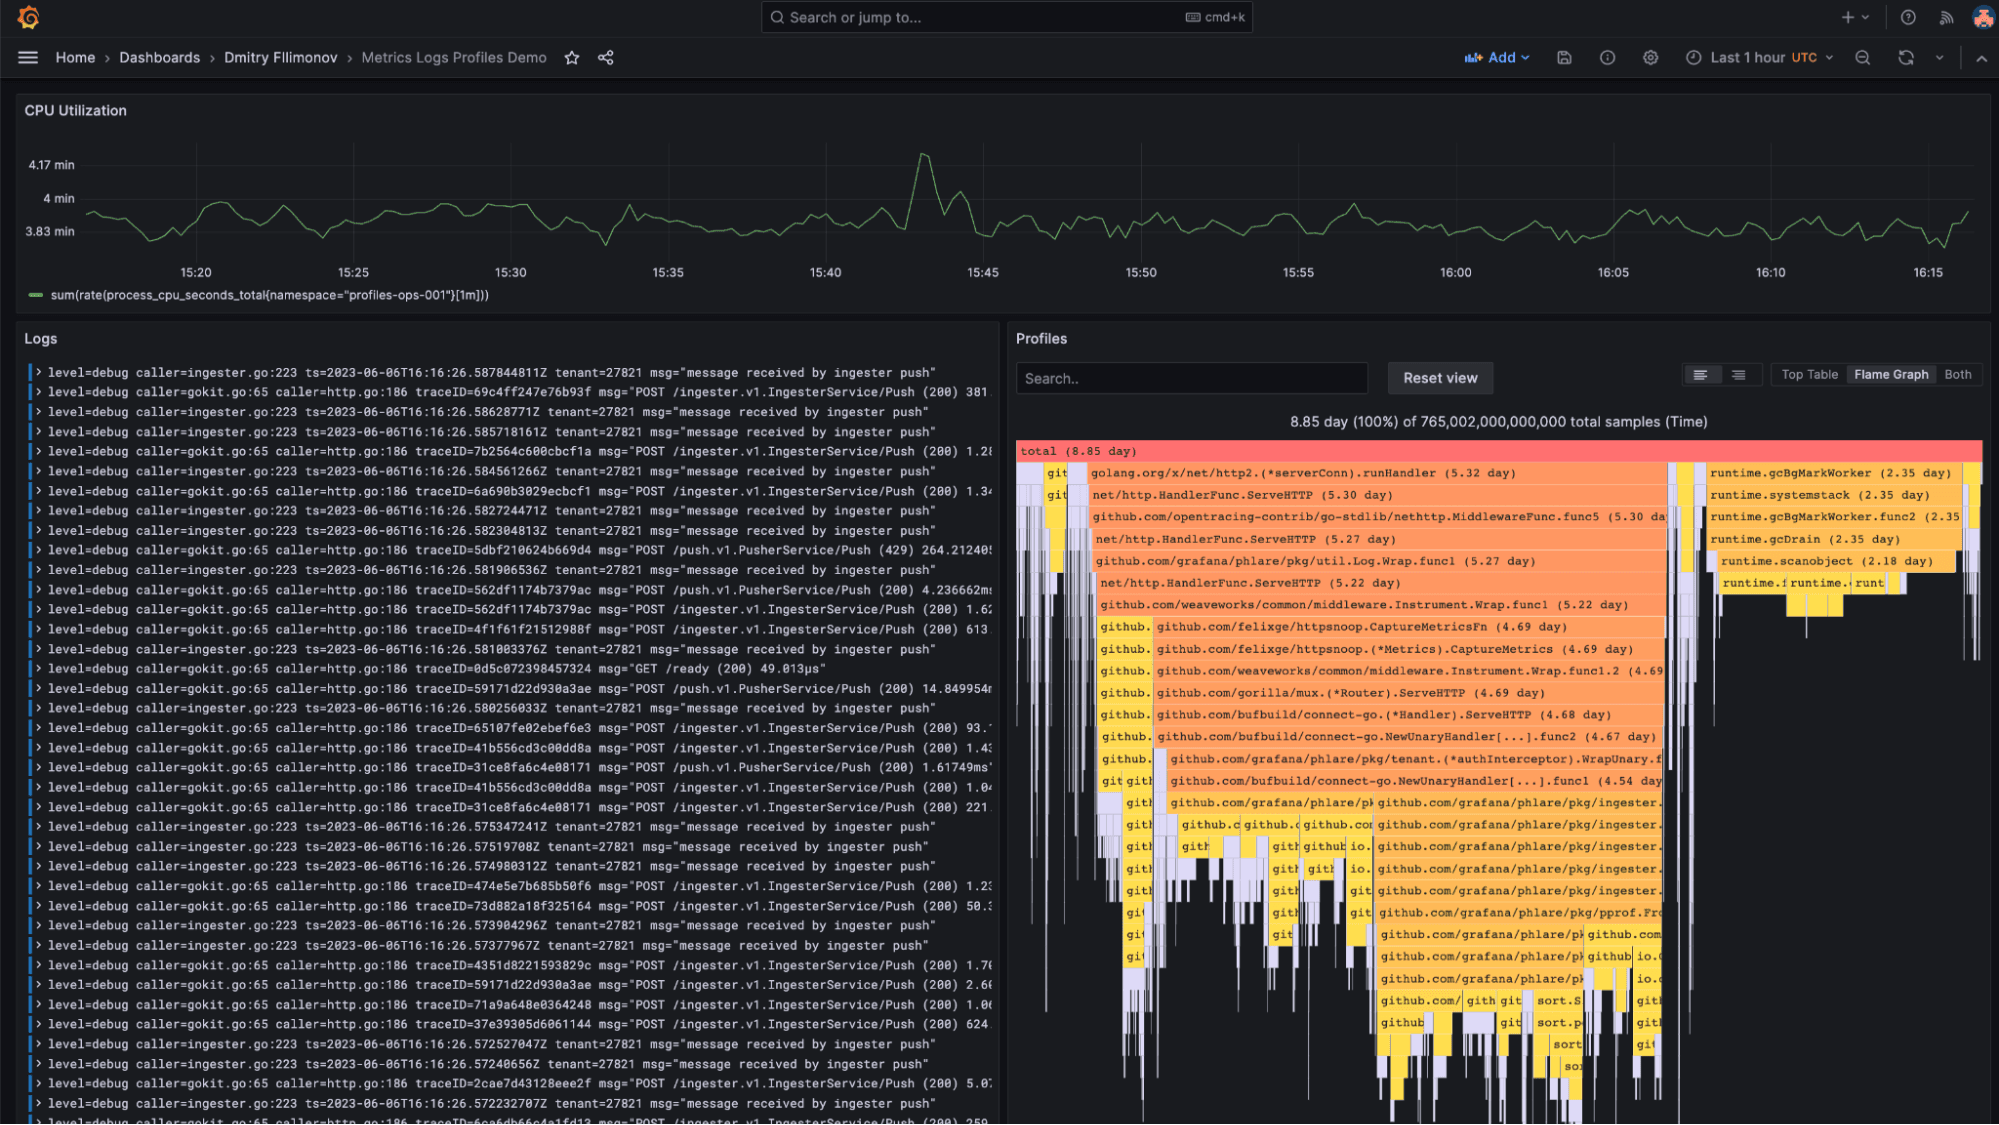
Find the root cause of CPU spikes with profiles and metrics
Imagine you’re already monitoring server CPU usage with metrics. You notice a sudden increase in CPU utilization that’s impacting your application’s performance. By adding continuous profiling to your toolkit, you can drill down to the level of specific functions in your code that are consuming CPU cycles. This correlation between metrics and profiles allows you to address the root cause at a level not possible without profiling.
Find memory inefficiencies with profiles and logs
Another scenario might be when your logs indicate frequent out of memory (OOM) errors, but the source is elusive. With continuous profiling, you can track memory allocation down to individual lines of code. This information, when viewed alongside the logs, can help you quickly identify memory leaks or inefficiencies and rectify them, significantly reducing your debugging time.
Whether it’s an issue related to CPU usage, memory errors, or something else entirely, Grafana Cloud Profiles integrated with other observability data can provide the missing link between recognizing a problem and resolving it at its core. It serves as a powerful ally, allowing you to make informed, data-driven decisions and actions.
Try continuous profiling with Grafana Cloud Profiles today
By providing multiple ways to correlate different types of observability data, Grafana Cloud Profiles enhances your ability to optimize infrastructure spend, simplify debugging, and improve application performance. It underscores the power of integrated observability, where each component complements the others to provide a cohesive and detailed view of system performance.
“Utilizing Grafana Cloud Profiles has been transformational for Zomato,” says Abhishek Jain, Software Engineer III at Zomato, an online food delivery platform.
“This tool has not only helped us identify and address complex production issues that would have otherwise been difficult to pinpoint, but it has also proven instrumental in maintaining consistent service quality. No matter how many deliveries we’re servicing, Grafana Cloud Profiles has helped to ensure we uphold our commitment to exceptional customer experiences, under any circumstance.”
— Abhishek Jain, Software Engineer III at Zomato
How to get started with Grafana Cloud Profiles
- Add profiling to your application using either:
- Grafana Agent (recommended): The agent runs alongside your application and periodically pulls the profiles from it. This mode is suitable when you want to collect profiles from existing applications without modifying their source code.
- Pyroscope language SDKs: Push profiles from your application directly to the Grafana Cloud server.
- Configure your client with your Grafana Cloud credentials.
- Refresh this page to start continuously profiling your code.
To learn more, check out our Grafana Cloud Profiles documentation or reach out to Grafana Labs support.
If you’re not already using Grafana Cloud, we have a generous forever-free tier that includes 50GB of profiles, along with 10k metrics, 50GB logs, and 50GB traces for 3 active monthly users. Sign up for free today!

