What's new in distributed trace visualization in Grafana
At Grafana Labs, we are constantly improving our feature set, and tracing is no different.
Traces are often overshadowed by logs and metrics, but they’re a pillar of observability for a reason. Used correctly, organizations that can quickly and successfully follow a chain of events through a system gain a more holistic view of their systems and are better equipped to find and fix issues faster. Moreover, the adoption of distributed tracing can be a key piece of a mature observability strategy.
However, some teams find it hard to get started with distributed tracing, so we’ve been focused on making it easier to find the information you need and filter out the information you don’t. In this blog post, I’ll go over a few improvements we have recently made in Grafana that do just that.
Improved trace view header
The goal with the new trace view header is to make it easier to view information about your trace at a glance, allowing you to quickly scan for information such as your service, operation, and relevant tags.
Primary information such as the service and operation name is now bigger and bolder than secondary information such as the start time. Plus, the method and status code have been placed into tags, where the color of the status code tag is determined by its value — e.g., error codes will appear in red. We have also moved the trace ID to a handy button that copies the trace ID to your clipboard when clicked.

We added an export button so you can easily export your trace to a JSON file, which can be shared or stored for reference and uploaded later. And we added another button that allows users to send us feedback through a simple three-question survey that asks:
- How useful do you find our traces offering overall?
- What features are missing or could be improved?
- Would you like to chat with us to share your thoughts on what could be improved? If so, please leave your email.
The new trace view header is available behind a feature toggle (newTraceViewHeader)in Grafana 10.0, and it will go live in Grafana 10.1.
New: Span filtering for easier search
Span filtering allows you to easily find spans within your traces that are of particular interest. With span filtering, you can easily search for spans from a particular service or operation, or spans that contain certain tags.
Perhaps you want to better understand why a particular request is taking longer than usual to complete; simply enter the desired duration to highlight results that match your search.
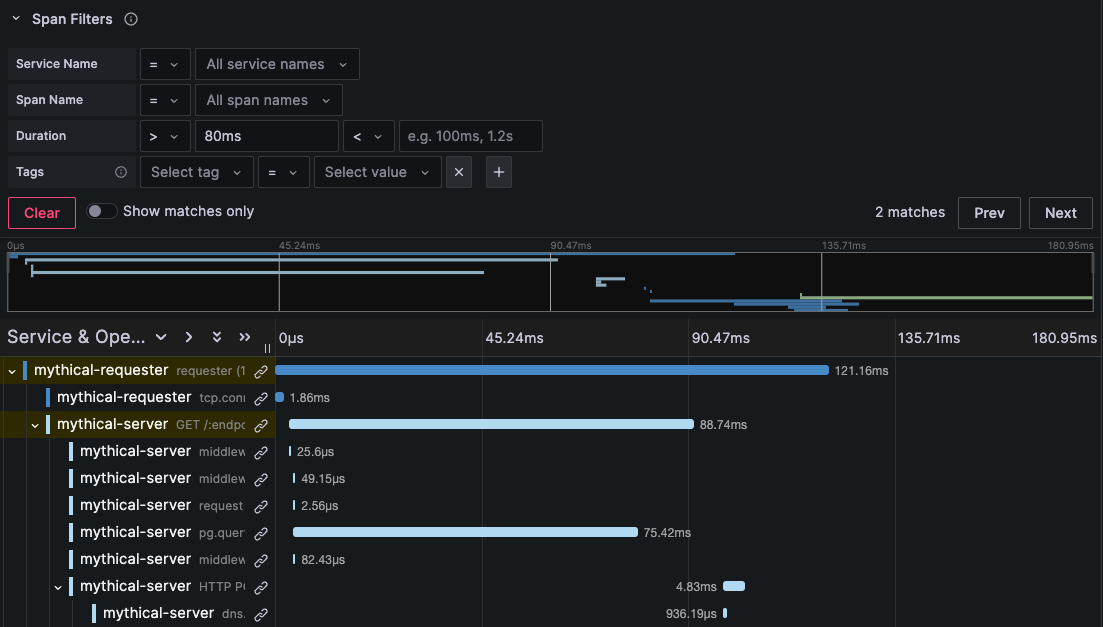
Even if you just want to find slow-performing spans to make some general improvements, span filtering has you covered!
With span filtering, you can also search for spans that don’t match a certain filter. For example, you can use it to search for spans that do not contain a certain tag. On top of that, you can search for spans that contain a particular tag key, such as cluster.
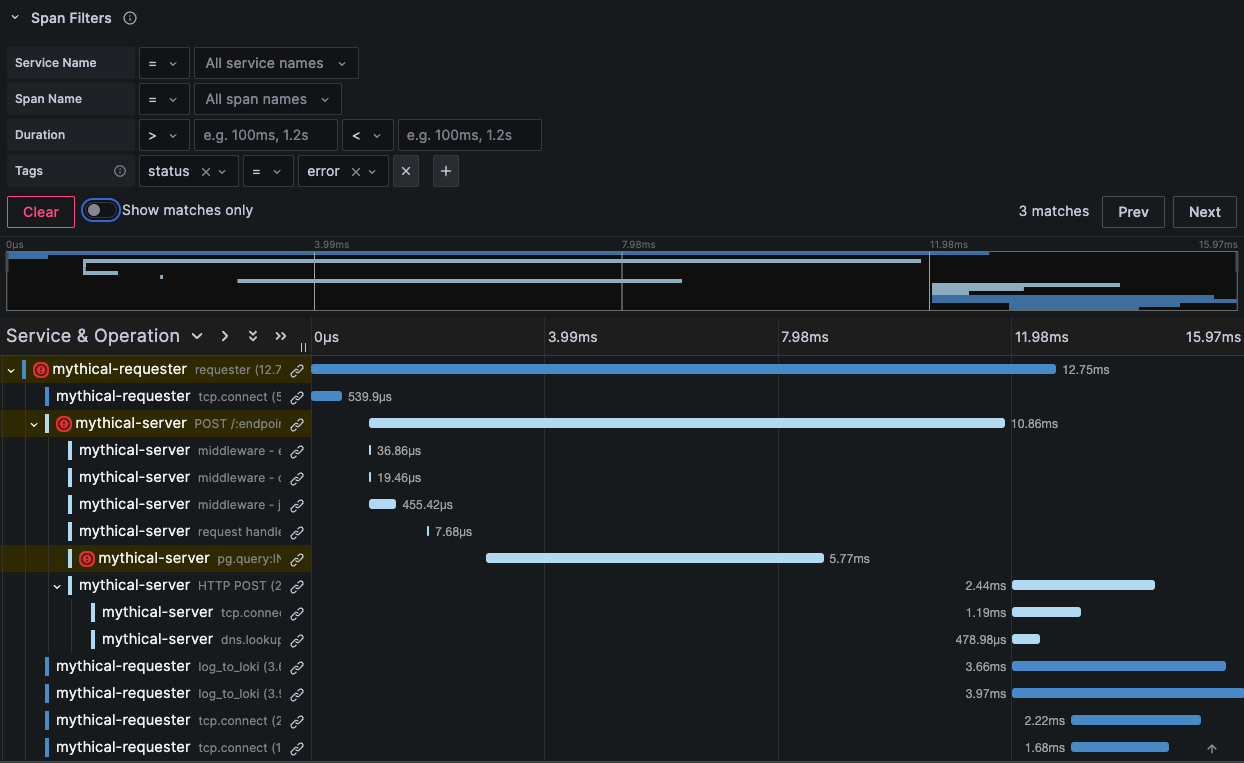
Similar to the new trace view header, span filtering is available behind a feature toggle (newTraceViewHeader) in Grafana 10.0, and it will go live in Grafana 10.1.
Show matches only (via span filtering)
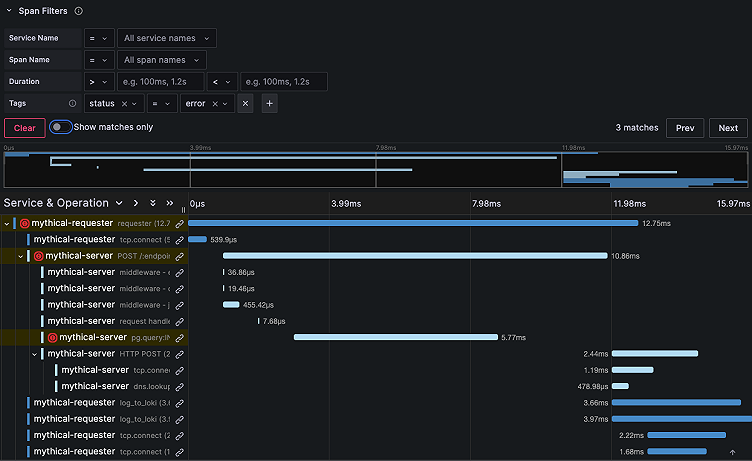
Let’s say you have some kind of error in one of your services, and you want to quickly find which service (or services) the error exists in. Selecting a span status of “error” in the tags section will highlight all spans with an error. (We also added a red error icon to the left of the span to help errors stand out from the rest, which is especially helpful if you are scanning through your trace.)
However, what if you have thousands of spans within your trace? And what if the span filters tell you there are several matches for your applied filter, but you can’t see any of the results in the trace view because there are so many spans?
Well, we have added a handy button called “Show matches only,” which does just that. Flip that switch and your entire trace view will be reduced to only show spans that exactly match your filter. This operation allows you to vastly reduce the cognitive load, helping you go from trying to understand what’s going on within thousands of spans to knowing what’s going on in a select few spans.
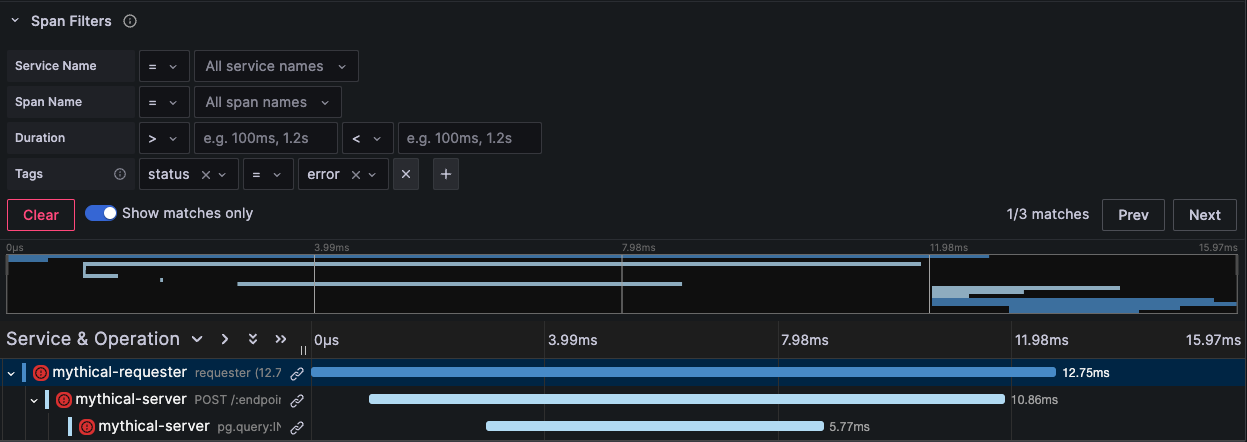
The toggle can be applied to any filter or set of filters you select in the span filters section. The more filters you apply, the fewer matches you will have. So, you can continue to apply filters until you have narrowed down your resulting spans to the select few you are most interested in.
All in all, the goal behind span filtering is to allow you to drill down into your traces to find the most interesting information related to your specific use case.
Config editor improvements
Along with improving our trace view header and span filtering experience, we have been hard at work improving our configuration editor for Tempo, Jaeger, and Zipkin — the built-in tracing data sources.
We moved settings into collapsible accordion sections to better organize what you can configure. Our goal here is to surface the more important settings in their own section — for example, “Trace to logs” — while also somewhat hiding other settings that are perhaps less important when you initially set up your data source.
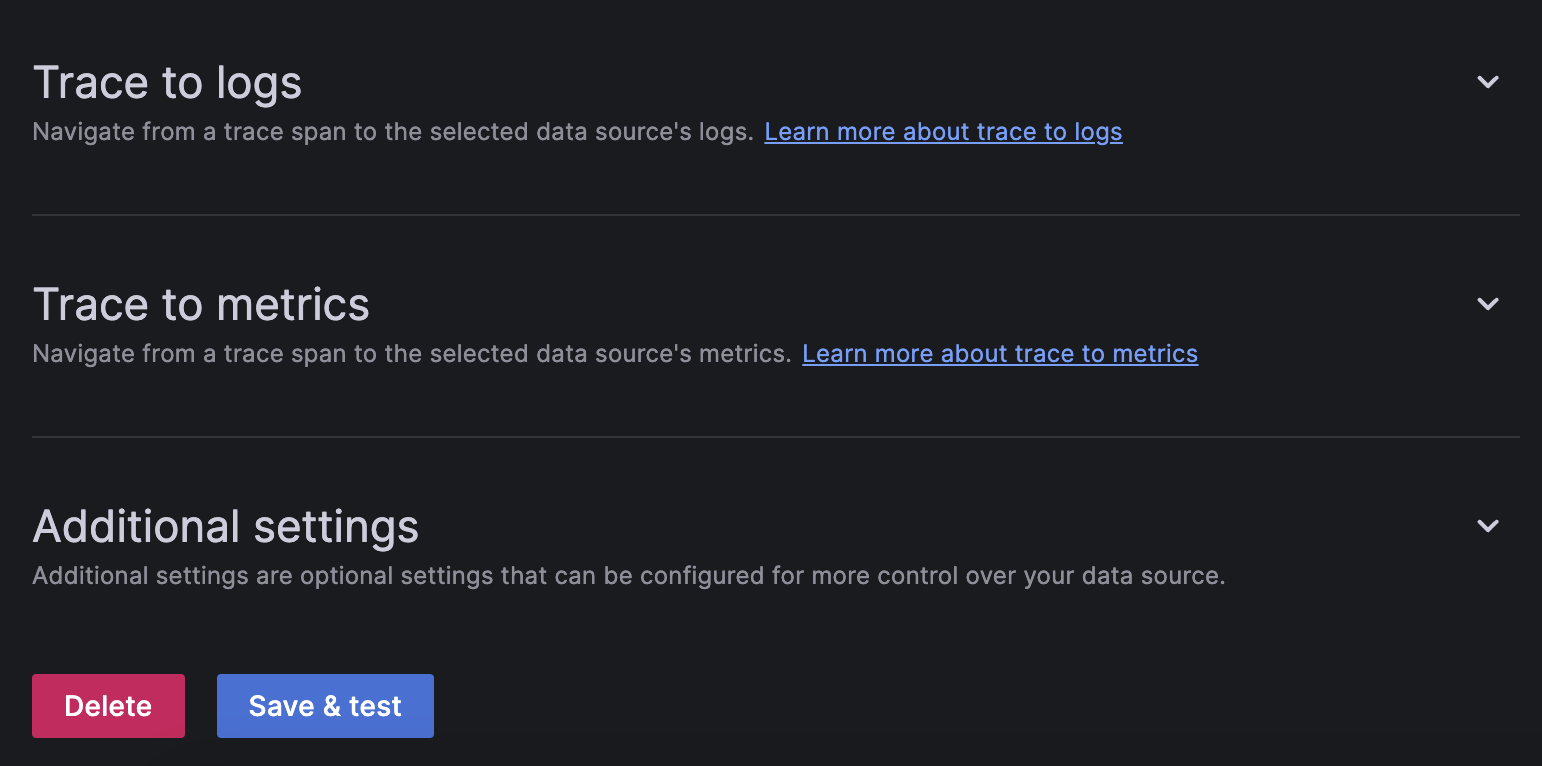
We’ve also added more context within each section. From the image above and below, you can see that each section has its own description. Each settings group also has its own description to clarify its purpose. These tooltips should alleviate confusion where necessary.
And in places where you might need even more information about the purpose of an individual settings group, or where you would like to learn more about the setting, we have included links directly to the documentation. These links can provide detailed descriptions, examples, or links to further documentation.
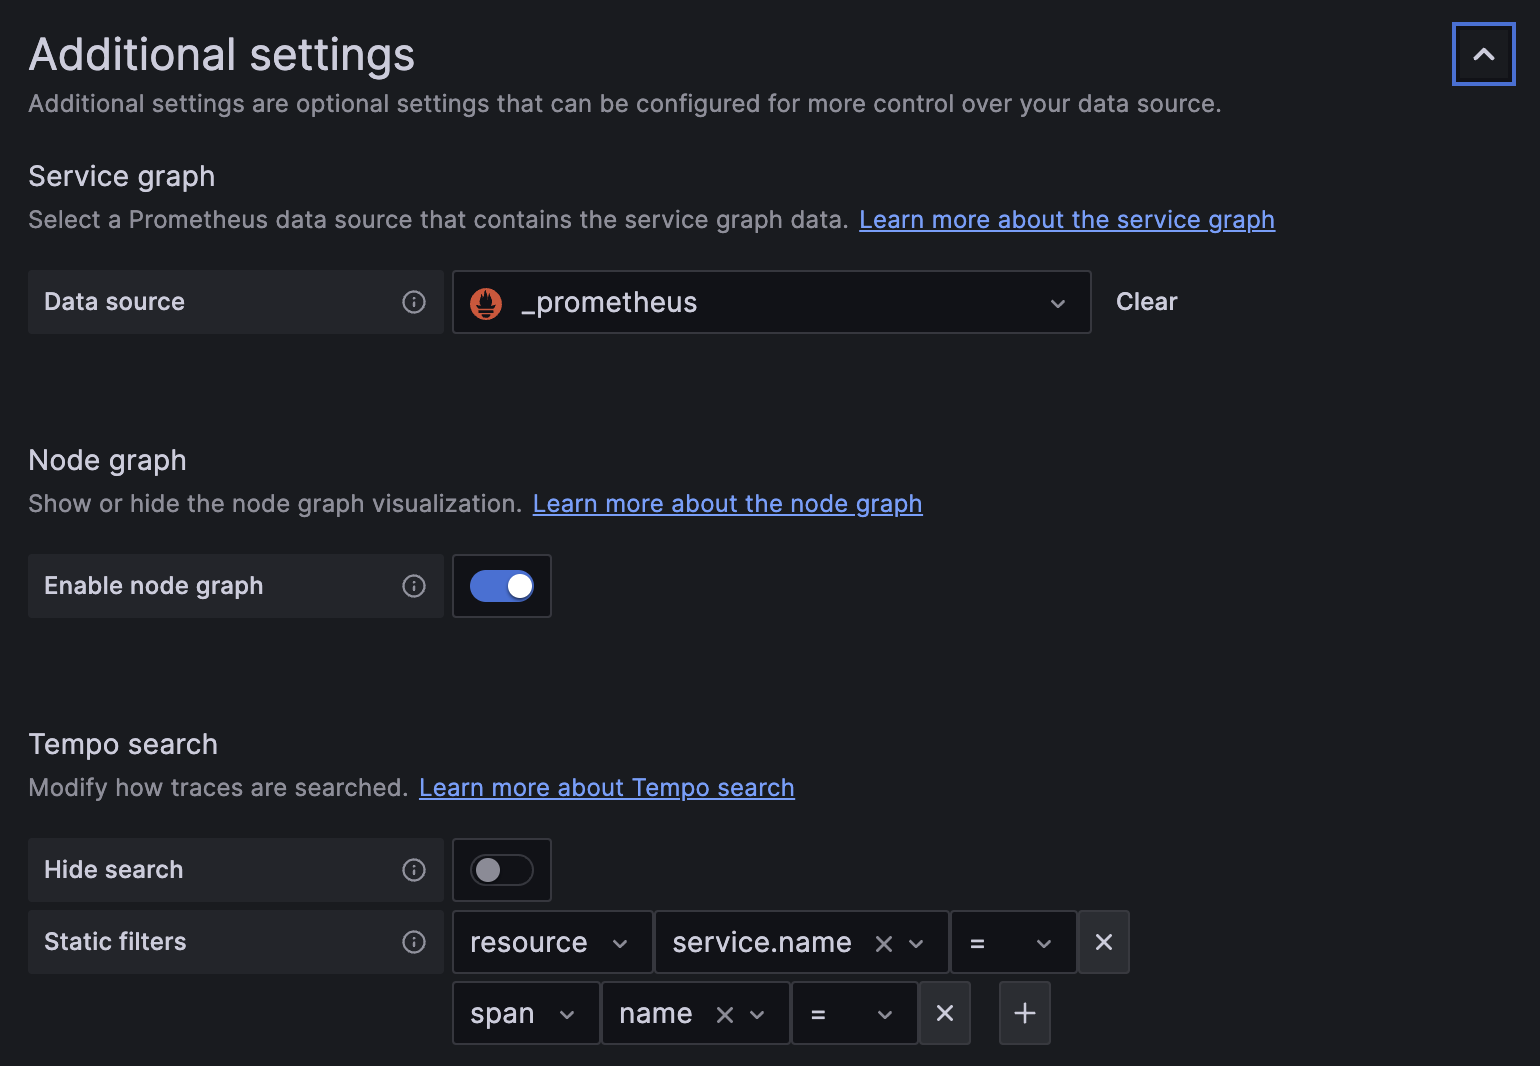
We’ve been working on these improvements to the config editor since Grafana 9.5, and some of the more recent changes discussed here will be available in Grafana 10.1
Documentation improvements
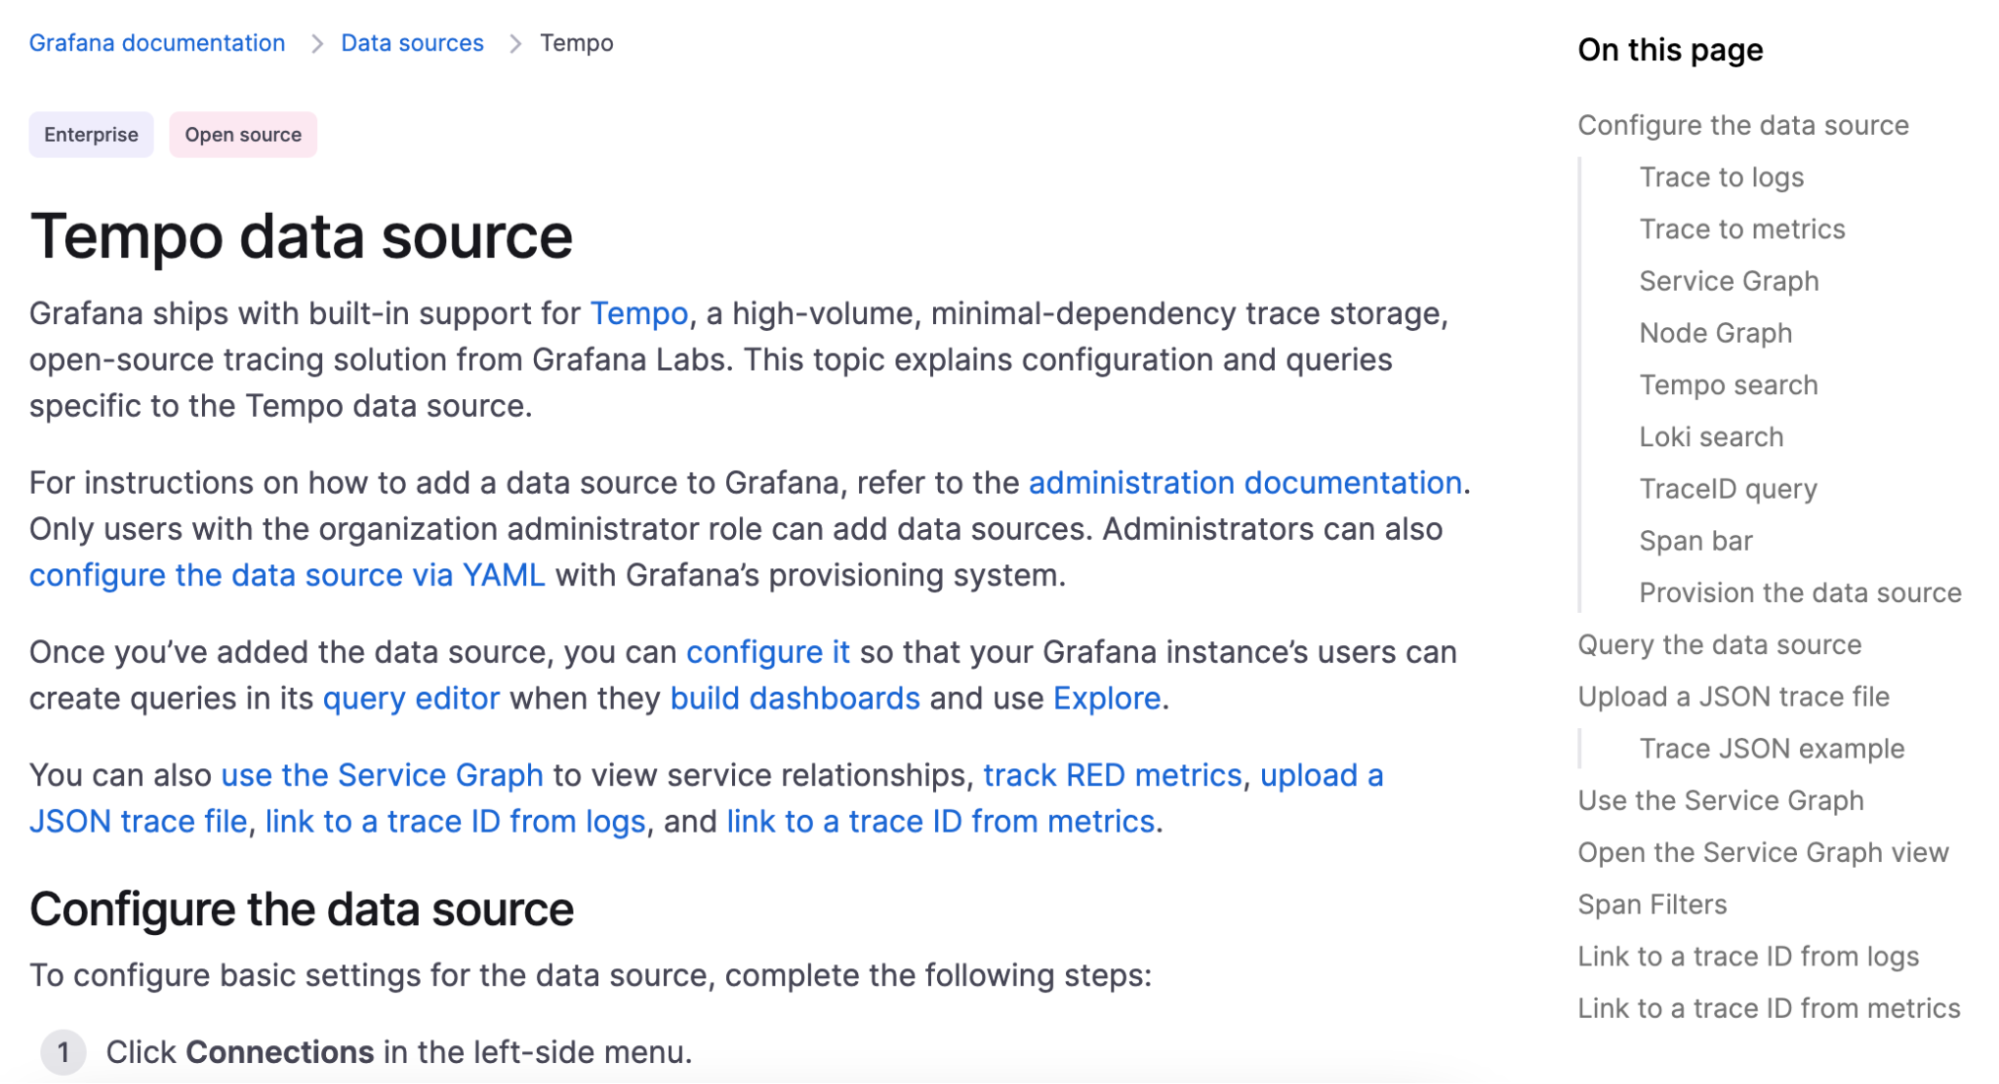
Our Tempo, Jaeger, and Zipkin data source documentation has been vastly improved in recent months.
For example, section titles are now more concise, and the overall content has been simplified. We’ve gone through each section throughout those data source documents and updated the core text and content where necessary to better reflect the current state of those data sources, and we’ve made updates to examples and provisioning configurations.
Share your feedback
With these changes, all of which will be fully available in Grafana 10.1, it should be easier and faster than ever to get value out of your traces, helping you better understand and configure your tracing data source and search for relevant spans when working with the trace view.
If you want to provide feedback on these updates or if you have a feature request, please feel free to reach out in our community Slack channel, the feedback form in the trace view header, or via opening an issue or feature request in GitHub.
Grafana Cloud is the easiest way to get started with metrics, logs, traces, and dashboards. We recently added new features to our generous forever-free tier, including access to all Enterprise plugins for three users. Plus there are plans for every use case. Sign up for free now!

