How to monitor your feature flags with LaunchDarkly and Grafana
This blog post was co-authored by LaunchDarkly Product Manager Tim Cook and Grafana Labs Director of Business Development, Global Ecosystem & ISV Partnerships, Logan Smith.
Feature management is an emerging set of tools and techniques for developing and testing software based around feature flags. It’s intended to increase productivity and performance, as well as improve software quality. Of course, you’ll also need to keep tabs on all those feature flags, so it only makes sense to pair feature management with observability for a more holistic view of your software development cycles.
To help with managing and maintaining the rapid development of your products, we are excited to announce that Grafana Labs worked with LaunchDarkly, a feature flag and toggle management platform, to develop an integration that helps seamlessly connect your LaunchDarkly data to Grafana.
In this blog, we’ll take a closer look at this new LaunchDarkly integration and show you how to get started so you can start monitoring your feature management framework today.
What is LaunchDarkly?
LaunchDarkly is a feature management platform that helps developers innovate on new features faster while protecting them with the ability to instantly rewind when things go wrong. Developers can also target product experiences to any customer segment and maximize the business impact of every feature. Used by 20% of the Fortune 500, LaunchDarkly can help companies gradually roll out new application components, escaping nightmare “big bang” technology migrations.
Why Grafana + LaunchDarkly?
The LaunchDarkly integration for Grafana Cloud brings together the strengths of these two powerful platforms, so developers and teams can combine feature management with observability data to gain a deeper level of visibility into their release processes.

Here’s what you can expect from this LaunchDarkly integration:
- Real-time feature flag monitoring. Gain real-time visibility into the performance and usage of your feature flags directly within your Grafana dashboards.
- Data-driven decision-making. Leverage the rich visualization capabilities of Grafana to correlate feature flag data with other relevant metrics, logs, or events. Analyze how feature releases impact user engagement, conversion rates, or any other key performance indicators, empowering you to make informed decisions based on data.
- Streamlined collaboration. Take advantage of a unified platform for both feature management and observability. Share insights, dashboards, and reports with stakeholders across your organization.
- Enhanced troubleshooting. With LaunchDarkly’s Grafana integration, you can easily investigate and troubleshoot feature-related issues. Correlate performance metrics with feature releases, and identify any anomalies or regressions that may impact user experiences.
How to start monitoring LaunchDarkly feature flags with Grafana
To begin using LaunchDarkly with Grafana, follow these simple steps:
- Log into your Grafana Cloud. You’ll also need a Grafana service account with the Annotation writer role and a corresponding service account token. If you don’t have a Grafana Cloud account, you can sign up for a forever-free account today.
- In LaunchDarkly, install the Grafana integration. Visit the LaunchDarkly documentation to learn how to install and configure. Please note: This feature is only available for Pro or Enterprise LaunchDarkly customers.
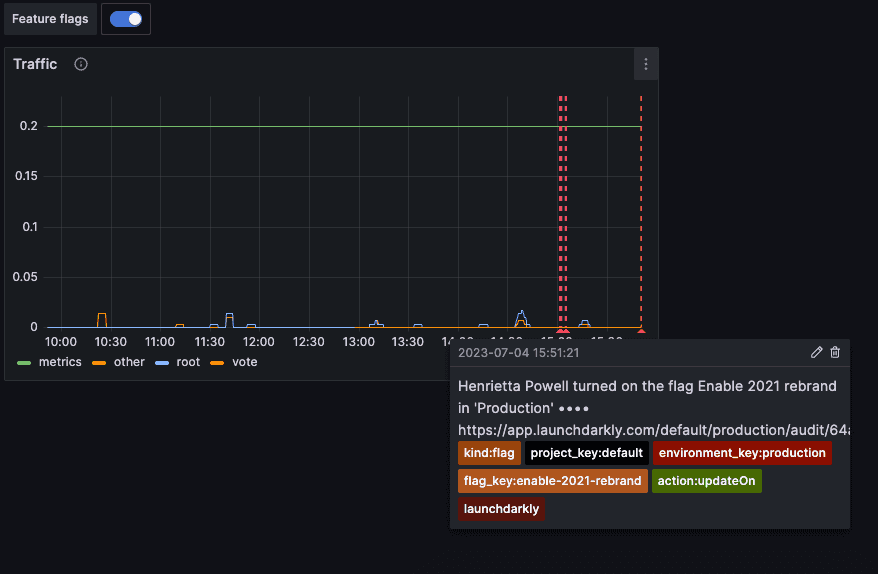
LaunchDarkly’s Grafana integration works by sending annotation events to Grafana with event-specific tags via the Grafana annotations API. Annotations provide a way to mark points on a visualization with events. They are visualized as vertical lines and icons on graph panels (for example, time series, state timeline, or candlestick). When you hover over an annotation, you will see an event description and event tags. The text field can also include links to other systems with more detail.
Once you’ve set up the integration in LaunchDarkly, you can start connecting Grafana to your preferred data sources. This is where Grafana Labs really shines. Grafana Cloud connects to hundreds of the most popular data sources, including databases, log management systems, or metrics collectors, helping you realize the full potential of your observability data within your feature management workflows.
LaunchDarkly will then send events to Grafana for changes made to any feature flag, environment, or project. If you want to limit the scope of what you’re monitoring, you can also use filters in LaunchDarkly to restrict which data is sent to Grafana.
From there, you can create customized Grafana dashboards that combine feature flag data from LaunchDarkly with other relevant metrics, logs, or events. You can also share your dashboards, reports, and insights with your team and stakeholders, which can encourage collaboration to improve feature releases, optimize user experiences, and drive continuous improvement.
We hope this integration proves valuable to our shared users. Give it a try and let us know what you think! If you have any questions or would like to share any feedback, you can find us in our Grafana Labs Community Slack in the #integrations channel.


