
How Grafana query caching and Amazon Timestream make dashboards faster and more cost-effective
This blog post was co-authored by Igor Shvartser, Senior Technical Product Manager at Amazon Timestream, and Michael Mandrus, Senior Software Engineer at Grafana Labs. Grafana Labs Senior Software Engineers Stephanie Hingtgen and Kevin Minehart also helped with the content.
For many organizations, performant and cost-effective application monitoring and analytics are a requirement for mission-critical applications. With this requirement comes the increasing use of operational dashboards and visualizations, especially during activity spikes often found in DevOps, Security, and IoT applications, to name a few. Often, these dashboards are viewed by numerous analysts simultaneously and reloaded many times in a short period. This heavy use may lead to unnecessary spikes in cost and query latencies that slow teams down. In more time-sensitive situations, it’s vital that time is not lost waiting for a dashboard to load.
In this blog post, we discuss how you can use Amazon Timestream, a fast, serverless, and secure time series database and analytics service that can scale to process trillions of time series events per day, together with query caching in Grafana, to reduce dashboard load times, lower query costs, and decrease the likelihood that your query requests will be throttled.
Why Grafana and Amazon Timestream?
Grafana provides a database query caching feature (available in Grafana Cloud, including our generous free-forever tier, and Grafana Enterprise) that supplements your database by removing unnecessary pressure from it in the form of frequently accessed read data. It creates cache keys using a data source instance, a query, and a time range. When a panel is loaded, Grafana first checks a local cache for the requested data and, if found, returns it immediately. If not found, Grafana executes the query against the data source, then stores the results in the local cache. This means that while the initial load of a dashboard will take a typical amount of time, subsequent loads with similar time ranges will be nearly instantaneous. This is achieved by rounding time ranges to the nearest interval, increasing the likelihood of cache hits. You can configure query caching and its time-to-live (TTL) per data source instance.
Amazon Timestream is an AWS time series database that includes built-in analytics to help identify trends and patterns in your time series data, and integrates with other commonly used AWS services such as IAM, Kinesis, and SageMaker. Grafana conveniently integrates with Timestream through the Amazon Timestream plugin, which is available in Grafana OSS, Grafana Cloud, and Grafana Enterprise. Customers across a broad range of industry verticals have adopted Timestream with Grafana to derive real-time insights from dashboards, monitor and alert on critical business applications, and analyze millions of real-time events across websites and applications. Using Grafana with Timestream enables you to build operational dashboards and load results from the cache rather than the source Timestream table.
Getting started with Amazon Timestream and Grafana
To get started with Timestream, visit the Getting Started page on the AWS website, which provides a tutorial and sample applications. The tutorial shows you how to create a database populated with sample data sets and run sample queries. The fully functional sample application shows you how to create a database and table, populate the table with sample data, and run sample queries. You can also go directly to the AWS Console or use the AWS Command Line Interface (CLI) or AWS SDKs.
You can also try Amazon Timestream with a 1-month free trial when you use Timestream for the first time. The Timestream Free Tier gives you the opportunity to experiment with and adopt Timestream at zero cost for a duration of one month, while adhering to specific usage quotas.
Timestream and Grafana query caching walk-through
Now we will walk you through configuring and using the Amazon Timestream plugin with database caching. For more detailed instructions on setting up a Timestream database and querying it from Grafana, please see this Timestream developer guide.
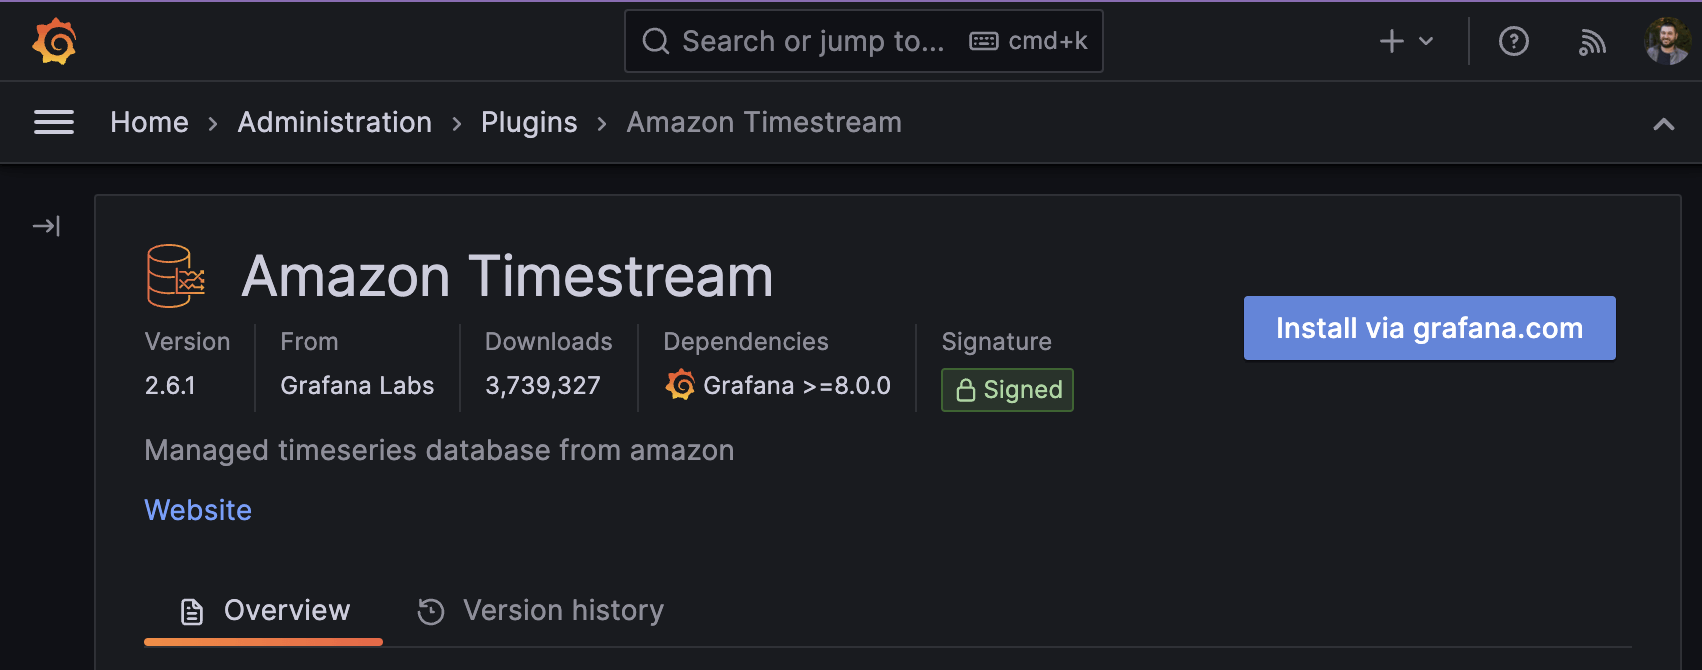
- Install the Amazon Timestream plugin per the instructions here.
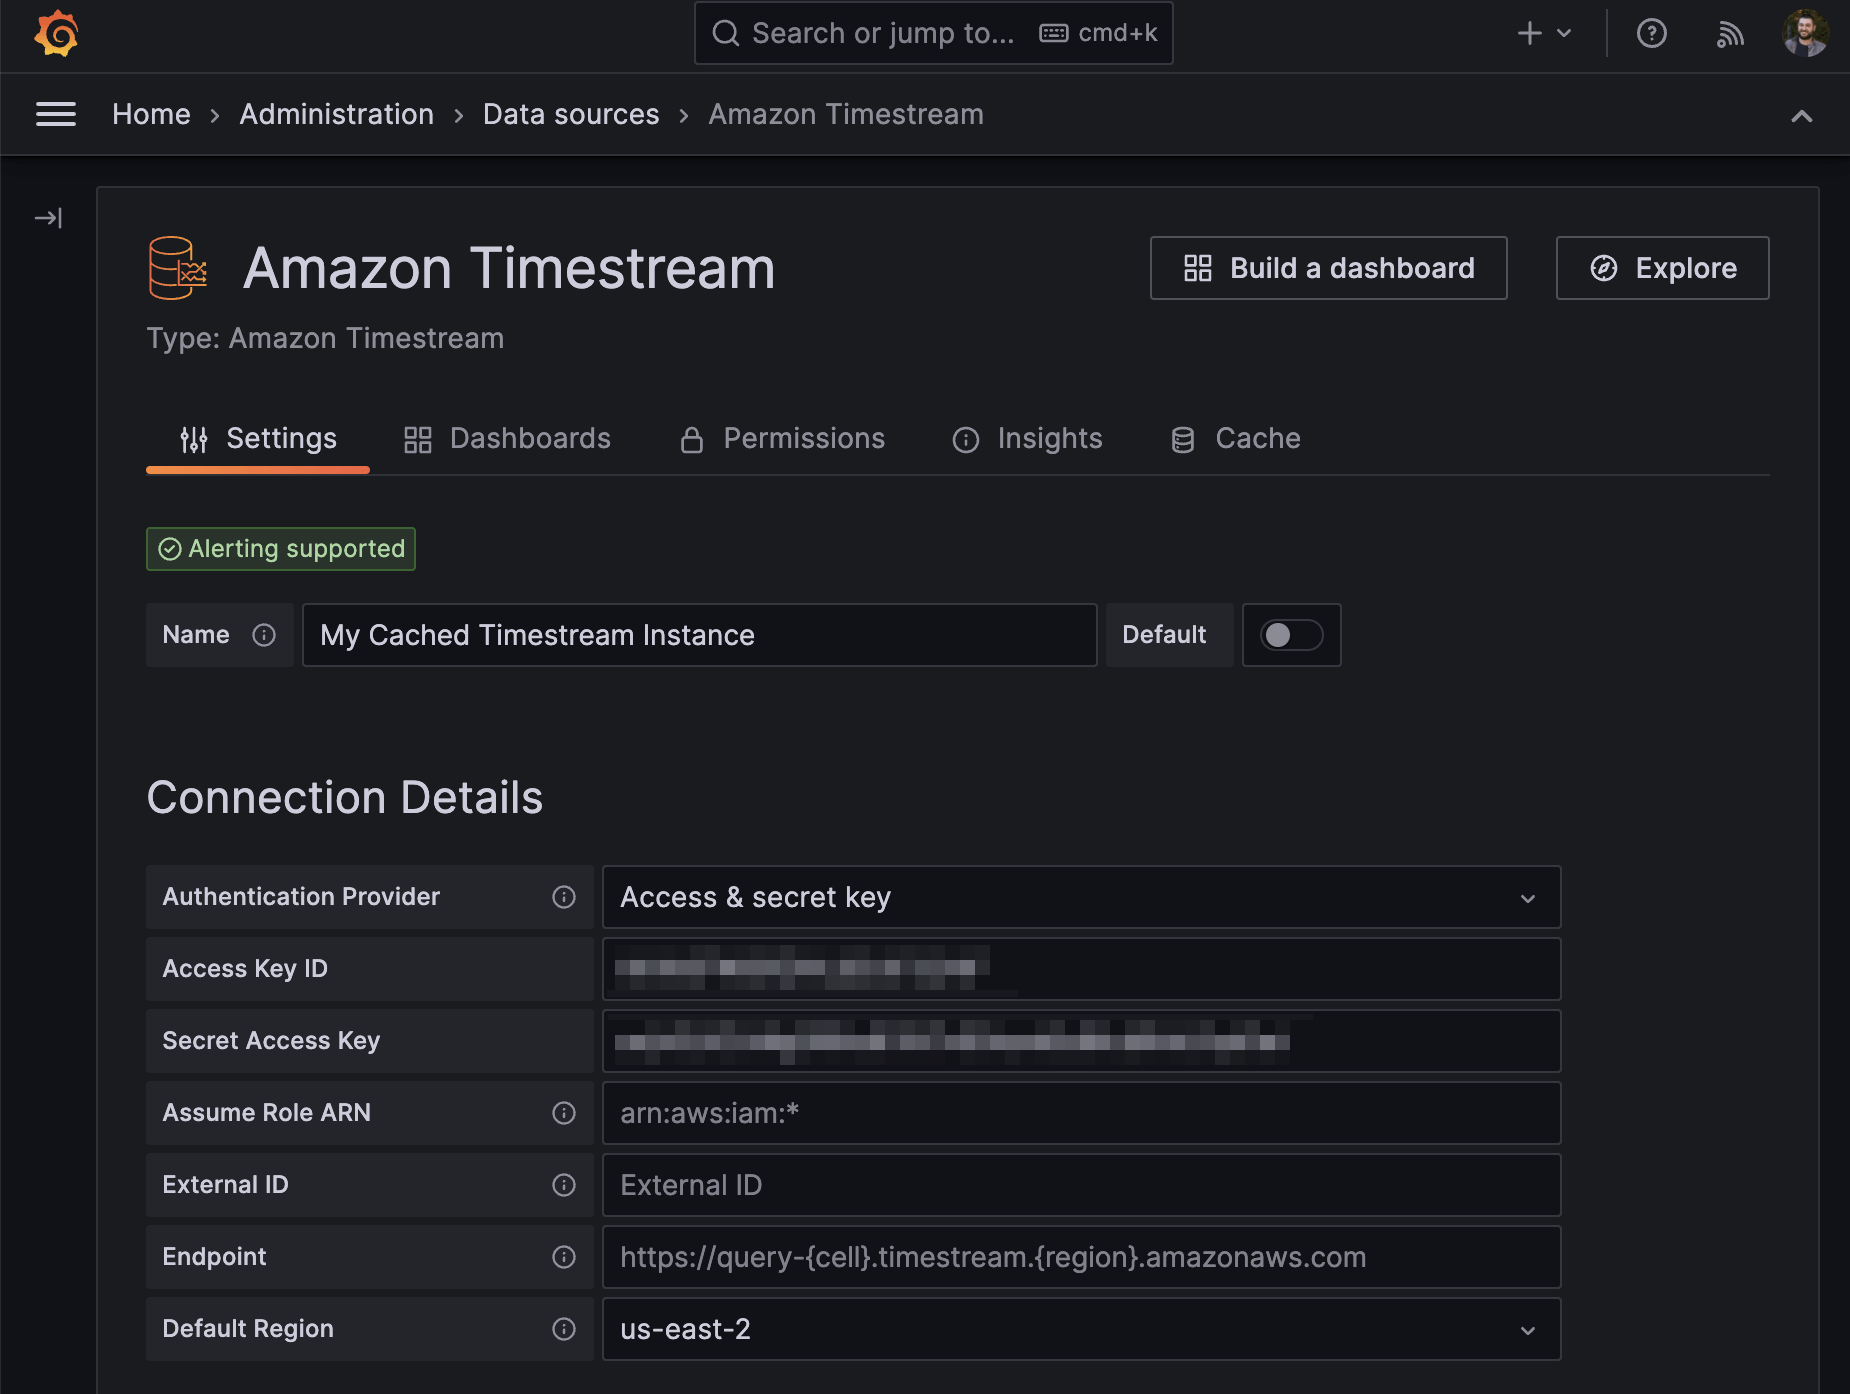
- Add a new data source.

- Enter the connection details.
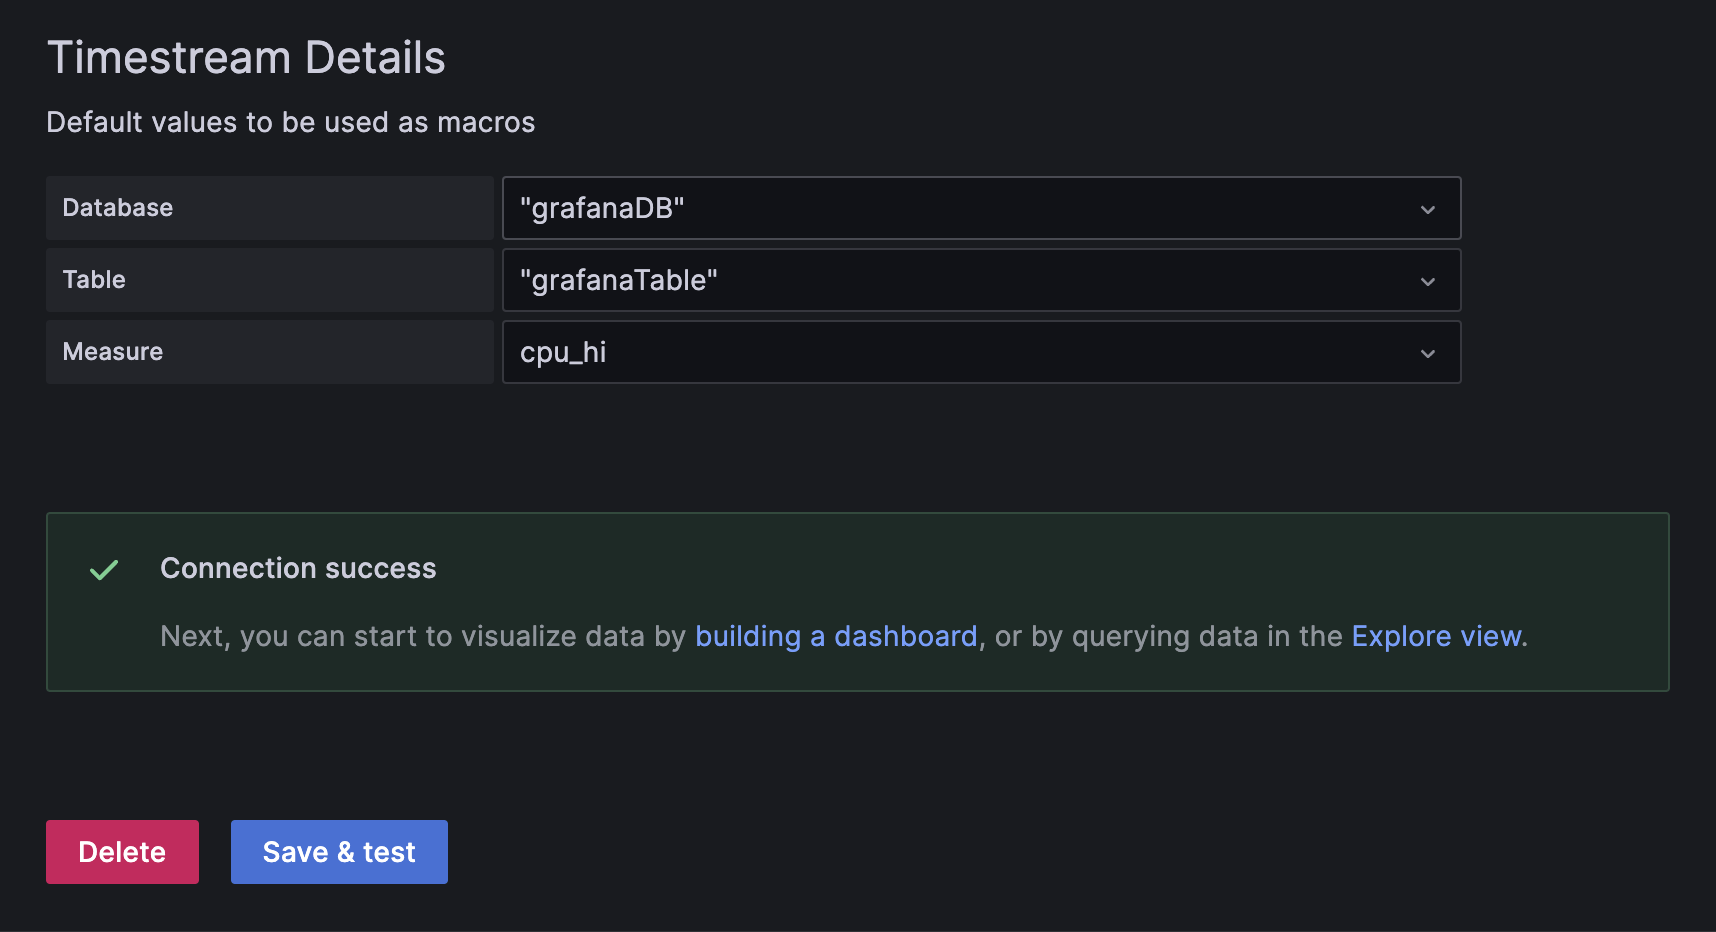
- Enter additional details and click Save & test to verify connection.
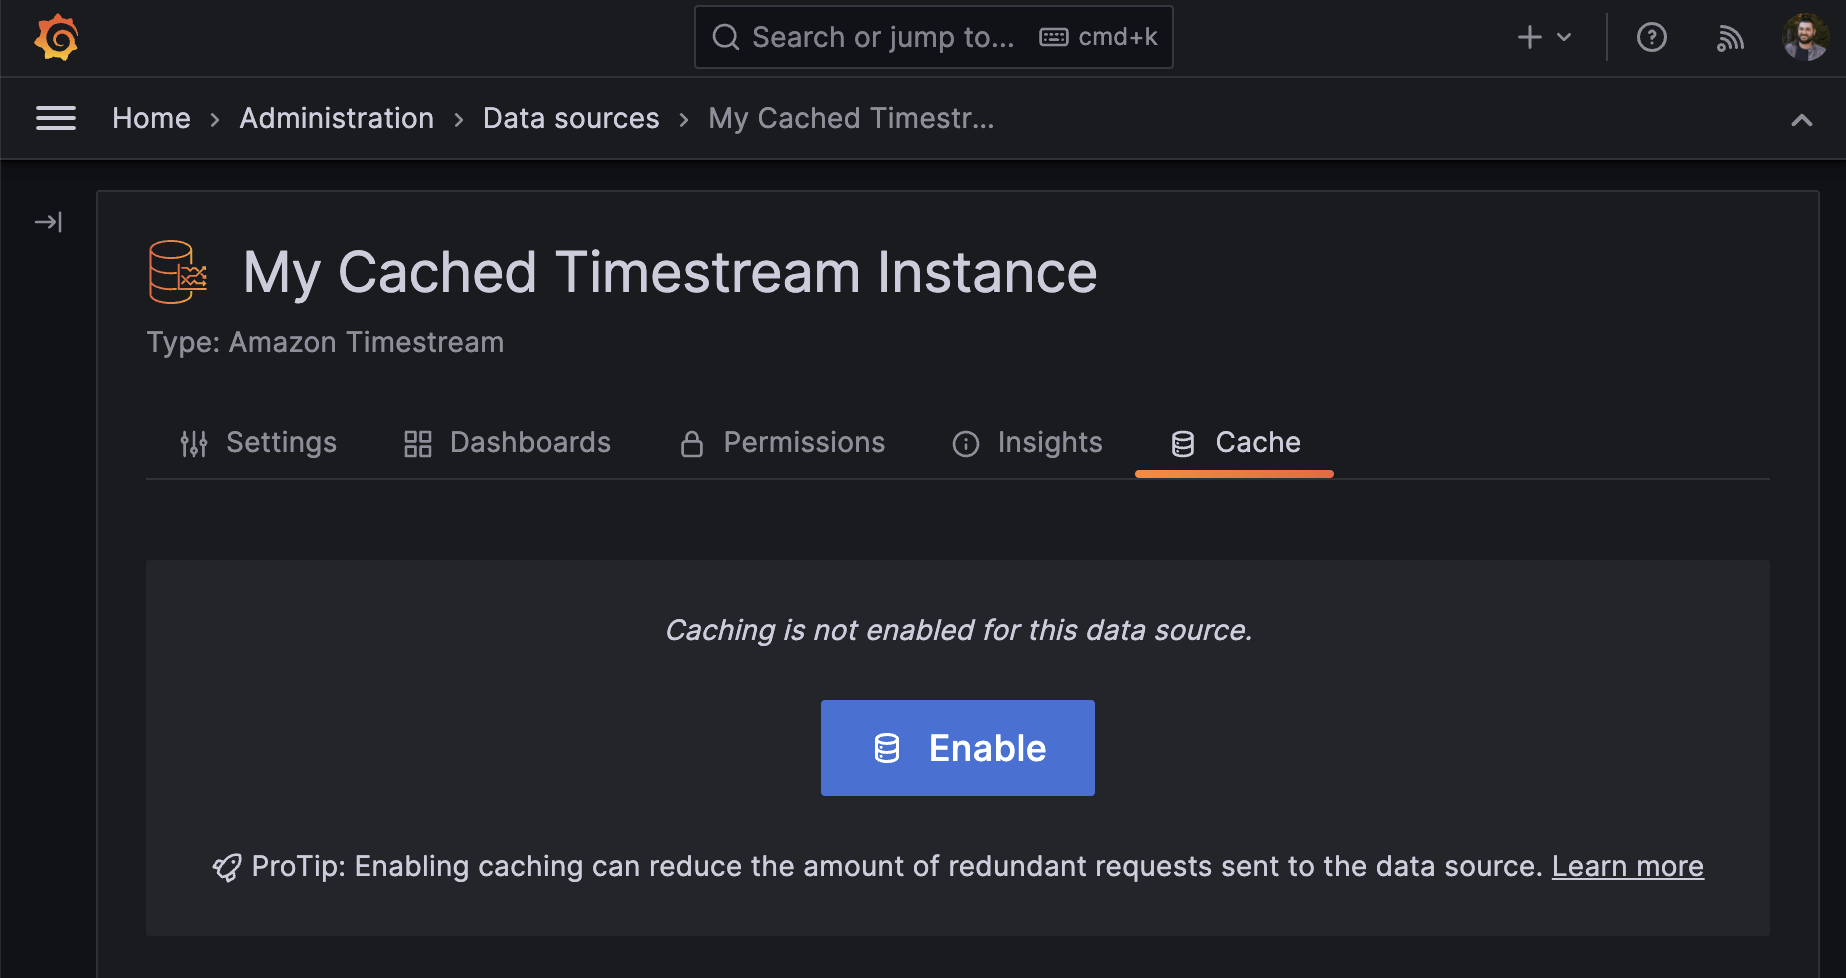
- Switch to the Cache tab and click Enable.
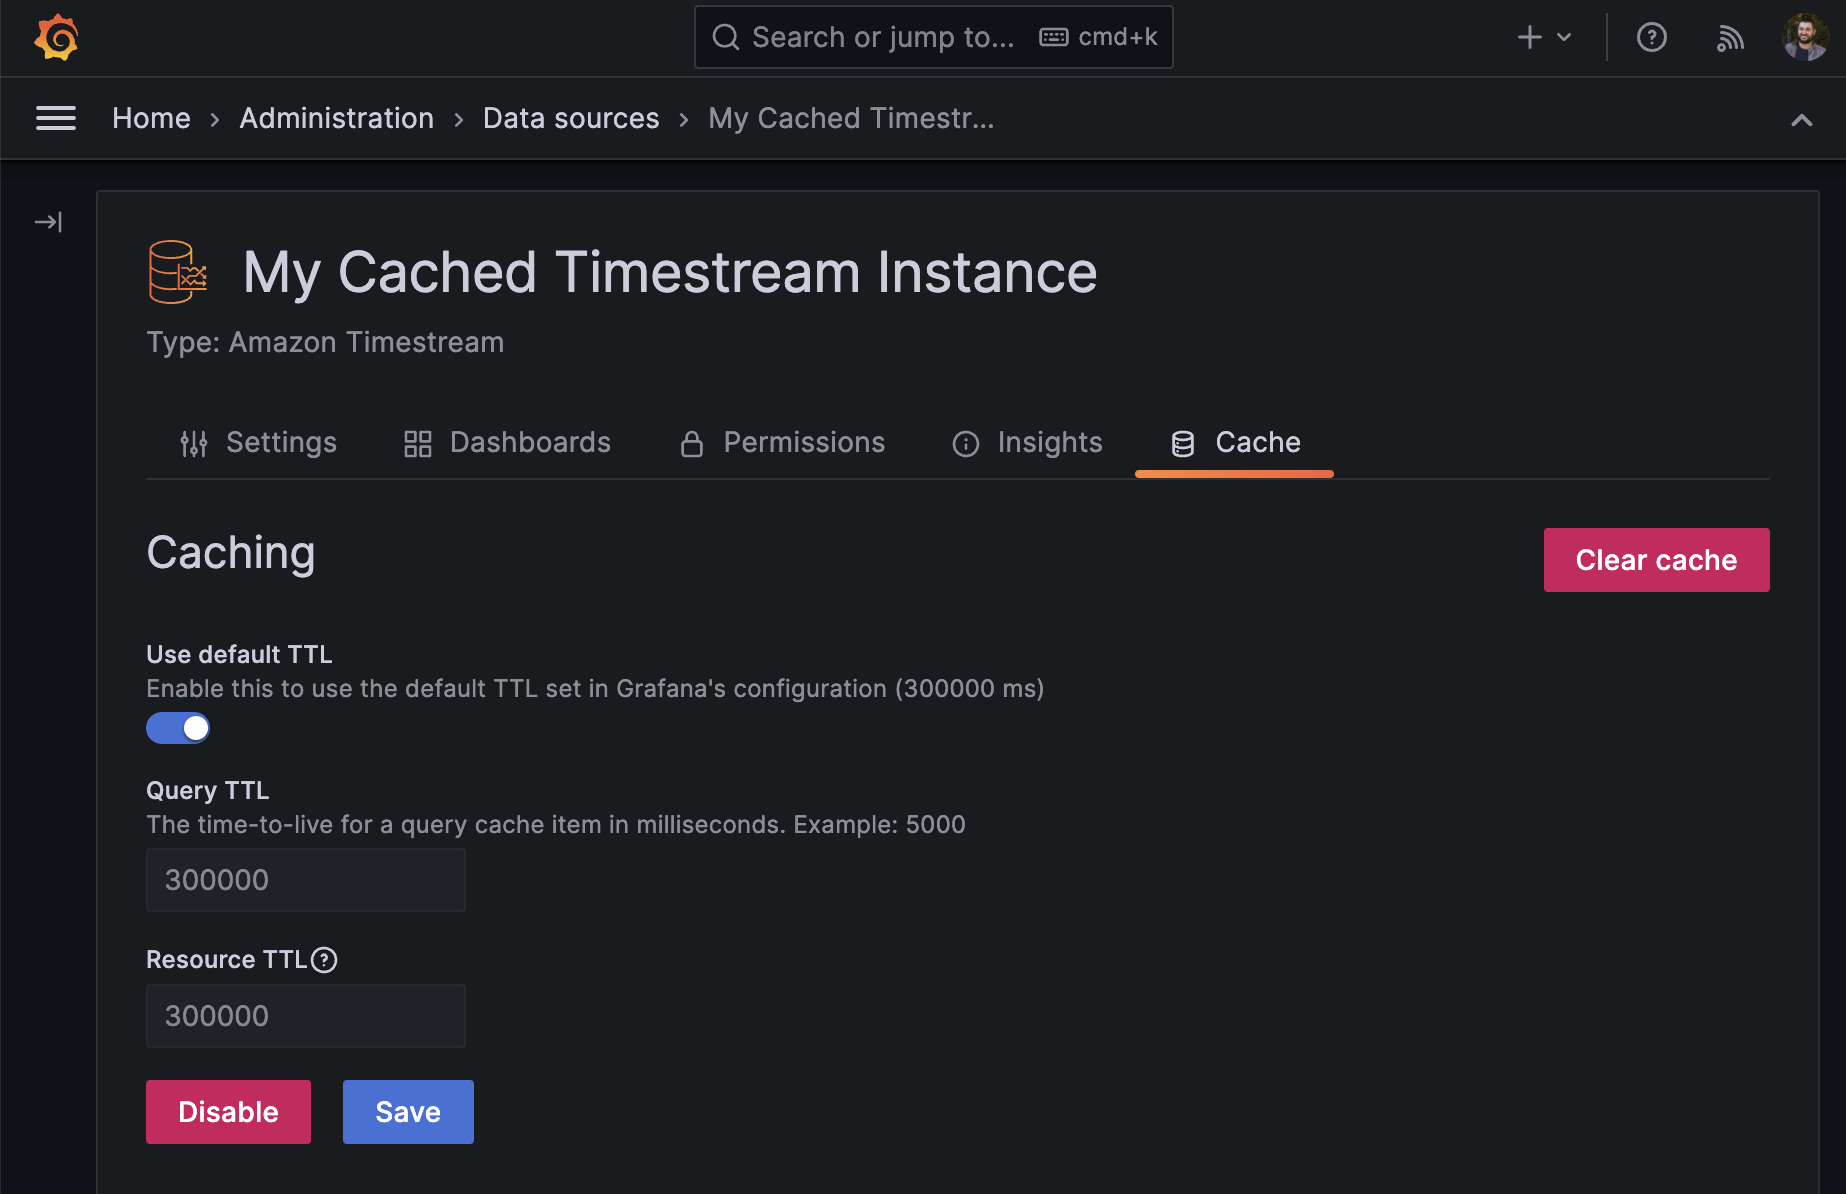
- Configure cache settings (optional).
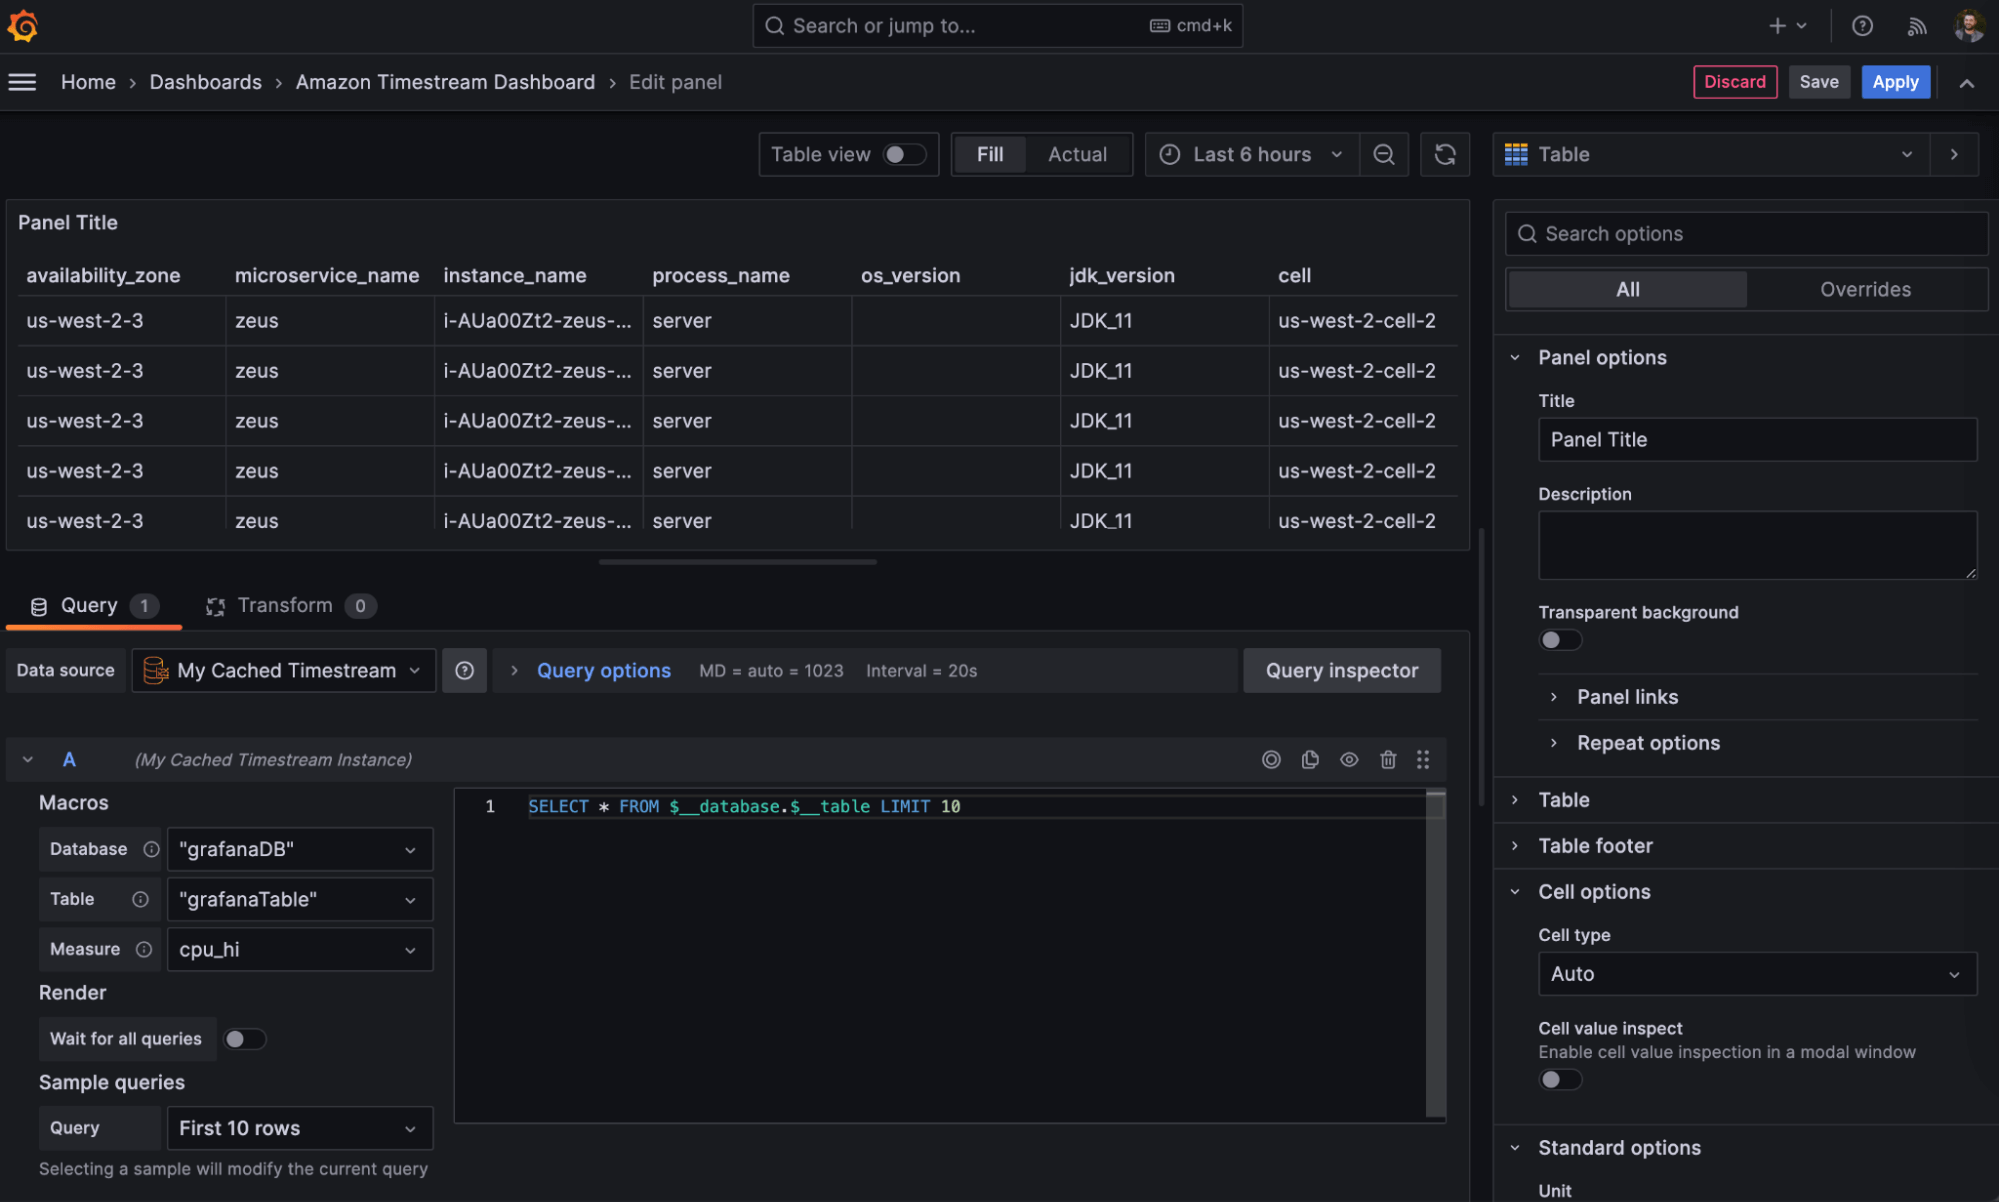
- Create a panel by authoring a query and selecting a visualization.
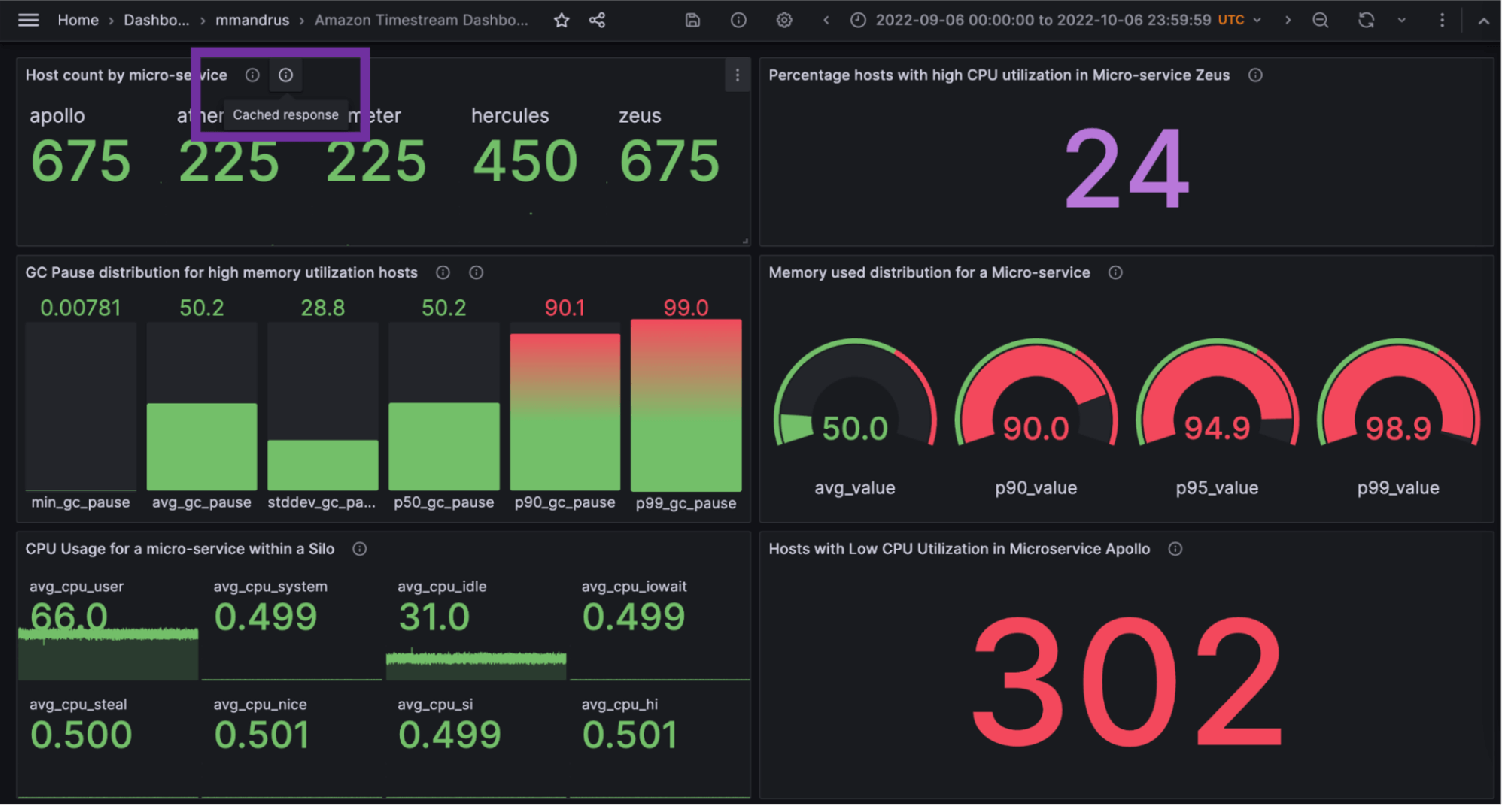
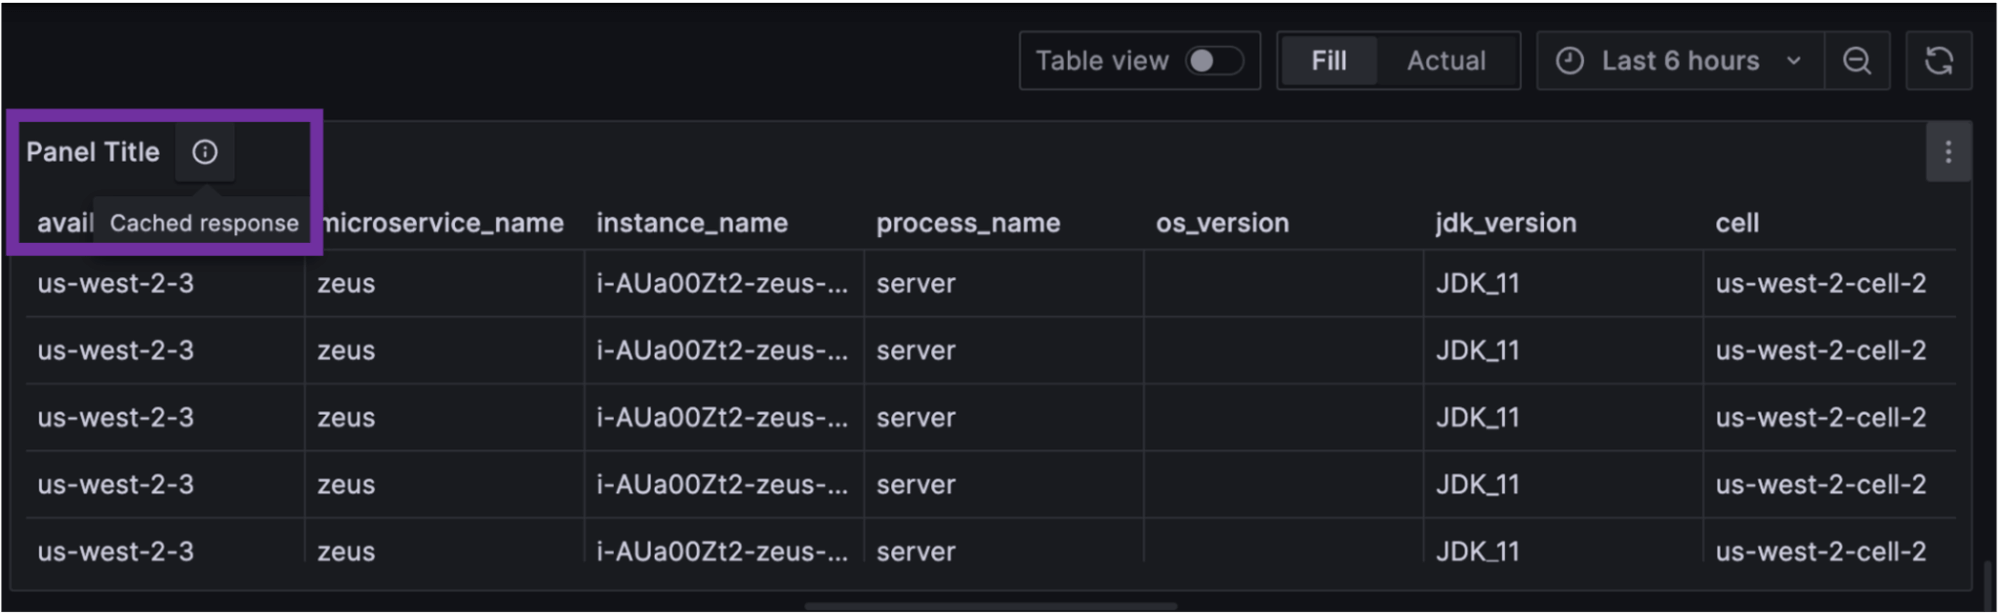
- Reload the panel and observe that the response is now cached.
And that’s it! Continue building your dashboard until you have the visualizations you need. Here is an example of a Grafana dashboard with Amazon Timestream data from an especially wide time range selected. While initially the size of the query (a month’s worth of Timestream data) caused a delay in fully loading this dashboard, a refresh using query caching took under 100 milliseconds – a 99% decrease! – and required no interaction with the Timestream database.

Considerations before using Grafana query caching
There are currently two noteworthy considerations when using query caching in Grafana:
- Cache keys are driven by specific timestamps. This means if your time range does not round to a time range already stored in the cache, Grafana will need to issue entirely new queries to the database. For example, if you have queried for t0 to t1, then query for t0 to t2, Grafana will execute a query for t0 to t2 instead of just t1 to t2. The same goes with subsets of results.
- If several users load the same dashboard simultaneously and the data is not currently cached, each query will be sent to the data source in parallel instead of deduplicated, which may result in a cache stampede. One way to monitor for cache stampedes is to monitor the Grafana metric
grafana_http_requests_in_flight. During a cache stampede, this metric will begin to increase based on the load. To prevent this from happening, configure Grafana using themax_conns_per_hostandmax_open_conns_default parameters.
The Grafana team is actively exploring potential enhancements for these limitations, and considering them for inclusion in future versions of Grafana. Stay tuned for progress updates and any potential fixes in upcoming releases.
Conclusion
In this post, we described how to use Grafana query caching with Amazon Timestream. Query caching is a key feature for increasing the performance of operational dashboards as well as lowering query costs. For additional documentation covering the use of Grafana with Amazon Timestream, and to create a sample application and dashboard, check out the Amazon Timestream developer guide to Grafana.
Grafana Cloud is the easiest way to get started with metrics, logs, traces, and dashboards. We recently added new features to our generous forever-free tier, including access to all Enterprise plugins for three users. Plus there are plans for every use case. Sign up for free now!
To learn more about AWS Timestream, and to get started, visit the AWS website.


