5 steps to start saving on your observability bill with Grafana Cloud Adaptive Metrics
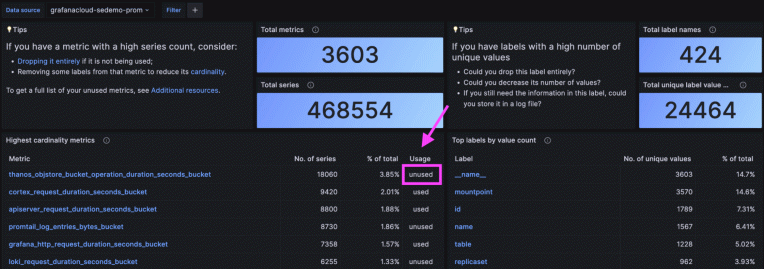
In the observability space, it seems like everyone is talking about how to reduce costs and control the explosion of Prometheus metrics. It’s no wonder — our recent analysis of user environments suggests 20% to 50% of metrics generated are never used, but users are still stuck paying for them.
Our solution to the problem is Adaptive Metrics — a metrics management and cardinality optimization feature in Grafana Cloud that eliminates unused and partially used metrics through aggregation. With Adaptive Metrics, you only pay for metrics you use, not what your dev teams generate. In fact, since we launched Adaptive Metrics in May, some early adopters have been able to drop as much as 25% of their time series, saving tens of thousands of dollars in the process.
And now we’re making it even easier to identify potential savings, with a brand new UX that introduces a new workflow for viewing your customized recommendations and aggregations. In this blog, we’ll highlight the new changes, then show you how to put them to use on your own observability stack.
Adaptive Metrics now has a new UI
Since the release of Adaptive Metrics public preview, you’ve told us that while the CLI and API provided great results and impressive impact, the ability to visualize your workflow would make for an even better experience. We agreed, and in response, we created an Adaptive Metrics UI, which is available in all tiers of Grafana Cloud (Free, Pro, and Advanced).
The new UI brings visibility and transparency to the process of creating aggregation rules. So no longer will Adaptive Metrics only exist as a backend capability. Now you can visualize and download your current rules and recommendations directly from within the Grafana UI.
How to reduce Prometheus cardinality with Adaptive Metrics
To illustrate how the new UI makes it even easier to get started with Adaptive Metrics, here is a step-by-step breakdown on how a Grafana Cloud Admin can use it to reduce their time series (and their observability bill).
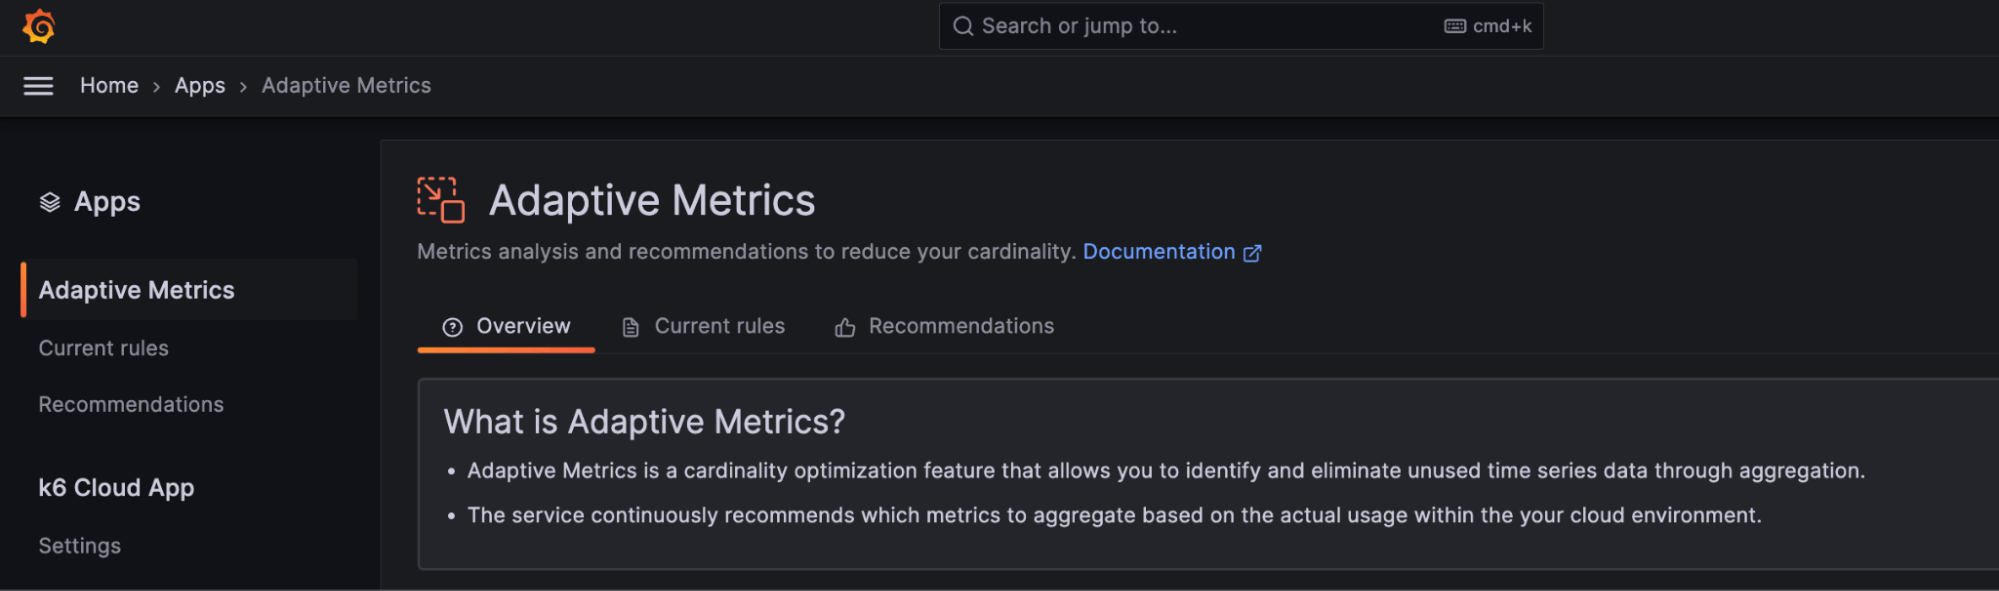
Step 1: Navigate to Adaptive Metrics plugin
The Adaptive Metrics plugin can be found under Apps. You can also get there by searching for Adaptive Metrics in the navigation bar.
Step 2: Begin with recommendations
The Recommendations tab is where you will get started with Adaptive Metrics. Go to this tab and view the recommended aggregation rules. Recommendations are organized by size, from the biggest times series reduction at the top down to the smallest at the bottom.

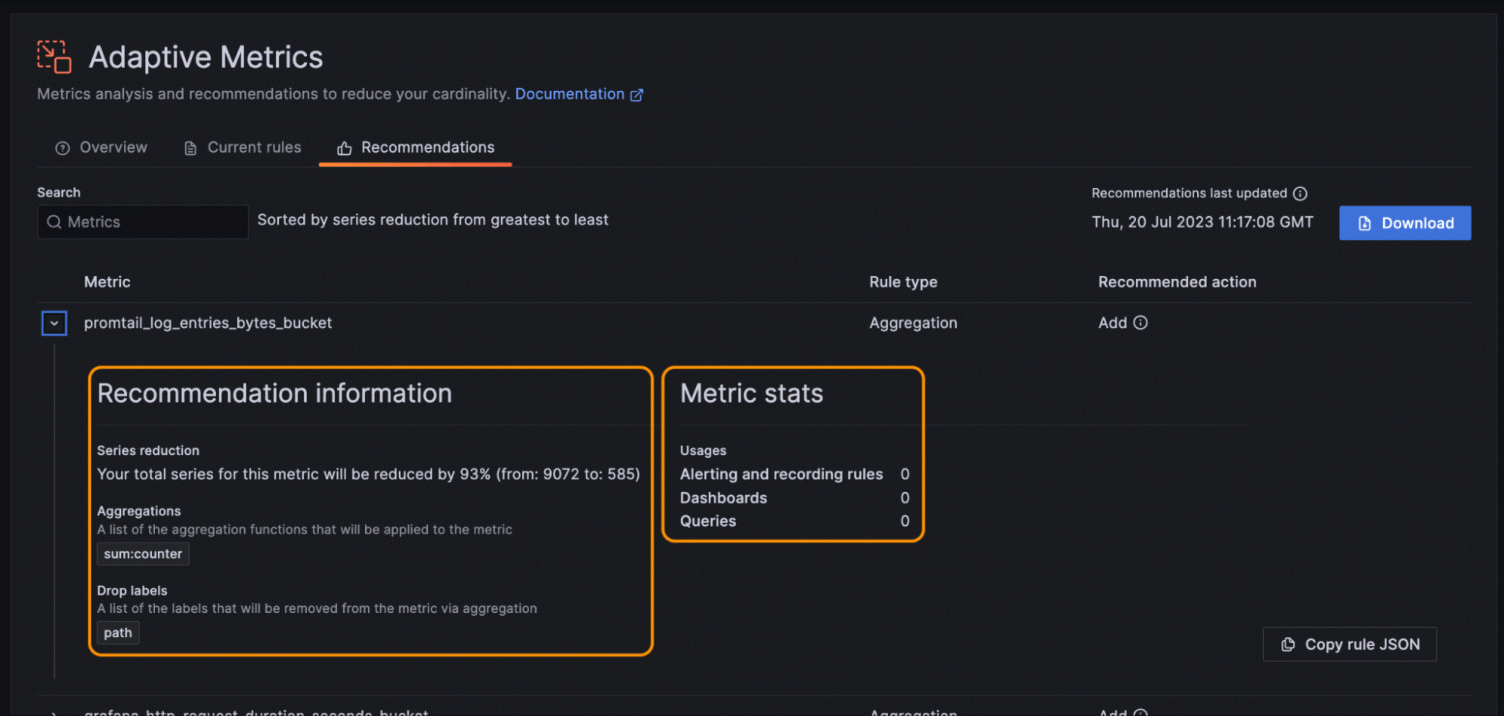
Above, we see a recommendation to add an aggregation rule for the metric promtail_log_entries_bytes_bucket. If we want to see more detail about a specific recommendation, we can expand the row.

After expanding the row, we are shown some additional information. Let’s take a closer look at what appears in the orange boxes in the screenshot above.
- Recommendation information: For this metric, we see that the recommendation is to apply the
sum:counteraggregation function, which will drop the “path” label and result in a reduction of ~8,500 active series. - Metric stats: Notice that this metric is not currently being used in any alerting and recording rules, dashboards, or queries. This makes it a prime candidate for aggregation.
Step 3: Copy or download recommendations and apply via CLI / API
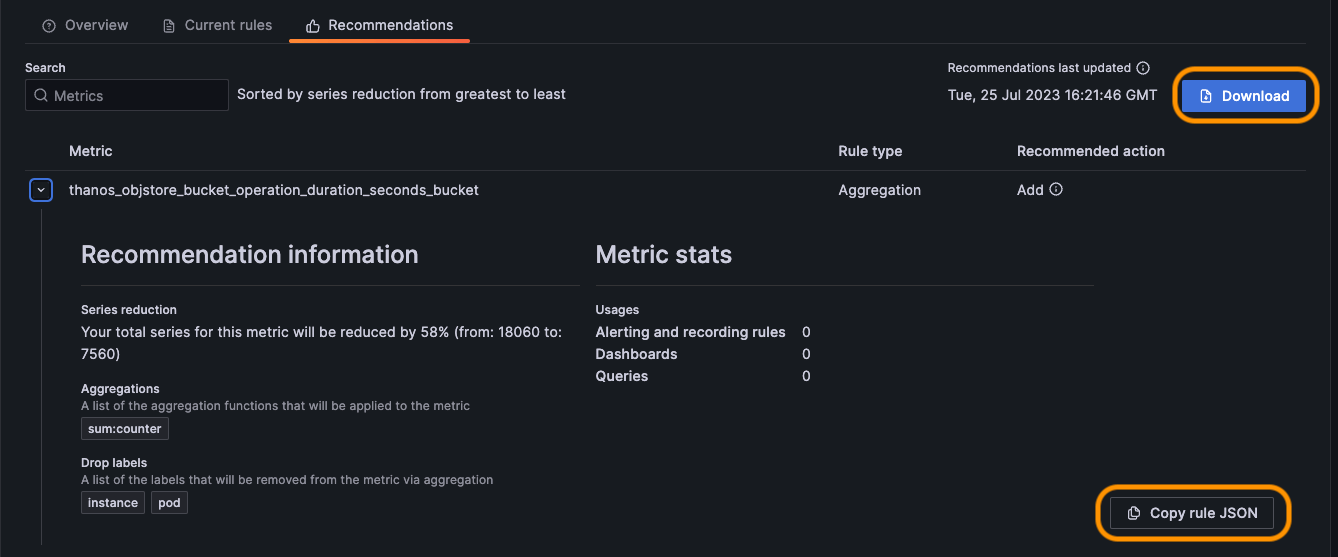
You have two options within the plugin for generating your recommendations in JSON format:
- Download all of your recommendations. When you click the download button, a recommendations.json file will be downloaded with all of your current recommendations. If you happen to have any rules currently applied, they’ll be included in the file. For this example, I am applying all the recommendations by downloading the file.
- Copy an individual rule. If you are going for a more targeted approach, click on the Copy rule JSON button, which copies a single rule directly to your clipboard.
From there, you can apply your recommendations via the CLI or the API. If this is your first time setting up a recommendation, head on over to our docs page and follow the CLI workflow or API workflow for applying recommendations. My personal preference is the API because I find that I can apply the rules with a simple bash command.
Step 4: Verify applied rules in the Current rules tab
After applying your rules via the CLI or API, navigate over to Current rules.
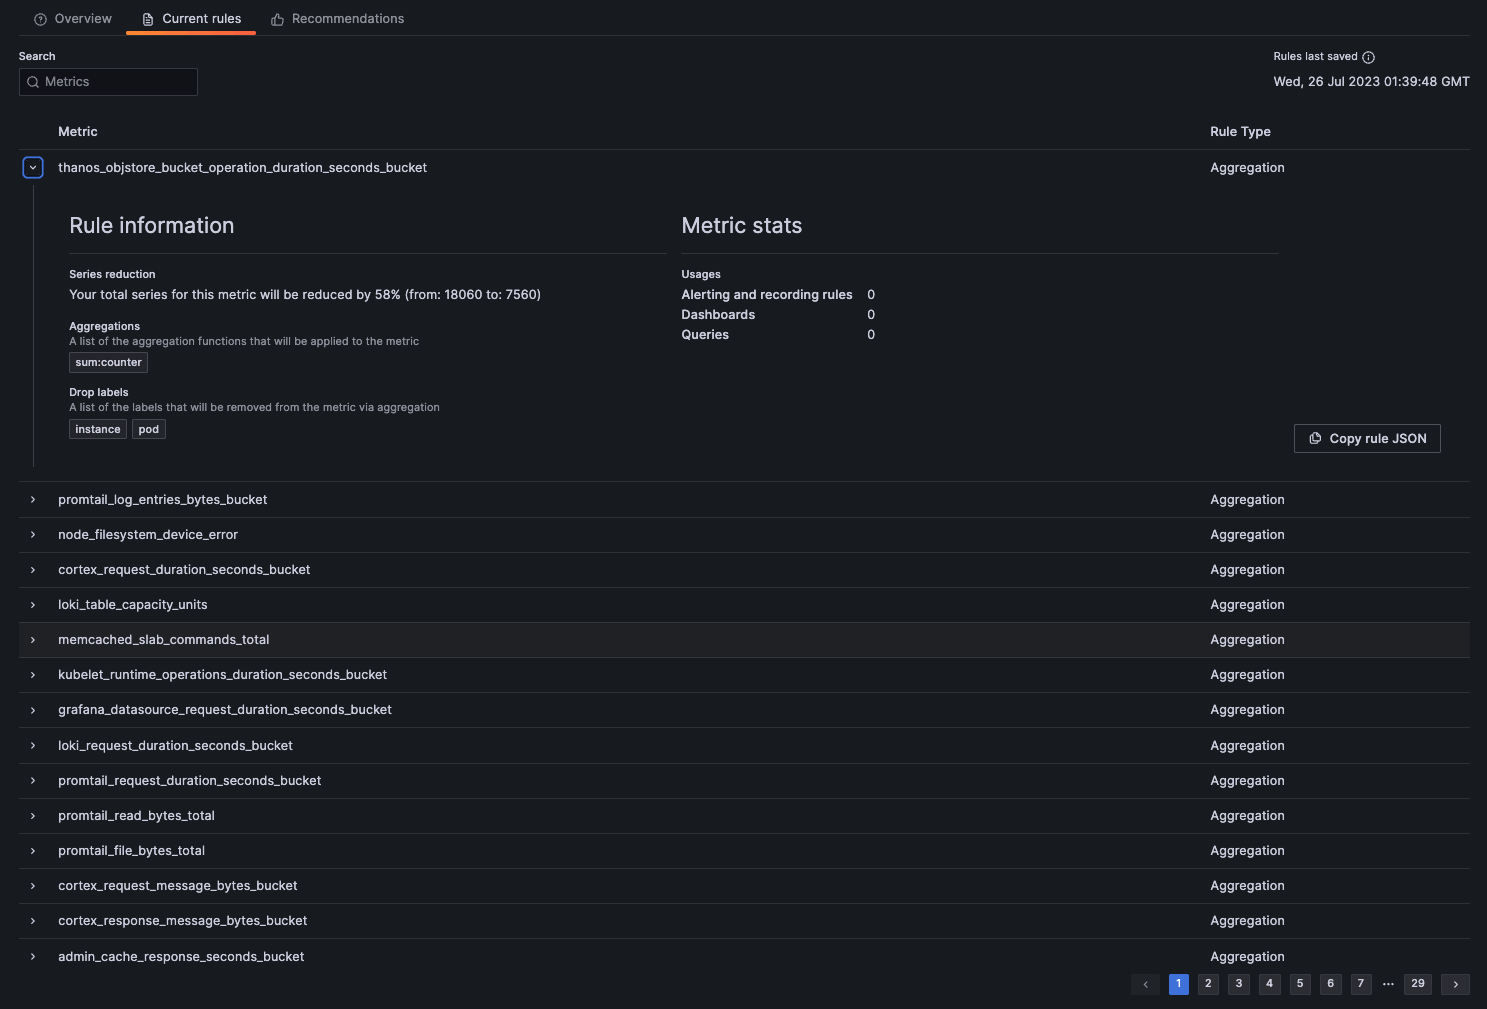
As you can see, all of the rules have now been posted under Current rules. The rules will be fully active and take effect within a few minutes from the time they are posted.
Step 5: See savings in your billing dashboard
Go to Metrics Instance Stats under the Billing/Usage dashboard to view the impact of your recently applied adaptive metrics rules.
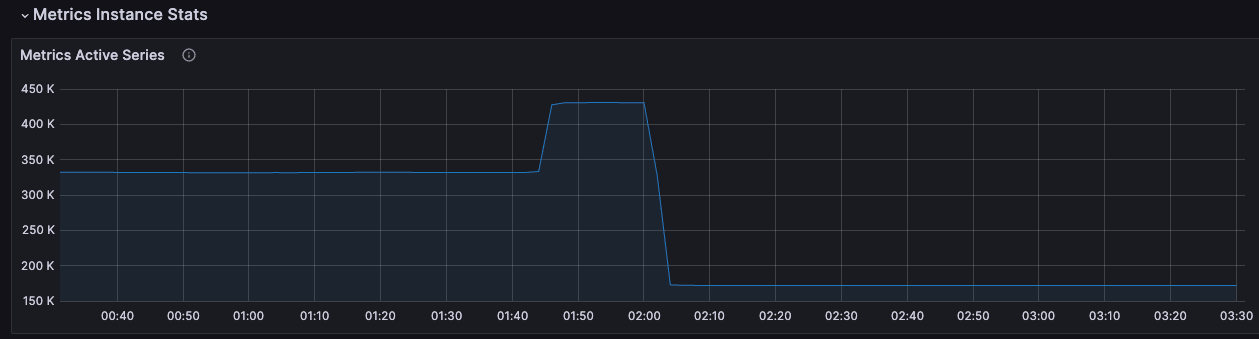
After applying the recommendations in my environment, I saw a sharp drop-off in the total active series from 332,000 to 172,000, a 50% reduction in overall active series within less than an hour.
What the future holds for Adaptive Metrics
Adaptive Metrics is now automatically available to all Grafana Cloud Pro and Cloud Advanced users at no additional cost, so we can’t wait to see how more organizations put it to use. We’ve already received some valuable feedback, which in true Grafana Labs fashion, continues to influence our roadmap. Here are just some of the features we’re working on:
- Cloud Free tiers will soon have Adaptive Metrics enabled by default in their account as well.
- Update: As of Aug. 25, Adaptive Metrics is also available by default in Cloud Free tier accounts.*
- Apply and remove recommendations and current rules directly from the Adaptive Metrics UI.
- More robust search and filtering capabilities for identifying metrics.
- Easily identify and apply aggregation rules for unused metrics.
- Automatically apply recommendations.
Finally, if you want to provide feedback, or if you have a feature request for Adaptive Metrics, please let us know! Leave a question or comment in the Grafana Cloud section of the Grafana community forums.
Grafana Cloud is the easiest way to get started with metrics, logs, traces, and dashboards. We have a generous forever-free tier and plans for every use case. Sign up for free now!