How to monitor your Apache Mesos clusters with Grafana Cloud
We’re excited to introduce a dedicated Apache Mesos integration, our solution to easily monitor the open-source project for managing clusters in your data center and at cloud scale in Grafana Cloud.
Apache Mesos is a distributed systems kernel, running on every machine in a cluster and providing easy orchestration of every resource in the cluster. This allows you to treat compute units, memory, and disk as a single pool of resources. With this new solution, you can easily monitor the status of your cluster resources and health, registrar and allocator states, along with system logs.
This solution comes with five alerts and a prebuilt dashboard that incorporates more than 20 different metrics it scrapes from your system. Let’s walk through how to easily set up a Grafana Cloud account and start monitoring your Apache Mesos clusters!
How to configure Apache Mesos with Grafana Cloud
The Apache Mesos solution utilizes metrics generated by the open source Prometheus Mesos Exporter project. This exporter must be installed on each master and agent node in your clusters. We provide an easy to use Grafana Agent configuration so it is easier for you to run it in your environment and start collecting metrics with a single agent. To start monitoring your Apache Mesos clusters with Grafana Cloud, follow these simple steps:
- Sign into your Grafana Cloud account, which is required to use the Apache Mesos solution. If you don’t have a Grafana Cloud account, you can sign up for a forever-free account today.
- In your Grafana instance on Grafana Cloud, use the left-side navigation to get to the Connections Console (Home > Connections > Connect data).
- Install the Apache Mesos integration and configure the Grafana Agent to collect logs and metrics from it. Please refer to our documentation on how to install and manage integrations for more information. And for details around configuring Grafana Agent for this solution, refer to the corresponding documentation.
Start monitoring Apache Mesos clusters
After the solution has been installed, you will see a pre-built dashboard for Apache Mesos along with a set of five relevant alerts automatically installed into your Grafana Cloud account.
Apache Mesos overview dashboard

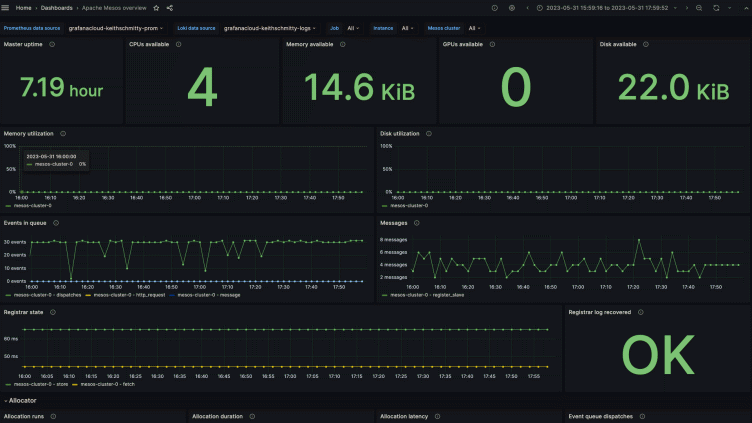
The Apache Mesos overview dashboard provides you with an easily digestible high level view of one or all of your Mesos clusters. You can view the resources available to your clusters, relevant resource utilization for both master and agent, events and messages in queue, along with the registrar state. Additionally, several panels describe allocator runs, duration, latency and event queue status.
A subset of the key metrics used by the dashboard can be seen below, and the full list can be found within the Apache Mesos integration documentation:
mesos_master_cpusmesos_master_diskmesos_master_gpusmesos_master_memmesos_master_messagesmesos_master_slaves_statemesos_master_task_states_currentmesos_master_event_queue_dispatchesmesos_master_event_queue_length
And finally, you can inspect both master and agent logs directly on the dashboard, as seen in the screenshot below:

Apache Mesos alerts
The Apache Mesos solution for Grafana Cloud includes a set of five alerting rules that were created to help you monitor your Apache Mesos clusters. The alerts cover resource usage such as high memory and disk usage, unreachable tasks, a lack of cluster coordination, and inactive agents.
All the alerts can be seen here below, with appropriate descriptions. For more information on relevant metrics used for alerting, see the Apache Mesos integration documentation.
All alerts thresholds are default examples and can be configured to meet the needs of your environment.
Apache Mesos High Memory Usage
This alert rule monitors the mesos_master_mem metric and will fire a warning alert if the minimum reported memory utilization across the cluster for the past five minutes has exceeded 90%.
Apache Mesos High Disk Usage
This alert rule monitors the mesos_master_diskmetric and will fire a critical alert if the minimum reported disk utilization across the cluster for the past five minutes has exceeded 90%.
Apache Mesos Unreachable Tasks
This alert rule monitors the mesos_master_task_states_current metric for unreachable states. A warning alert will fire if more than three unreachable tasks have been reported for the past five minutes.
Apache Mesos No Leader Elected
This alert rule monitors the boolean metric mesos_master_elected to establish whether the Apache Mesos cluster has a cluster coordinated elected, and will fire a critical alert if the state has been 0 (e.g. no leader elected) for the past minute.
Apache Mesos Inactive Agents
This alert rule monitors the mesos_master_slaves_state metric for connected_inactive and disconnected_inactive states across the cluster. If more than one inactive client has been detected for the past five minutes, a warning alert will fire.
Start monitoring Apache Mesos today
These dashboards and alerts can help you get your Apache Mesos cluster monitoring up and running in an easy way, which is the goal of this solution.
Give our Apache Mesos solution a try, and let us know what you think! You can reach out to us in our Grafana Labs Community Slack in the #Integrations channel.
And if you’re looking to monitor additional environments, check out our solutions page for a list of other tools and platforms we can help you visualize and monitor with Grafana Cloud. At Grafana Labs, we have a “big tent” philosophy of providing a consistent experience across as many data sources and environments as possible, and we’re continuing to expand our solutions to support our community’s needs.
Grafana Cloud is the easiest way to get started with metrics, logs, traces, and dashboards. We have a generous forever-free tier and plans for every use case. Sign up for free now!


