

Celebrating Grafana 10: Top 10 Grafana features you need to know about
Since Grafana started 10 years ago, there have been more than 43,000 commits to the open source project. Grafana founder Torkel Ödegaard has made more than 7,600 of those commits, and he recently reflected on some personal favorites he’s worked on, ranging from early query builders to the latest navigation updates.
Torkel isn’t the only one who has strong feelings. Turns out it’s hard for the Grafana team not to play favorites: We asked engineers, product managers, UX designers, and more to name a functionality they love in Grafana. Some highlighted hidden gems in panels and the UI, while others couldn’t help but talk about the features they worked on — and who can blame them, because each enhancement is pretty awesome.
In this blog post, you will discover what made our Not Quite Unbiased, But Still Totally Valid List of Top 10 Grafana Features. You can play around with these and all the latest updates introduced in Grafana 10 on Grafana Cloud, which has a generous forever-free tier and plans for every use case. (Don’t have a Grafana Cloud account? Sign up for free today!)
1. Grafana Live
Nominated by: Torkel Ödegaard, Chief Grafana Officer & Co-founder
Introduced: Grafana 8.0
What it does: Grafana has built-in support for streaming — no external data source required. Push data to /api/live/push/:streamId and select that stream using the built-in Grafana data source and visualize it live.
There’s supposed to be a video here, but for some reason there isn’t. Either we entered the id wrong (oops!), or Vimeo is down. If it’s the latter, we’d expect they’ll be back up and running soon. In the meantime, check out our blog!
Learn more in our Grafana Live documentation.
2. Query builders
Nominated by: Ivana Huckova, Senior Software Engineer
Introduced: Grafana 9.0
What it does: This is personal because I worked on this feature, but I really like query builders. We built query builders for Grafana Loki and Prometheus (below) to help new users break the barrier and get started in Grafana. You can now query and visualize data even when you’re not sure about the querying language.
There’s supposed to be a video here, but for some reason there isn’t. Either we entered the id wrong (oops!), or Vimeo is down. If it’s the latter, we’d expect they’ll be back up and running soon. In the meantime, check out our blog!
Read our blogs about the Prometheus query builder and the Loki query builder to learn more.
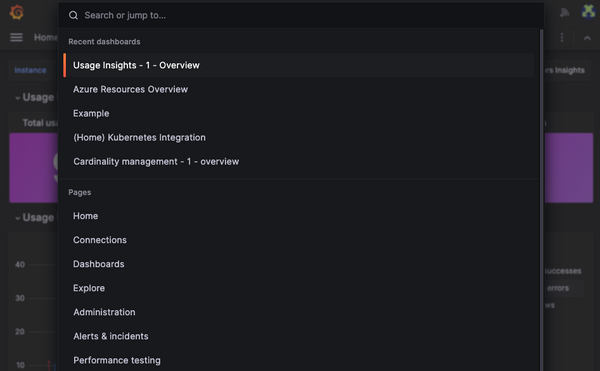
3. Command palette
Nominated by: David Kaltschmidt, Senior Director, Engineering
Introduced: Grafana 9.0
What it does: Navigate your way through the Grafana UI without using your mouse or taking your hands off the keyboard. Hit cmd + k and a menu pops up with all the keyboard commands you need at your fingertips.
Learn more in our blog post about the command palette.
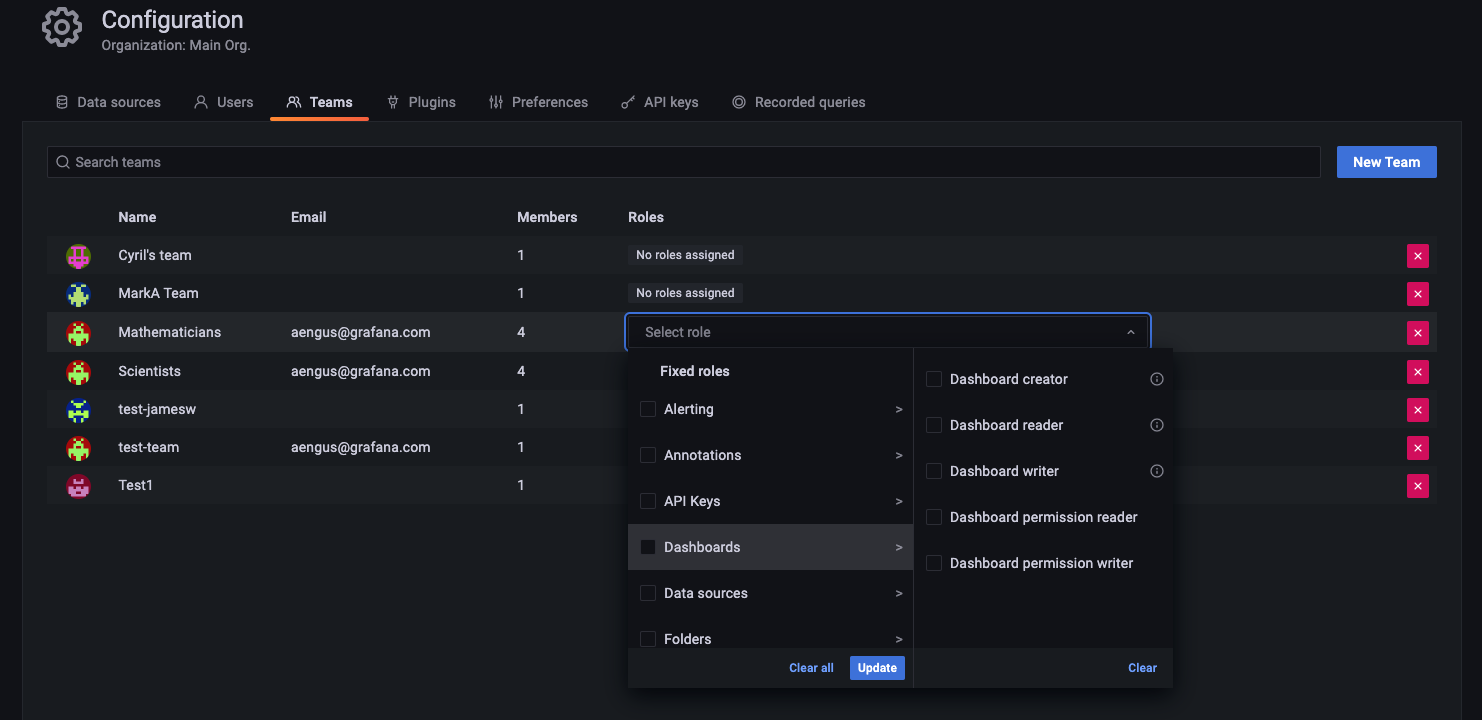
4. Role-based access control (RBAC) updates*
Nominated by: Alexander Zobnin, Senior Software Engineer
Introduced: Grafana 8.0
What it does: From the beginning, Grafana had a few built-in roles (Viewer, Editor, Admin), each with a predefined set of permissions. With RBAC, you can configure access and change permissions assigned to built-in roles or grant specific permissions to users and teams.
* This feature is only available in Grafana Enterprise and Grafana Cloud Advanced.
Check out our RBAC documentation to learn more.
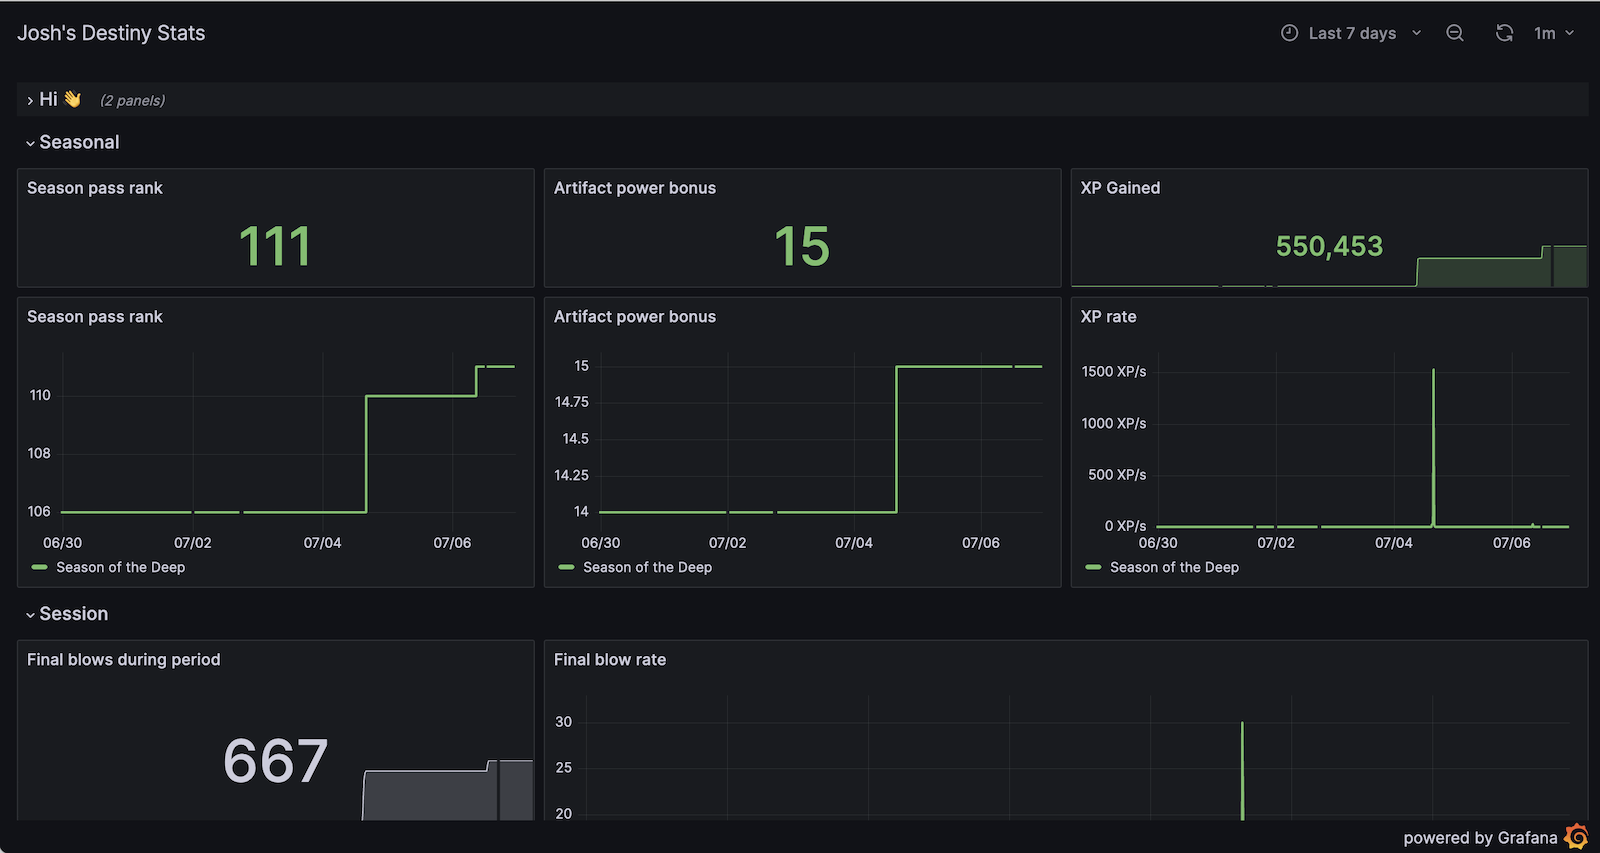
5. Public dashboards
Nominated by: Josh Hunt, Senior Software Engineer
Introduced: Grafana 9.1
What it does: Public dashboards allow you to share your Grafana dashboard with anyone, even if they’re not part of your Grafana organization. Users now have the ability to share dashboards with up-to-date data — for work or for play.
Read more about public dashboards on the blog.
6. Visualization suggestions
Nominated by: Daniel Lee, Senior Director, Grafana
Introduced: Grafana 9.1
What it does: This is hidden away in the Panel Edit options. It analyzes your data and query context to provide intelligent suggestions for visualizations. Rather than clicking through a lot of visualizations, you get an instant overview of what your data would look like in lots of different panels. What’s even better is that it uses real data from the query rather than sample data. It’s also smart and can suggest the same visualization but with different options enabled, so this feature is also a way of teaching users what is possible with Grafana visualizations.

Learn more in our visualizations documentation.
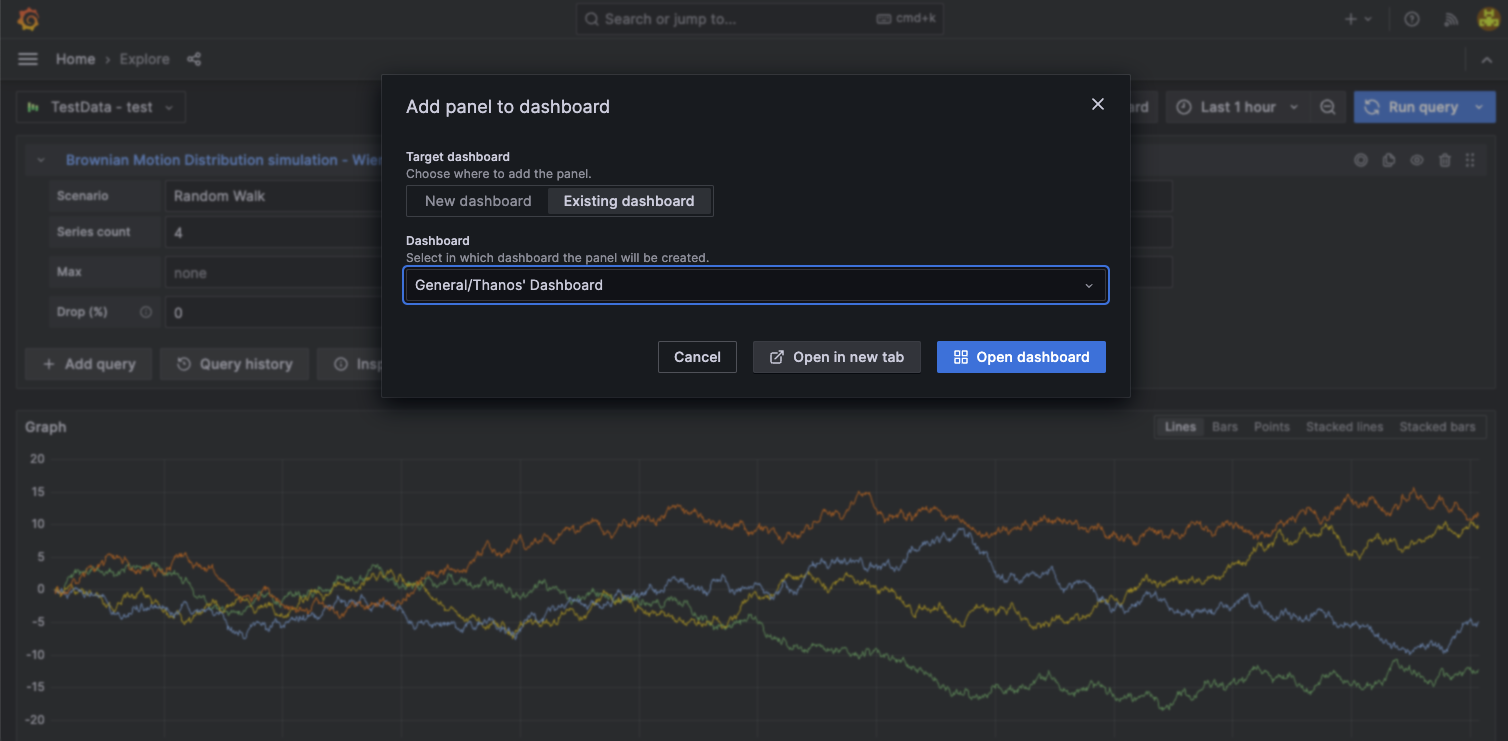
7. Explore to dashboard
Nominated by: Thanos Karachalios, Senior Product Manager
Introduced: Grafana 9.0
What it does: Easily convert and transfer a data exploration session in the Explore interface into a full-fledged dashboard. The feature provides a seamless transition from an ad-hoc data exploration to a more permanent and shareable visualization within a dashboard.
Get more familiar with Explore by reading out Grafana documentation.
8. Chained variables
Nominated by: Mitch Seaman, Director of Product
Introduced: Grafana 8.0
What it does: This one is simple but versatile. You can use template variables to filter other template variables. By doing this, you can create a progressive set of filters that helps you drill down to exactly the data you’re looking for, without having to endlessly scroll.
You can find more information in our chained variables documentation.
9. Infinity data source plugin
Nominated by: Sriramajeyam Sugumaran, Senior Software Engineer
Introduced: Grafana 9.1
What it does: Users can connect Grafana to any third-party API and effortlessly visualize data from diverse sources. The infinity plugin can process different data formats such as JSON, CSV, XML, HTML and GraphQL endpoints easily. With the different authentication mechanisms such as basic auth, token auth, bearer token, JWT token, and OAuth2, the Infinity plugin makes it possible to connect to almost any API, ranging from a hobbyist’s Pokeman API to a professional’s AWS/Azure/GCP cloud API endpoints.
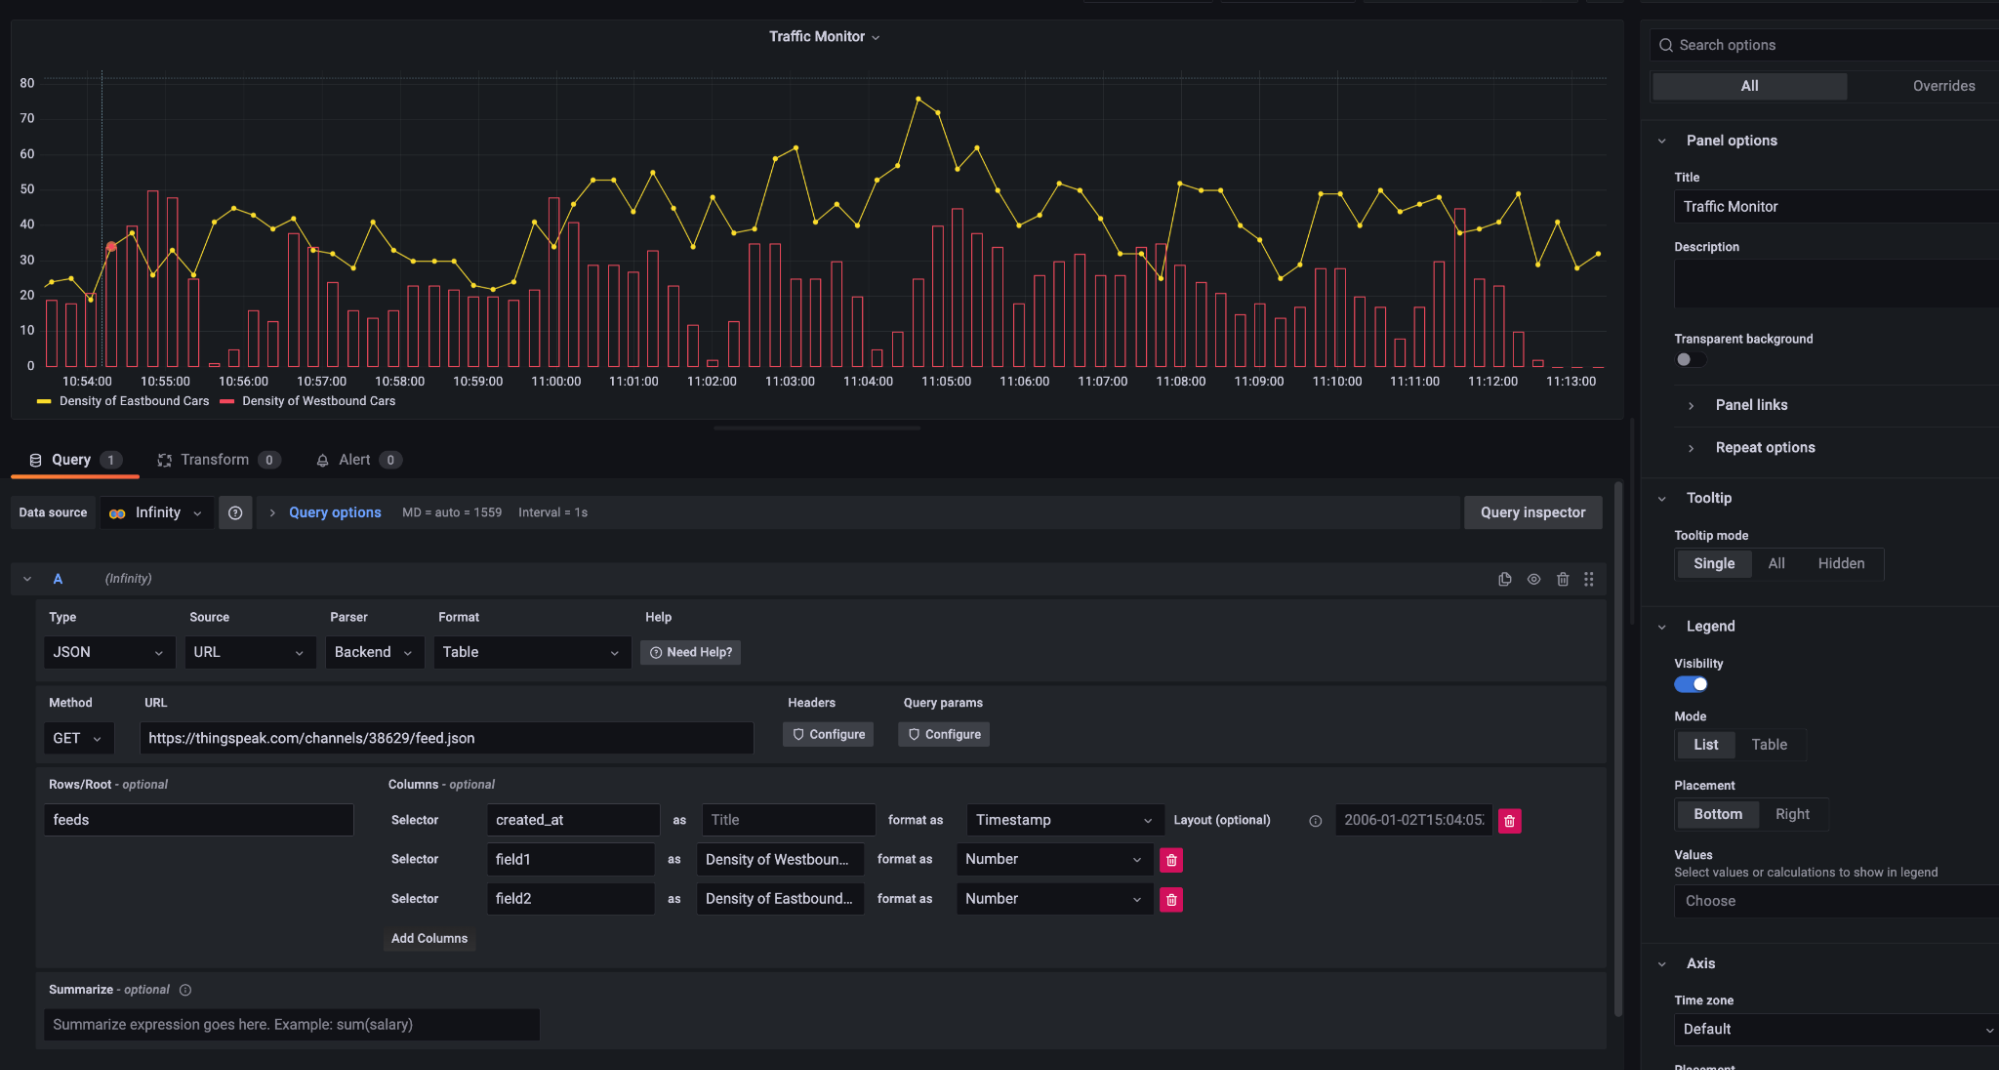
You can find the infinity data source plugin in GitHub.
10. Plugin catalog
Nominated by: Alexa Vargas, Senior Software Engineer
Introduced: Grafana 8.2
What it does: Find and install plugins directly within Grafana, all without the interruption of a system restart. The plugin catalog takes the complexity out of building dashboards so you don’t need to be a tech whiz to venture into the diverse world of plugins.
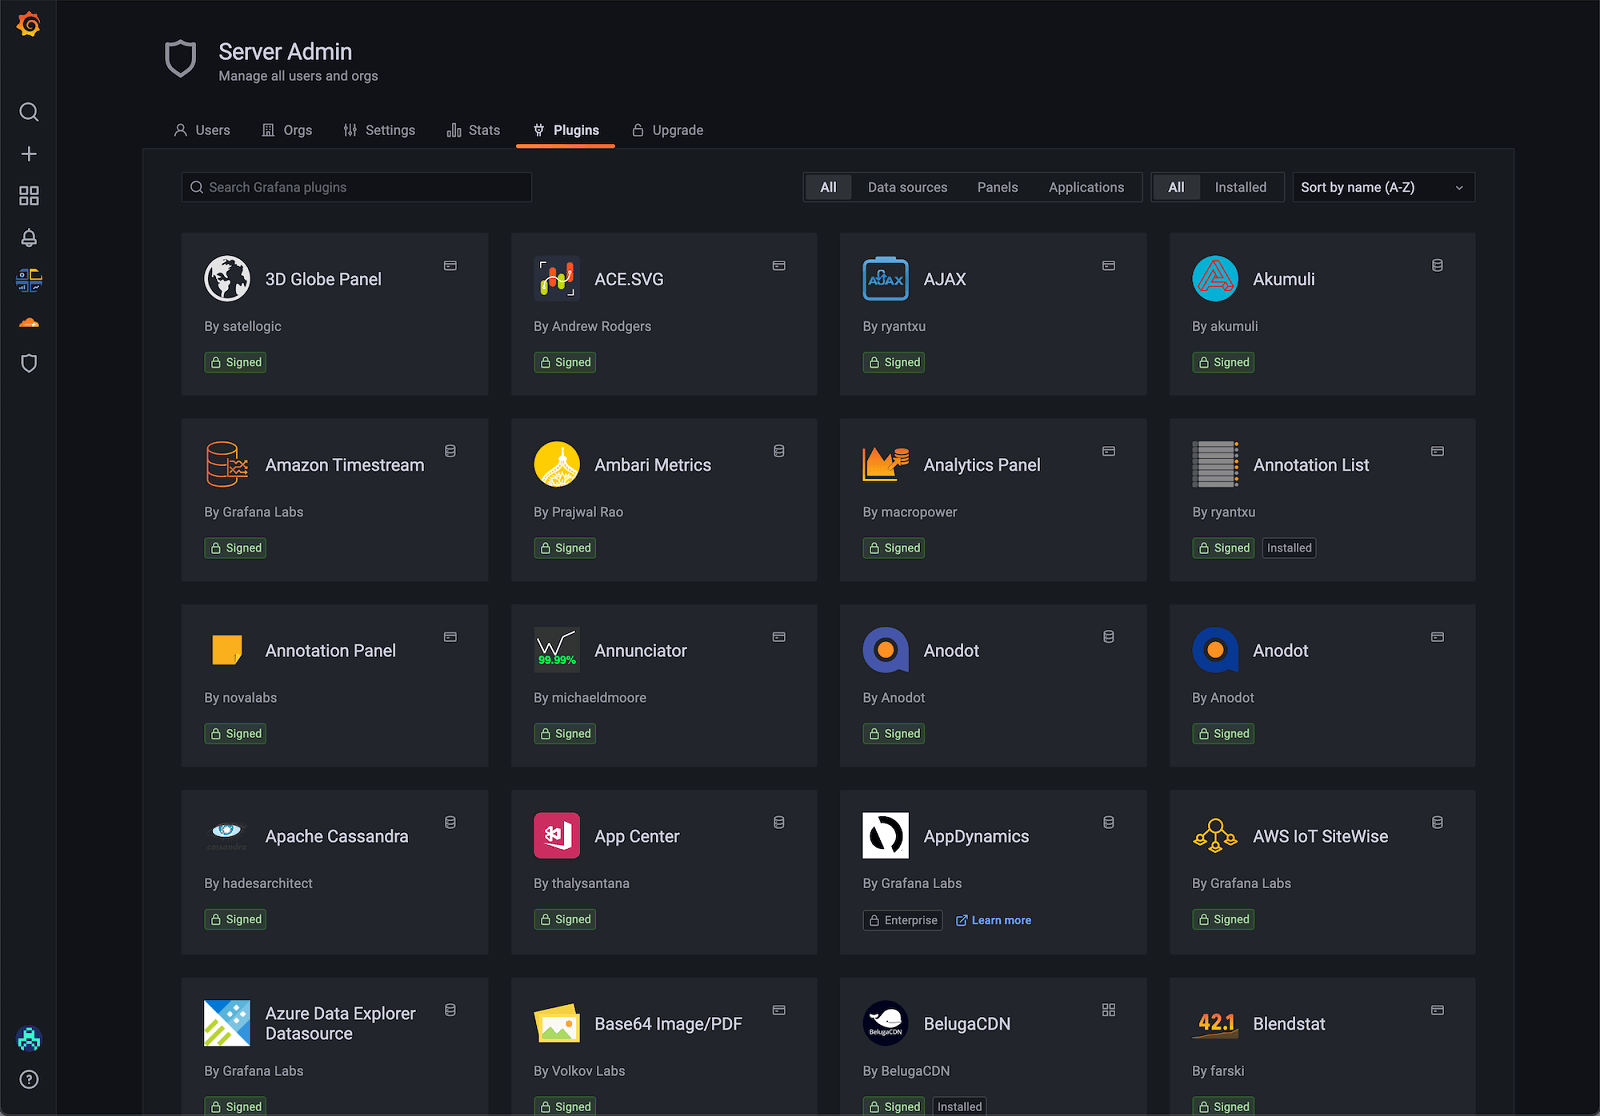
Read more about the plugin catalog on the blog.
Get started with Grafana 10
Whether you manage vast amounts of data, analyze metrics, or simply love creating compelling dashboards, Grafana 10 brings new capabilities that help you go beyond just visualizing data. You’ll be able to put together narratives that make sense of complex information, share your insights with a broader audience, or drive more impactful, confident decisions.
For a complete list of new features, check out our Grafana documentation, our changelog, or the What’s New in Grafana 10.0 documentation.
You can also join us on our Grafana Labs community forums to discuss any of the new features, workflows, or how to incorporate these changes into your dashboards, queries, and visualizations.
For a live demo of all the latest features, check out our GrafanaCON 2023 session “Deep dive into Grafana 10” or watch our free webinar “Getting started with the Grafana LGTM Stack” on July 19.
Upgrade Grafana today
Download the latest version of Grafana today or try it out on Grafana Cloud, which has a generous forever-free tier and plans for every use case. Sign up for free today!
For more information about upgrading your Grafana installation, refer to our upgrade Grafana documentation.
Grafana Cloud is the easiest way to get started with metrics, logs, traces, and dashboards. We recently added new features to our generous forever-free tier, including access to all Enterprise plugins for three users. Plus there are plans for every use case. Sign up for free now!