
How to monitor Kubernetes network and security events with Hubble and Grafana
Anna Kapuścińska is a Software Engineer at Isovalent, who has a rich experience wearing both developer and SRE hats across the industry. Now she works on Isovalent observability products such as Hubble, Tetragon, and Timescape, as well as the respective Grafana integrations for all of them.
At Isovalent, we are leveraging eBPF technology to build the next generation of networking, security, and observability tools for Kubernetes. Last year, we announced a strategic partnership with Grafana Labs, with a goal to provide infrastructure and developer teams deep insights into the connectivity, security, and performance of their applications. As part of this partnership we developed the Hubble data source plugin (currently in beta in Grafana) to help monitor network and security events.
What is Hubble and how is it used for observability?
Hubble is a network observability tool built on top of Cilium — an open source eBPF-powered networking and security solution. Hubble enables deep visibility into the communication between services as well as the networking infrastructure in a completely transparent manner. Think of it like a telescope for your network.
Historically, certain networking and security problems were very difficult to diagnose. System administrators could get some insights using advanced command line tools, but correlating this information with application performance was a manual and time-consuming task, requiring multiple people with different expertise.
Using eBPF as a foundation for tools like Hubble or Tetragon, which is a flexible and efficient observability and security solution, allows us to give users very detailed visibility into network and security events. These events are low-level in nature, but we enhance them with high-level context, for example Kubernetes metadata.
However, observability data is more useful if it’s accessible via a common interface — ideally a centralized one. This is where the Grafana LGTM stack (Loki for logs, Grafana for visualization, Tempo for traces, Mimir for metrics) comes into play. When talking to our customers and open source users, we found that almost everybody uses Grafana to some extent to visualize their data. Grafana’s “big tent” approach makes it a no-brainer solution for getting insights from the multitude of tools commonly used in the cloud native space.
The concept behind the Hubble data source plugin was to visualize granular networking and security events in a way that can be easily consumed by both platform and application teams. The plugin integrates with three underlying data stores: Hubble Timescape, Prometheus (storing Hubble networking metrics), and Grafana Tempo (storing traces that can be correlated with different signals).
How to monitor Kubernetes clusters with the Hubble plugin for Grafana
Monitor Kubernetes network flows with flows query
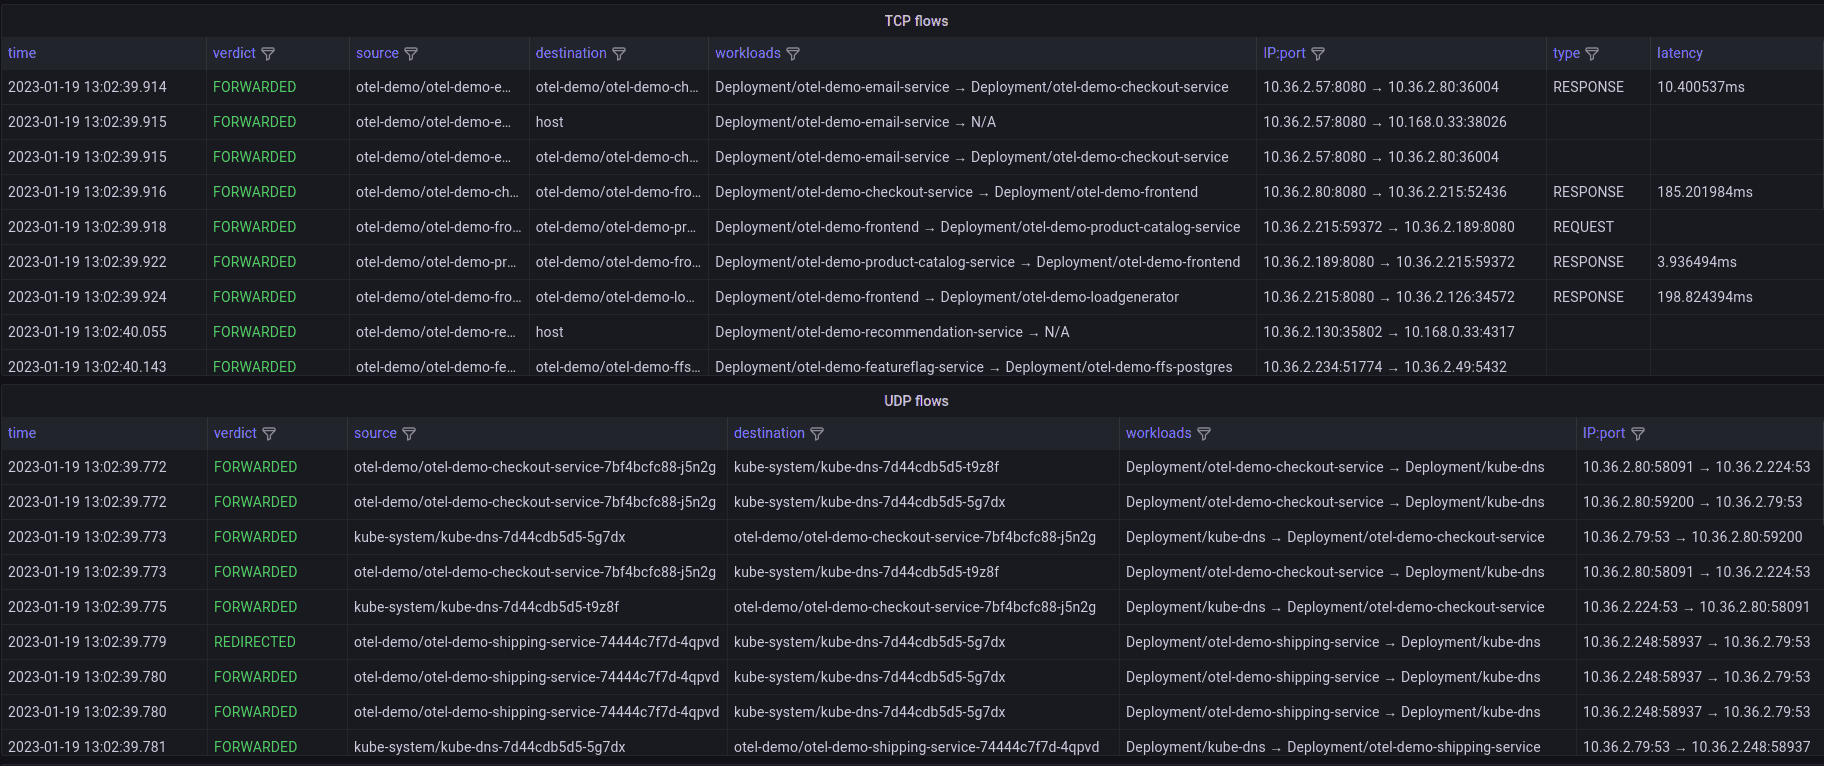
The first feature we developed was the flows query. The idea is simple: allow users to arbitrarily slice and dice network flows, similarly to how it’s possible with Hubble CLI, but without leaving the Grafana tab in their browser.
Hubble collects network flows on all network layers and annotates them with Kubernetes metadata. Then the flows are stored in Hubble Timescape, an Isovalent Enterprise observability platform that our customers can deploy to their infrastructure, and from there they are exposed to the Grafana instance.
The ability to retrieve detailed network flows with Kubernetes context is unparalleled when it comes to debugging fiddly network issues. The most common use case we see across our customers is reviewing traffic dropped by network policies. By querying dropped flows you can easily see whether network policies are missing some rules or pods are trying to send unexpected (potentially malicious) traffic. Other use cases include troubleshooting application configuration, as well as problems at the underlying network layer.
Monitor Kubernetes process events with process ancestry tree

Another specialized feature of the Hubble data source plugin is the process ancestry tree. Like the flows query, it depends on Hubble Timescape as the underlying data store, but instead of network flows, it retrieves process events produced by Tetragon. Thanks to the Tetragon eBPF hooks we are able to track all process executions in a Kubernetes cluster and reconstruct the full process tree for any pod. To visualize this data, we developed a Hubble Process Ancestry panel plugin for Grafana. This is particularly useful from a security standpoint: When security engineers see the process hierarchy in Kubernetes context, they can quickly understand whether a suspicious command was the result of a malicious actor or normal application operations.
Monitor HTTP traffic in Kubernetes with HTTP service map
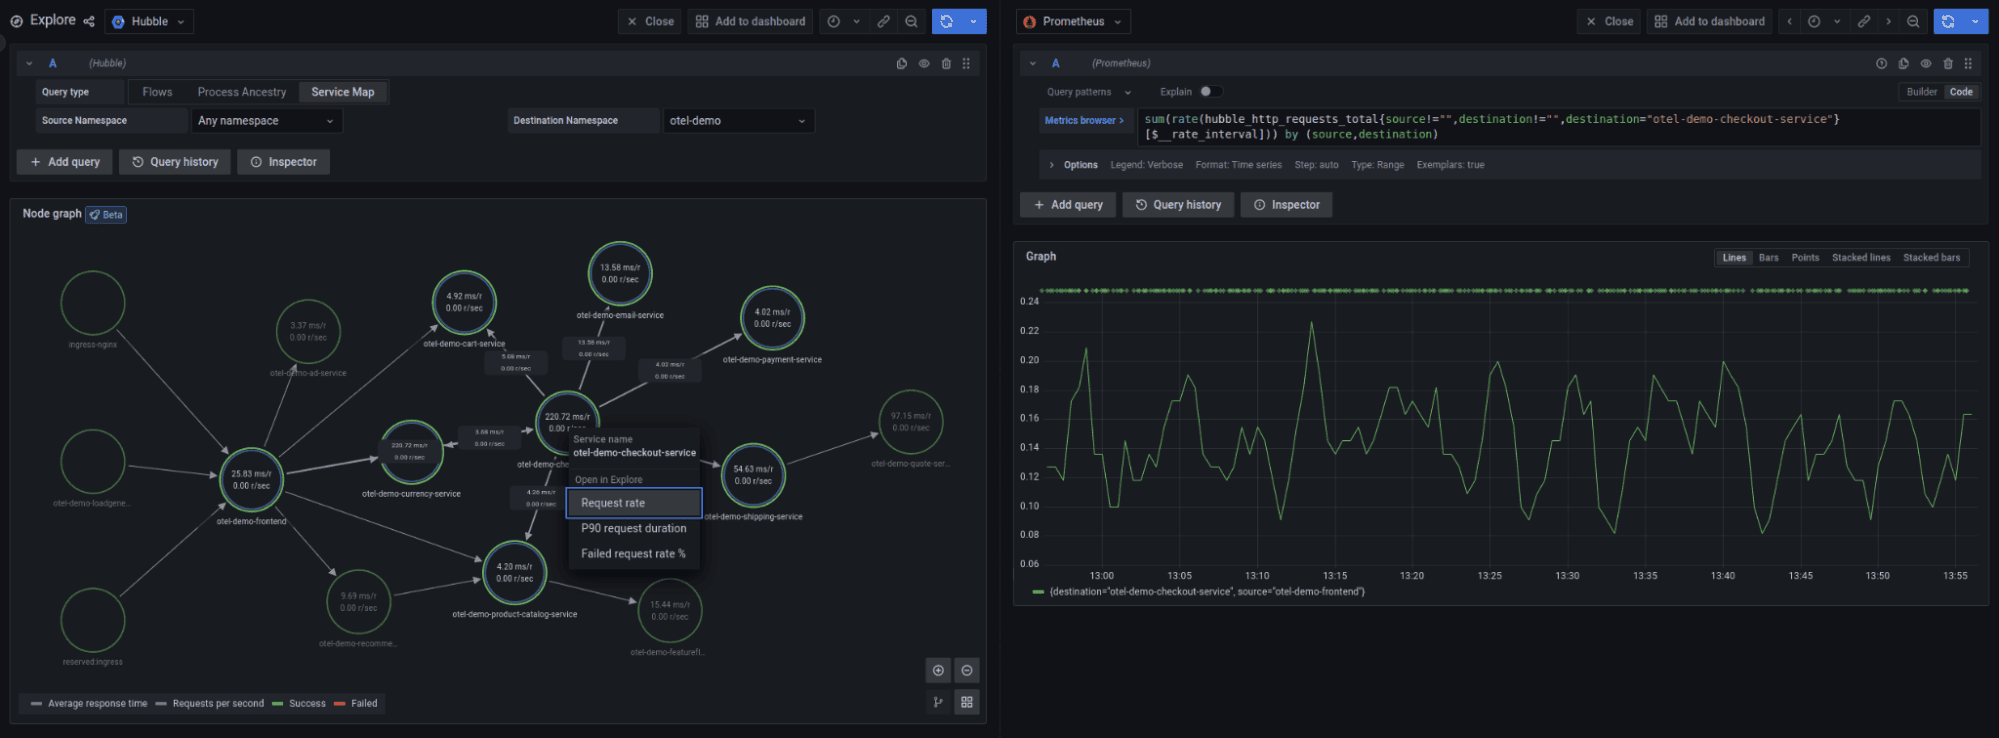
The inspiration for the last feature, the HTTP service map, came from Grafana Tempo. Tempo has a “traces to metrics” feature that aggregates distributed traces as Prometheus metrics. In a similar vein, Hubble aggregates network flows as metrics that can be visualized with the Prometheus data source. But what caught our eye was the service map provided by Tempo, using the node graph visualization. The Tempo service map is rendered using Prometheus metrics. We decided to do the same thing — transform Hubble HTTP metrics into a graph.
Our service map visualizes all HTTP traffic flowing through a Kubernetes cluster. You can choose between a global cluster view and a single namespace view. The map’s granularity is configurable on the Hubble side, and depending on your requirements, you can have a node per pod, IP address, Kubernetes workload or Kubernetes label. In addition to the graph visualization, the service map displays RED statistics about the HTTP traffic: requests per second, errors rate, and average request duration.
What’s next for Hubble and Grafana?
The process of developing a data source plugin was really smooth for us. Despite our lack of experience in Typescript (most of us are Go developers) we managed to ramp up quickly thanks to the Grafana tooling for plugin developers. The feedback we received from the Grafana Labs team was also incredibly helpful.
The story by no means ends here. The Hubble data source plugin is currently published in the beta stage, and we are actively developing it. We are working on extending the existing functionality, such as additional filters for the flows query or the service map as well as adding completely new features.
One of the things on our roadmap is support for Hubble Relay, which streams live network flows from a Kubernetes cluster. This feature will make the flows query available for Cilium open source users who don’t store events in Hubble Timescape.
We are more than happy to receive feedback and discuss new plugin features in our Slack community. Give the Hubble data source plugin a try and join the conversation in #grafana channel in Cilium & eBPF Slack!
Grafana Cloudis the easiest way to get started with metrics, logs, traces, and dashboards. We recently added new features to our generous forever-free tier, including access to all Enterprise plugins for three users. Plus there are plans for every use case. Sign upfor free now!

