Monitor the past, present, and future of your Kubernetes resource utilization
Greetings, Kubernetes Time Lords! Through a series of recent updates to our multi-purpose Kubernetes Monitoring solution in Grafana Cloud, we’ve made it easier than ever to assess your resource utilization, whether you’re looking at yesterday, today, or tomorrow.
All companies that use Kubernetes, regardless of size, should monitor their available resource utilization. If a fleet is under-provisioned, the performance and availability of applications and services are at serious risk. On the flip side, fleets with over-provisioned resources run the systemic risk of wasting money and resources that could be better applied elsewhere.
At Grafana Labs, we’re focused on helping users aim instead for that Goldilocks scenario — optimal resource utilization that results in a reliable, performant, and economical infrastructure and software. To do so, we give you a bird’s eye view of your Kubernetes resources in real time, as well as capabilities to forecast future resource usage and look at historical resource utilization as well!
It’s pretty exciting stuff, so let’s take a look at each of these use cases and how Grafana Cloud users can get better control over their efficiency by monitoring the past, present, and future of their resource utilization.
Resource utilization in the present
There’s no time like the present, so let’s start with today. With Kubernetes Monitoring in Grafana Cloud, you can take actions that affect system performance and costs right now. By keeping tabs on resource utilization, your team can better identify stranded resources, bottlenecks, or even potential outage risks so you can quickly respond to problems as they arise.
Additionally, teams can save on their Kubernetes costs by quickly taking action on under-utilized resources. By using what is available more efficiently, teams can reduce waste and minimize the need to purchase additional resources. This can help teams stay within budget and reduce project costs.
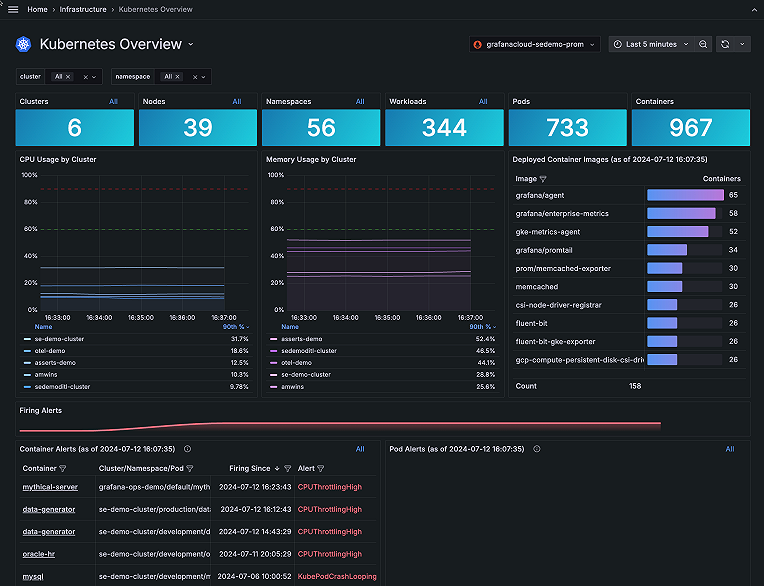
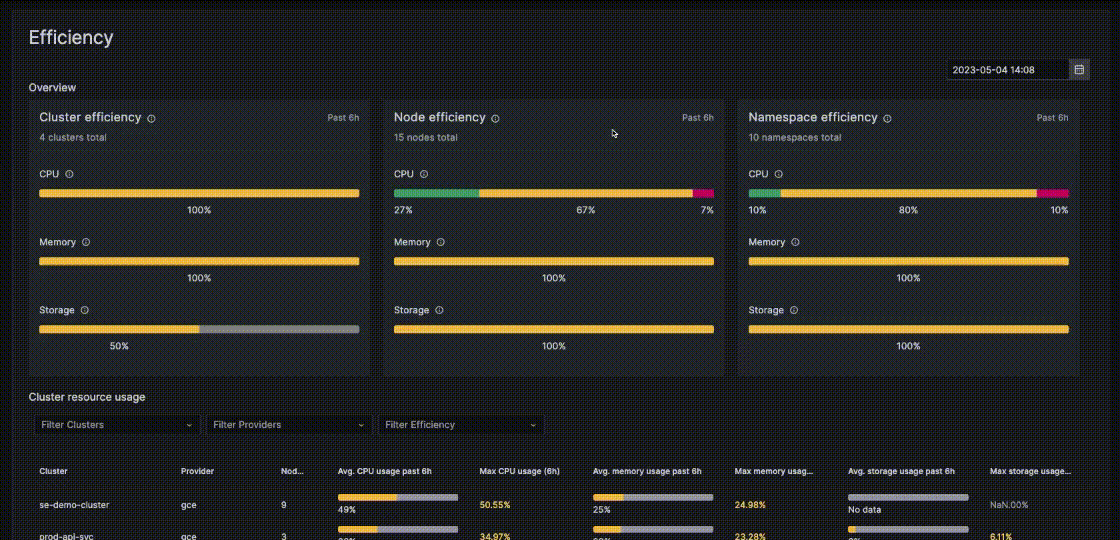
With the Kubernetes Monitoring solution in Grafana Cloud we’ve taken an approach toward visualization that enables you to have a bird’s eye view and a resource-specific perspective. This is important because teams need to quickly understand the entire state of their Kubernetes fleet while also being empowered to drill down and optimize their resource management. You can find all this information in the Efficiency overview UI, which contains CPU, memory, and storage utilization visualizations from cluster to namespace.
Resource utilization in the past
It’s safe to say Shakespeare wasn’t thinking about Kubernetes when he wrote the famous line, “What’s past is prologue,” but that doesn’t mean we can’t apply that same sentiment to modern software infrastructure. Engineers in the present are better able to identify areas for improvement when they can also look back at the state of a fleet’s resource utilization. Historic utilization helps establish benchmarks, which can then help teams set targets for future resource utilization efficiency.
We’ve recently introduced new functionality that allows users to select a historical timestamp — be it five minutes in the past or even one month — and visualize the entire state of their fleet’s resource utilization. This even includes resources that are no longer provisioned. Simply select the date in time you’d like to review from the time picker in the upper right hand corner. Then browse your fleet’s efficiency just like you would if you were monitoring in real-time.
Resource utilization in the future
No need for a crystal ball — you can use Grafana Cloud’s predictive intelligence capabilities to run CPU and memory forecasts that give your team prophet-like resource management capabilities.
By forecasting resource utilization efficiency, teams can determine how much of a particular resource will be required for a given project or activity. This insight allows for better planning, budgeting, and cost estimations. More information means teams make better choices regarding resource allocation and infrastructure set up. Ultimately, the power to forecast resource utilization allows organizations to make adjustments proactively to improve efficiency and reduce waste.
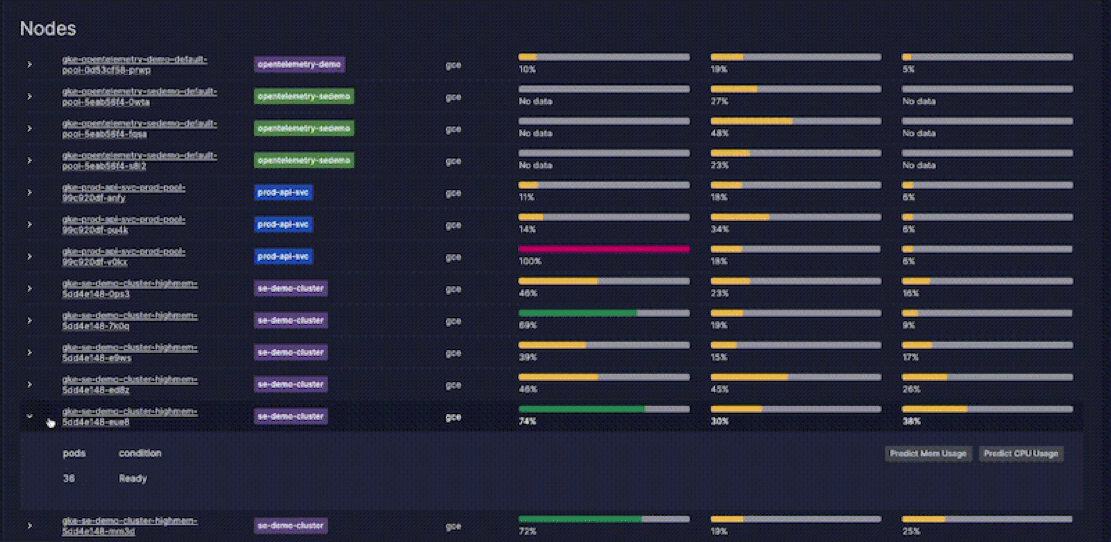
To run resource utilization forecasts, select a specific node or pod and expand it in the cluster navigation mode. Then simply predict memory or CPU usage. In just a matter of moments the forecast is returned with the upper and lower bounds included. It’s as easy as that.
Combining the past, present, and future
Now that we’ve shown you all the time-traveling ways to use Grafana Cloud, let’s consider a hypothetical scenario that combines all the capabilities we’ve discussed so far.
Let’s say a Kubernetes Monitoring user has started a new service — a counter for loyalty points after every purchase on an ecommerce site. This service is placed in one single node or cluster. Eventually the ecommerce business becomes really popular, which is great! However, Customer Support starts receiving complaints that the site is running too slowly and the user sees services across the business are not performing well, even if the current usage is stable at around 80% CPU.
The user is able to go back six hours in time and see spikes of 150% CPU. Then, by running a forecast she is able to see that with this usage trend that all other apps running on the same node will suffer in a matter of days due to under-provisioning. As a result, she’s able to use that historical and predictive data so she can take actions to address the problem today.
Bonus points for using k6 to preemptively stress test resources
The resource forecasting capabilities we already discussed can be incredibly helpful for mapping out future costs, but it’s still difficult to predict the unknown unknowns that pop up in real life, such as traffic spikes. Luckily, Grafana Cloud k6, Grafana’s load testing application can provide useful insight into how your infrastructure will react when load is thrown at it. Additionally, k6 is helpful with identifying the best scheduling policies for your Kubernetes pods. This can help you ensure that resources are being utilized efficiently and reduce the risk of resource contention.
Use k6 to perform load testing on your Kubernetes applications to identify performance bottlenecks and where resources are being underutilized or overutilized. After adding pressure to a few nodes, visualize those tests as exemplars in Kubernetes monitoring afterwards to get a more complete picture of the state of your fleet’s efficiency.
Start getting the most out of your Kubernetes resources today
Monitoring Kubernetes resource utilization on Grafana Cloud can help users optimize their resource management practices which in turn means a more reliable infrastructure, improved application performance, and reduced costs. Besides multiple efficiency capabilities, Kubernetes Monitoring also is used by teams of two to 2,000 for turnkey Kubernetes observability and enhanced cluster triaging workflows. Sign up for a forever-free account of Grafana Cloud and immediately experience the benefits yourself or learn more about the solution.