
How we improved Grafana’s alert state history to provide better insights into your alerting data
The Prometheus alerting model is a flexible tool in every observability toolkit. When enhanced with Grafana data sources, you can easily alert on any data, anywhere it might live, using the battle-tested label semantics and alerting state machine that Prometheus defines.
Often, engineers want to see patterns in their alerts over time, in order to observe trends, make predictions, and even debug alerts that might be firing too often. Gaining insights into the behavior of your alert rules is crucial for maintaining system health, reducing false positives, and bolstering confidence in your observability systems.
That’s why we revamped the alert state history system in Grafana Alerting from the ground up. You can now leverage the powerful querying capability of Grafana Loki, coupled with a redesigned and enhanced user interface, to analyze, track, and create dashboards around the behavior of your alerts in Grafana OSS, Grafana Cloud, and Grafana Enterprise.
Grafana alert state history: how it worked before
The primary purpose of tracking the history of alert rules is to later analyze how these rules have behaved over time. Think of it as keeping a log of the alerts’ activities. For example, if an alert is repeatedly switching between OK and Alerting, this could indicate that the alert’s threshold is too close to the normal range and needs to be adjusted.
In Grafana 9.0, as part of rolling out the new Grafana Alerting system, we introduced a simple engine that stores records of alert rules’ state changes. The UI then provided users with a list that reflected each alert rule’s recent state changes. This interface, however, was minimal; it was well-suited for simple scenarios where a rule did not generate many alert instances and there were only a few labels involved.
But with the enhanced flexibility of Grafana Alerting in Grafana 9.0, it quickly became apparent that the UI was inadequate. State changes for complex alert rules, which generated a large number of alert instances, were challenging to monitor. Additionally, the list of state changes displayed for the user did not effectively illustrate how these changes occurred over time.
The original alert state history system was built using the Annotations API, a feature in Grafana that allows for storing small amounts of metadata about events occurring within the system. The advantage of this approach was its simplicity — the storage infrastructure was already established, and the API was ready to use.
However, this approach had its limitations in terms of flexibility and performance. We were constrained to the data format dictated by the API, which then restricted our ability to incorporate additional data for in-depth analysis. Moreover, as the use of Grafana Alerting increased, performance issues began to surface. Specifically, we started receiving feedback regarding the subpar performance of write operations to the annotations.
With all of these issues in mind, we decided to develop a better version of Grafana’s alert state history.
The challenges of storing state changes of alerts
Soon after the release of 9.0, we undertook an effort to improve the efficiency of how Grafana Alerting utilizes its SQL database. Although we made some big improvements in this area, one area that continued to be a source of problems was the annotations table behind the Annotations API.
We noticed that these problems tended to be more pronounced when using multi-dimensional rules with very high cardinality. That is to say, if a rule generates many alert instances with many different label-sets, records for each of those instances need to be individually inserted to the annotations table. Even with batched writes, we found the overall level of churn on this table to be unacceptably high.
On top of that, we found it difficult to query the annotations with the granularity we wanted. Grafana Alerting follows the Prometheus alerting model, which means that each alert might have a set of arbitrary key-value pairs called labels that we want to filter on.
This is a notoriously tricky problem to solve in SQL at scale. The star schema is a common pattern, but adopting this would have resulted in even more database writes, which would only compound the existing write pressure. Furthermore, the current annotation table posed several difficulties in constructing granular queries. It primarily consists of simple metadata, encoded into a human-readable string format. Many of the additional fields in the annotations table were also highly specific to Grafana dashboards, and they largely went unused by the Grafana Alerting system.
Lastly, the retention scheme used by annotations often proved to be inadequate. To keep the database size manageable, we only store up to a certain number of annotations. Any additional writes beyond that result in the oldest annotations being deleted. However, for high cardinality alerts, this cap was far too restrictive. Users with many rules would see their state history only lasting for a day or so before being deleted. Furthermore, other components inside Grafana use annotations as well, in addition to Alerting. As a consequence, we effectively competed with these other components for portions of the overall annotation limit, often leading to unexpected data deletions in various areas unrelated to alerting.
Introducing Loki to Grafana alert state history
We set out to design a new way to store the event log of alert state transitions. Luckily, Grafana Labs maintains a database that’s built for logs — hello, Grafana Loki!
Loki cleanly solves many of the problems we face with the current SQL implementation. LogQL, Loki’s expressive and powerful query language, is designed to easily filter arbitrarily shaped data. It can be used to filter state history logs with a surprising level of granularity, allowing for new insights that can’t be obtained with the old system. For example, you can now filter alerts by individual labels, states, values, and errors. You can also derive metrics from the logs, which allows you to graph changes over time, do statistical analysis, and compare trends. (Check out more examples below.)
Loki also has excellent performance characteristics for ingesting large amounts of logs in bursts, which is perfect for even the largest Grafana Alerting users out there. Its time-based retention scheme also works to our advantage: When using Loki to store state history logs, we are able to finally guarantee a fixed retention time that is as high as 60 days in Grafana Cloud.
Easily manage multiple storage backends
Grafana’s flexibility and ability to run anywhere is key, and we strive to ensure it remains just as easy to run. Not everyone can run a Loki instance as a dependency for their Grafana installation. Nonetheless, we still wanted to keep the new alert state history squarely within Grafana OSS.
To address this issue, we introduced multiple pluggable storage backends for alert state history that can be toggled via the Grafana configuration file. By default, OSS users will continue using the existing SQL-based storage backend for alert states. However, if you have a Loki instance you’d like to store alert state history in, the option to connect Grafana to it is now available! Migration can be complex, so we have also added support for modes that leverage multiple storage backendssimultaneously. This enables writing to both SQL and Loki while reading from just one of them, streamlining the testing and transition to the new system.
If you’re a user of Grafana Cloud, there’s no need to worry! All Grafana Cloud instances now come equipped with a preconfigured Loki backend that’s separate from Grafana Cloud Logs. Additionally, we provide you with a brand new alert state history Loki data source, enabling you to explore and build dashboards against your alert history.

The updated UI for Grafana alert state history
With the new storage engine and API in place, we worked on UI enhancements that leverage the new backend features. Our goal was to provide a comprehensive overview of alert rules’ state changes over time, with a particular emphasis on visually representing these changes on a timeline. All of this with a strong focus on multi-dimensional alert rules.
We recognized that by using a timeline representation of state changes alone, we wouldn’t be able to provide as many details about each change as we desired. Therefore, we opted to create a view that offered both—a sleek timeline representation of state changes linked to a log of changes that can provide more detailed information.

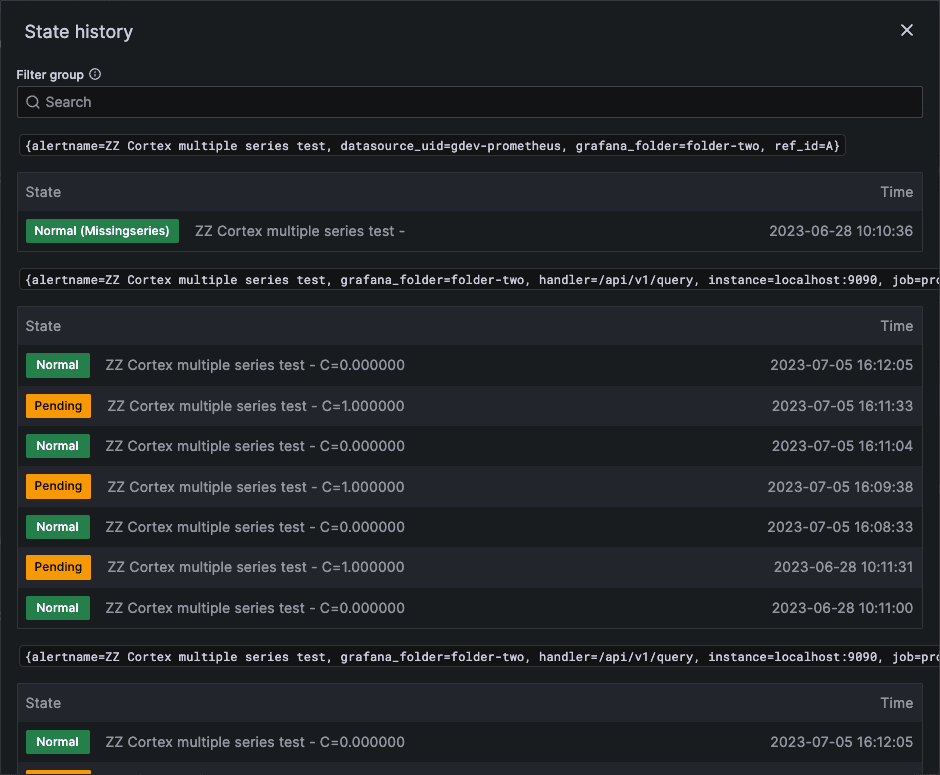
The new UI is comprised of two sections:
- Timeline displays how alert instances have changed their states over time, providing users with a snapshot of the alert rule’s behavior over a period.
- Log record groups alert instances’ state changes by timestamp, making it easy to observe which instances underwent state changes simultaneously.
Hovering over the timeline section will instantly display the corresponding log record for the specified timestamp, seamlessly bridging the two elements for a more cohesive analysis.
Unlimited possibilities with the Loki storage backend
LogQL’s flexibility also lets you do all kinds of custom analysis over your state history.
You can now query the history across multiple or all rules, based on the labels on your alerts. By combining this with metric queries you can leverage a particularly powerful pattern that lets you visualize trends in your alerts over time. For instance, if your alerts have a cluster label indicating the respective region they run in, you can use a query similar to the following to see the aggregated rate of alerts firing in that cluster across all rules:
sum(count_over_time({from="state-history"} | json | labels_cluster="prod-eu-west-3" | current="Alerting" [$__range]))
You can now perform regex queries on one or multiple alert properties at once:
{from="state-history", group=~"Website.*"} | json | labels_alertname=~".*Errors.*" | current=~".*MissingSeries.*"
The log stream also now includes the observed values from the alert, so you can even filter on values from query nodes. You can use this to find past alerts that were significant outliers, regardless of the actual rule threshold:
{from="state-history"} | json | current="Alerting" | values_B0 > 184000
In Grafana Cloud, we automatically provision a Loki data source containing this data. This lets you get started with experimenting how you can leverage this data, right out of the box! This makes it easier to get started creating your own custom queries, dashboards, and visualizations of your alerting data in Grafana Cloud.
Learn more about Grafana Alerting
Since we released the new Grafana Alerting experience in 9.0, Grafana Alerting is easier to use than ever. If you’d like to learn more, check out our Grafana Alerting documentation or our deep dive into Grafana Alerting from GrafanaCON 2022.
Finally, if you’d like to provide feedback on the alert state history feature, or if you’d just like to request a new feature for Grafana Alerting in general, please let us know! You can do this by opening an issue in the Grafana GitHub repository, or by asking in the #alerting channel in the Grafana Labs Community Slack.
Grafana Cloud is the easiest way to get started with metrics, logs, traces, and dashboards. We have a generous free forever tier and plans for every use case. Sign up for free now!

