How to visualize time series from SQL databases with Grafana
Relational databases like MySQL, PostgreSQL, Oracle, and others have a wealth of time series data locked inside of them. Often this data can be used to enhance observability dashboards, or keep track of important application factors, like how many users have signed up for a service.
In this article, we’re going to show you how to visualize any time series from any SQL database in Grafana using the time series visualization. In the process, you’ll learn about what kind of data the time series panel can visualize, and how to use SQL macros in Grafana.
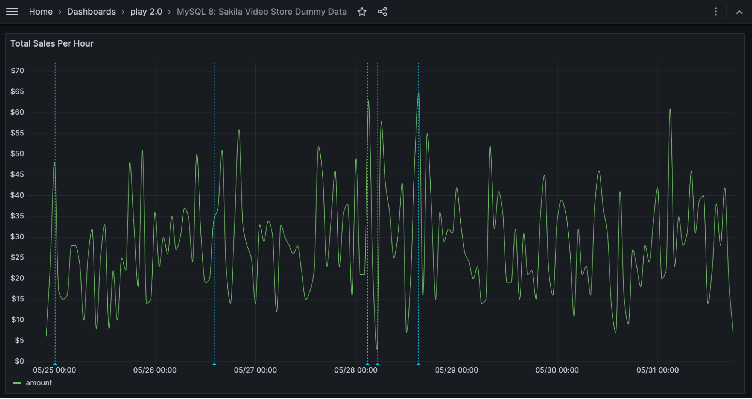
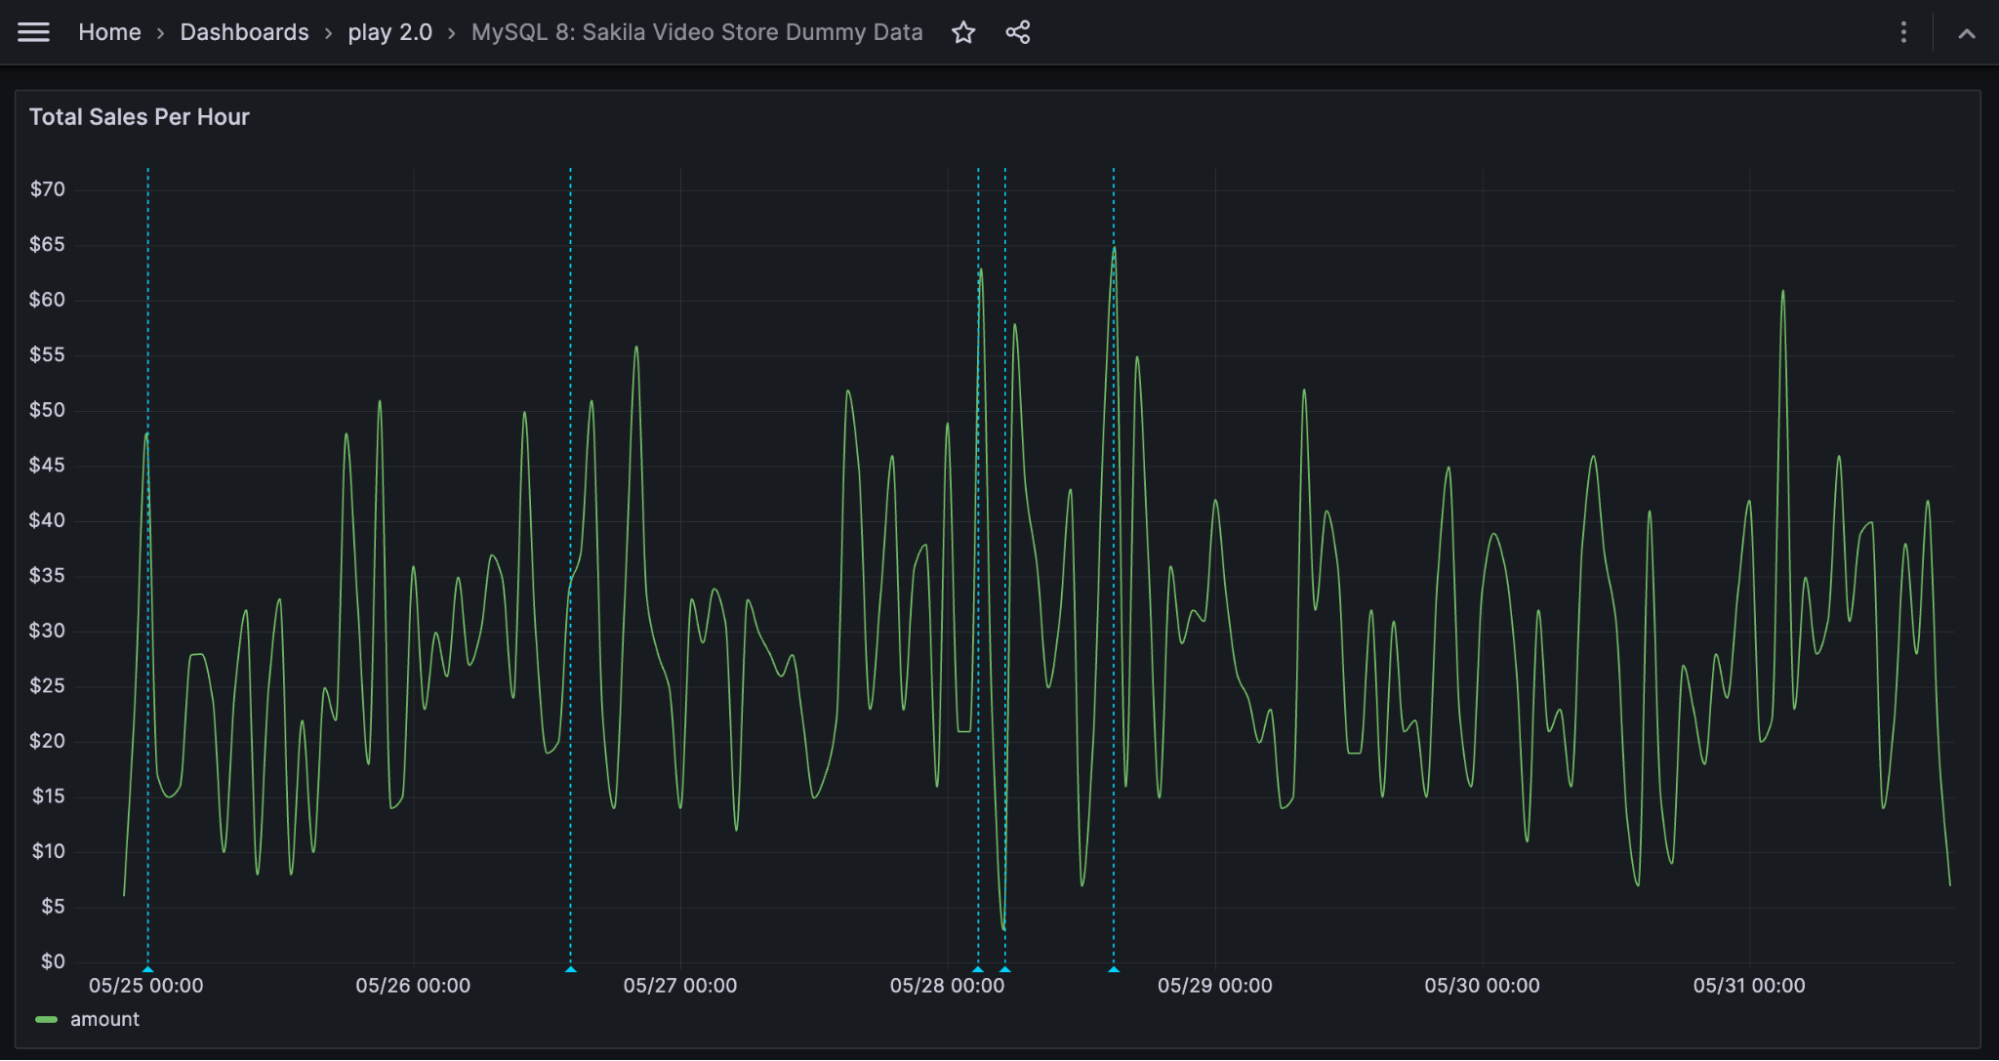
We will be building the following finished visualization. This example is real and running now. You can inspect it yourself on Grafana Play, a sample Grafana instance where we share sample dashboards and help teach people how they work.
Start with data
Let’s start with simple payment data from a video service, stored in MySQL. In the below screenshot, we’re simply running SELECT * FROM sakila.payment. The thing to note about this data is that it has an amount field, which is the metric we want to see in our time series, and it has a payment_date, which is a datetime field we’ll want to use. In general, the time series panel will look for columns that are of date/time types, or columns that look like UNIX times (seconds since the epoch).
You can follow our general example using any SQL dataset of your own, so long as it has some kind of numeric or metric field (like amount) and a datetime field (like payment_date).
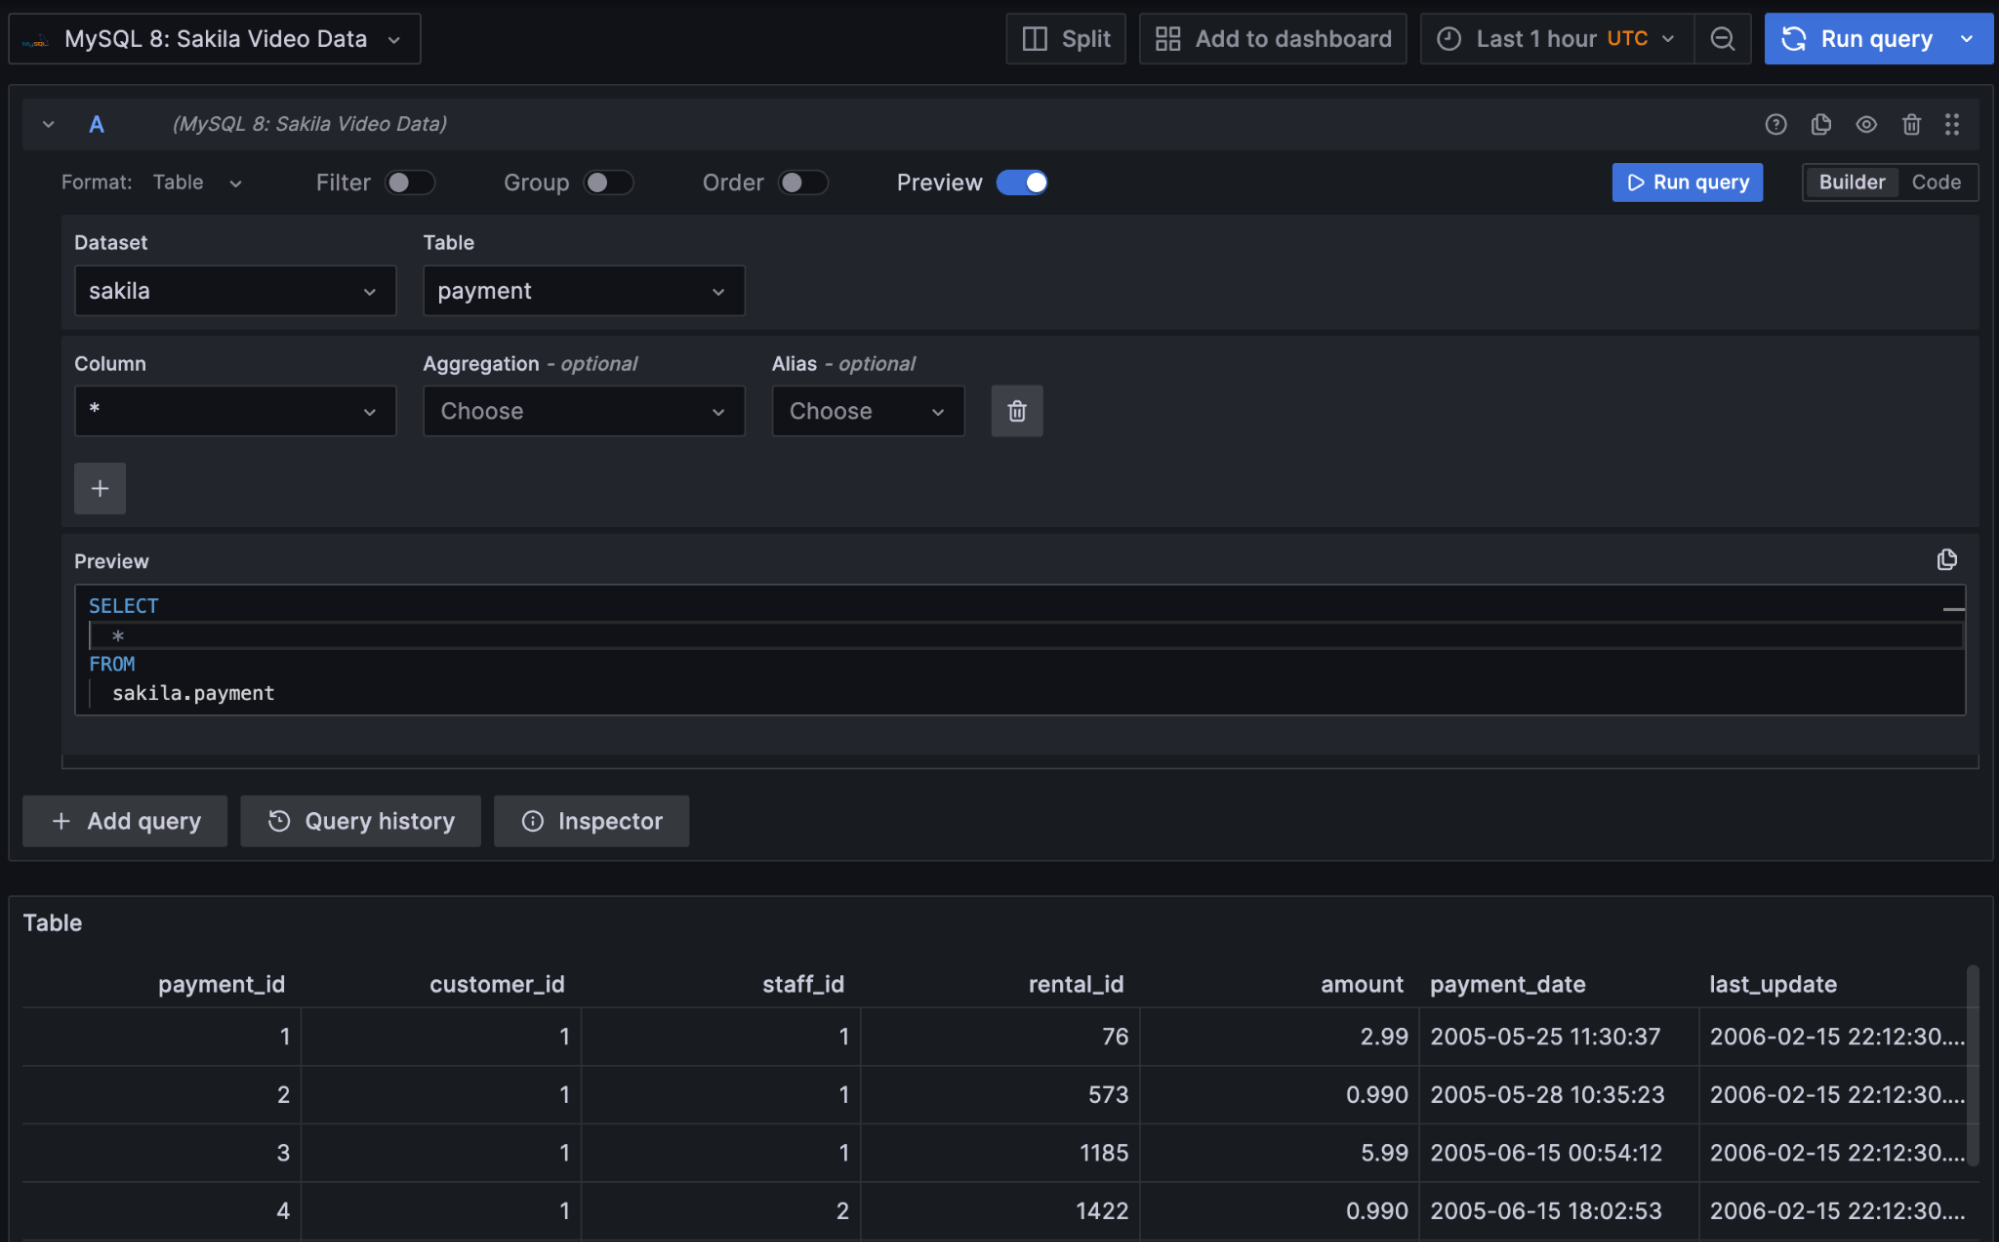
For the purposes of our example, we might not want to see every payment at every moment — it’s just too granular. Instead, we can aggregate those payments into blocks of one hour at a time, which will still give us sufficient data for our dashboard.
Query with macros
Writing SQL queries can be repetitive, particularly if you need to write many queries for different panels in a dashboard. And in the context of a Grafana dashboard, you need to take into account things like the time window the dashboard is covering (e.g., whether it’s the last five minutes or past two years).
Let’s start with a finished SQL query using all the appropriate macros, and then unpack what it’s doing and how it works. If you’re using a SQL database other than MySQL, most of the same macros are supported for others like PostgreSQL and Oracle. Consult the macros section of the documentation for your database data source.
SELECT
$__timeGroupAlias(payment_date, 1h),
sum(amount) AS "amount"
FROM payment
WHERE
$__timeFilter(payment_date)
GROUP BY 1
ORDER BY $__timeGroup(payment_date, 1h)
This is a fairly straightforward SQL query that is pulling just the payment_date and amount out of the table, which will become the X and Y axes of our time series, respectively. The magic is happening with the macros, which we will explain here piece-by-piece.
SELECT $__timeGroupAlias(payment_date, 1h)
This macro adds an alias for the column, and aggregates the time values into one hour (1h) blocks. This will expand into something like:
UNIX_TIMESTAMP(payment_date) DIV 3600 * 3600 AS "time"Notice that the column payment_date has been aliased as “time.” Because the value was turned into milliseconds-since-the-UNIX-epoch, we can group it by hour if we divide by the number of milliseconds in an hour.
WHERE $__timeFilter(payment_date)
This macro implements the date range of the overall dashboard. In Grafana dashboards, there is a time selector in the upper right section that controls the time slice shown for all panels on the dashboard. That time slice is passed into your SQL query using this macro. This will get expanded at runtime into something like:
payment_date BETWEEN FROM_UNIXTIME(1116957786) AND FROM_UNIXTIME(1117563747)Those long UNIX time numbers will be passed from whatever your dashboard settings are, and your database will automatically chop down results into only the relevant time filter.
ORDER BY $__timeGroup(payment_date, 1h)
This simply ensures that the data comes back in the right order, by ordering it in the same grouped fashion as in the SELECT statement. This will get expanded at runtime into something like:
ORDER BY UNIX_TIMESTAMP(payment_date) DIV 3600 * 3600This is very similar to the SELECT clause. It doesn’t include the alias column name, but it’s the same concept.
Putting all of those pieces together, here’s what the full SQL query looks like, after all macros are expanded:
SELECT
UNIX_TIMESTAMP(payment_date) DIV 3600 * 3600 AS "time",
sum(amount) AS "amount"
FROM payment
WHERE
payment_date BETWEEN FROM_UNIXTIME(1116957786) AND FROM_UNIXTIME(1117563747)
GROUP BY 1
ORDER BY UNIX_TIMESTAMP(payment_date) DIV 3600 * 3600
These macros have two useful benefits:
- You never have to worry about the time range on the dashboard; it’s automatically updated.
- You can quickly change the aggregation (from 1h to 2h, for example) without touching most of the query.
Debugging your queries with macros
When you go to write your own queries, sometimes you’ll make mistakes with macros. In the below screenshot, I’ve intentionally made a mistake, trying to alias my column AS thisWontWork.
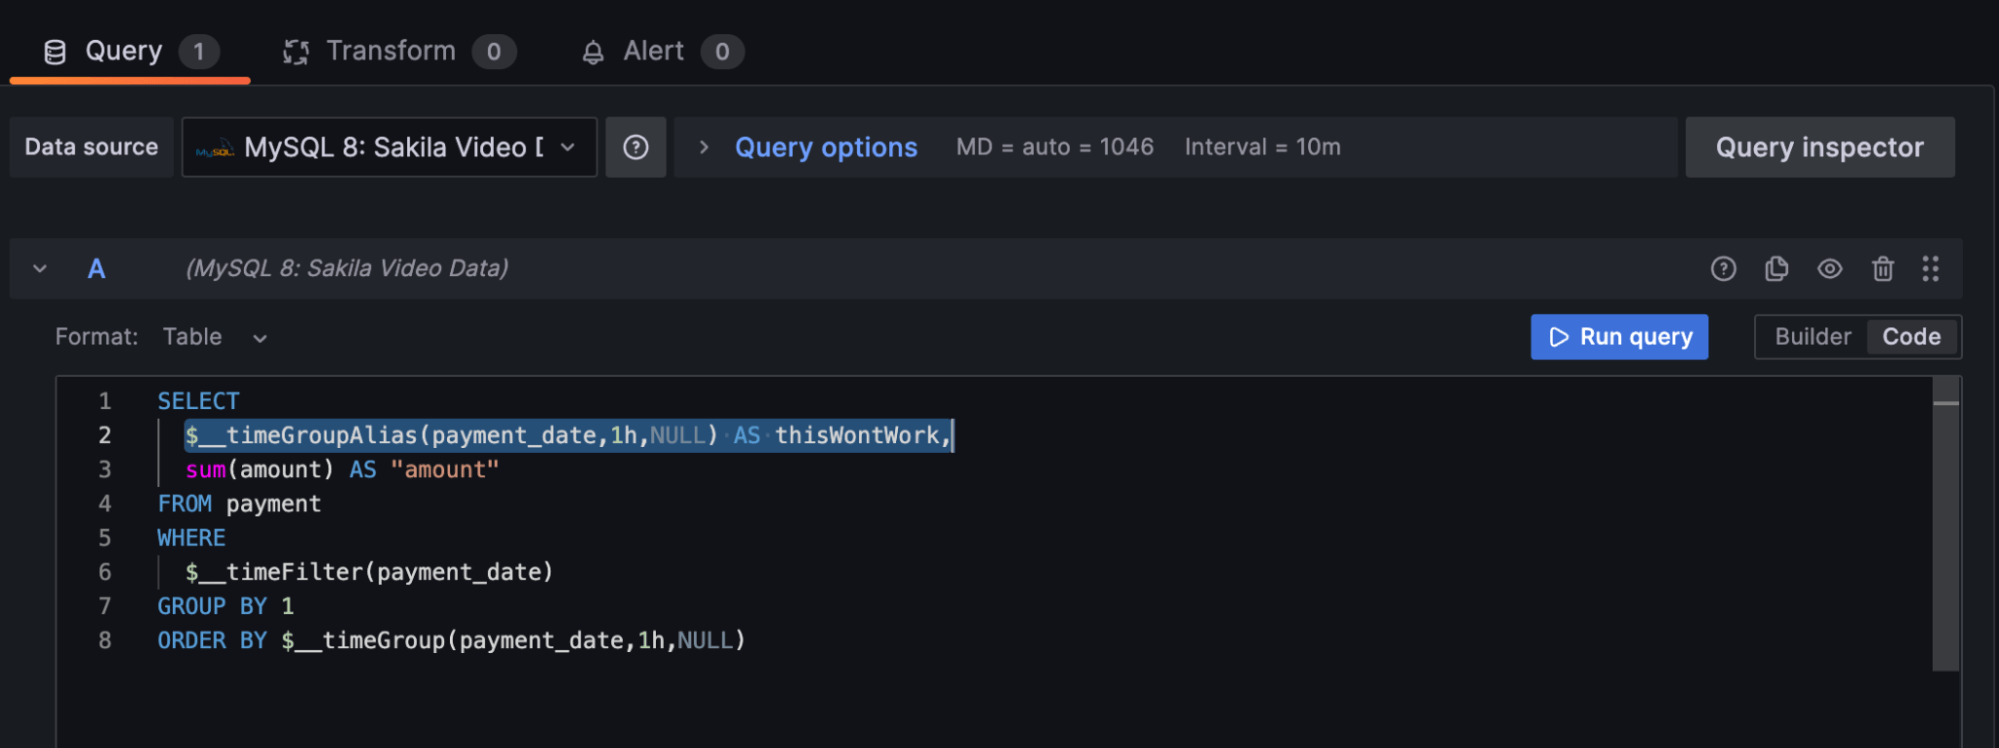
Sure enough, it doesn’t work; running this query fails with this message:
db query error: Error 1064: You have an error in your SQL syntax; check the manual that corresponds to your MySQL server version for the right syntax to use near 'AS thisWontWork, sum(amount) AS "amount" FROM payment WHERE payment_date BET' at line 2To proceed, we’ll click Query Inspector in the top right. This shows us the full expansion of the SQL query, which looks like this:
SELECT
  UNIX_TIMESTAMP(payment_date) DIV 3600 * 3600 AS "time" AS thisWontWork,
  sum(amount) AS "amount"
Sure enough, that won’t work because you can see that I am double-aliasing the column; the macro alias is clashing with my manual alias. This makes it easy to see where queries are going wrong and where to fix them.
Visualizing a time series
The Grafana time series visualization panel documentation contains all of the options you can use.
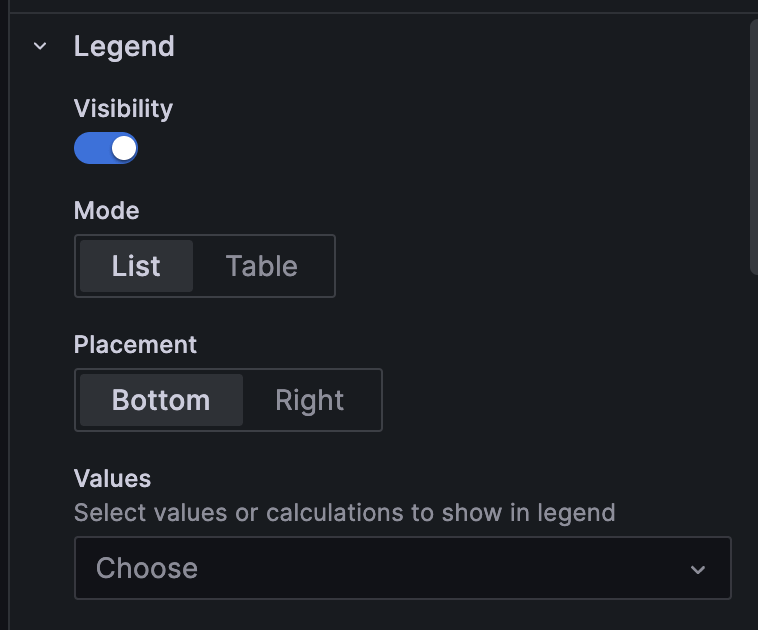
In the case of our payment data example we started out with, we used the default options, with two exceptions for visual appeal and specificity. Namely, we configured the panel title:
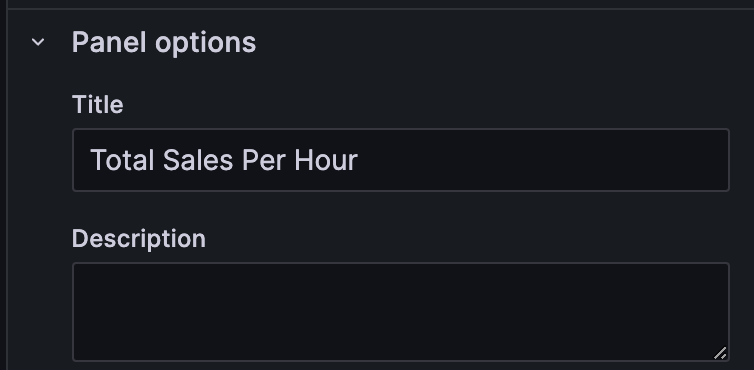
And made the legend visible:
Common errors and troubleshooting
The most common error in building this type of visualization will be a query that does not run correctly and fails to return data. Sometimes this can be a subtle error in the SQL, and you will usually see a db error at the bottom of the run window, and no data at all displayed in the visualization.
In the screenshot below, a subtle error has been made in the SQL that caused execution to simply fail without a good error message. To clean up your queries and get back on track, try tweaking the query and/or running it in Explore mode to see what was actually executed. You can also use the Query Inspector feature discussed earlier to help understand and troubleshoot your queries.
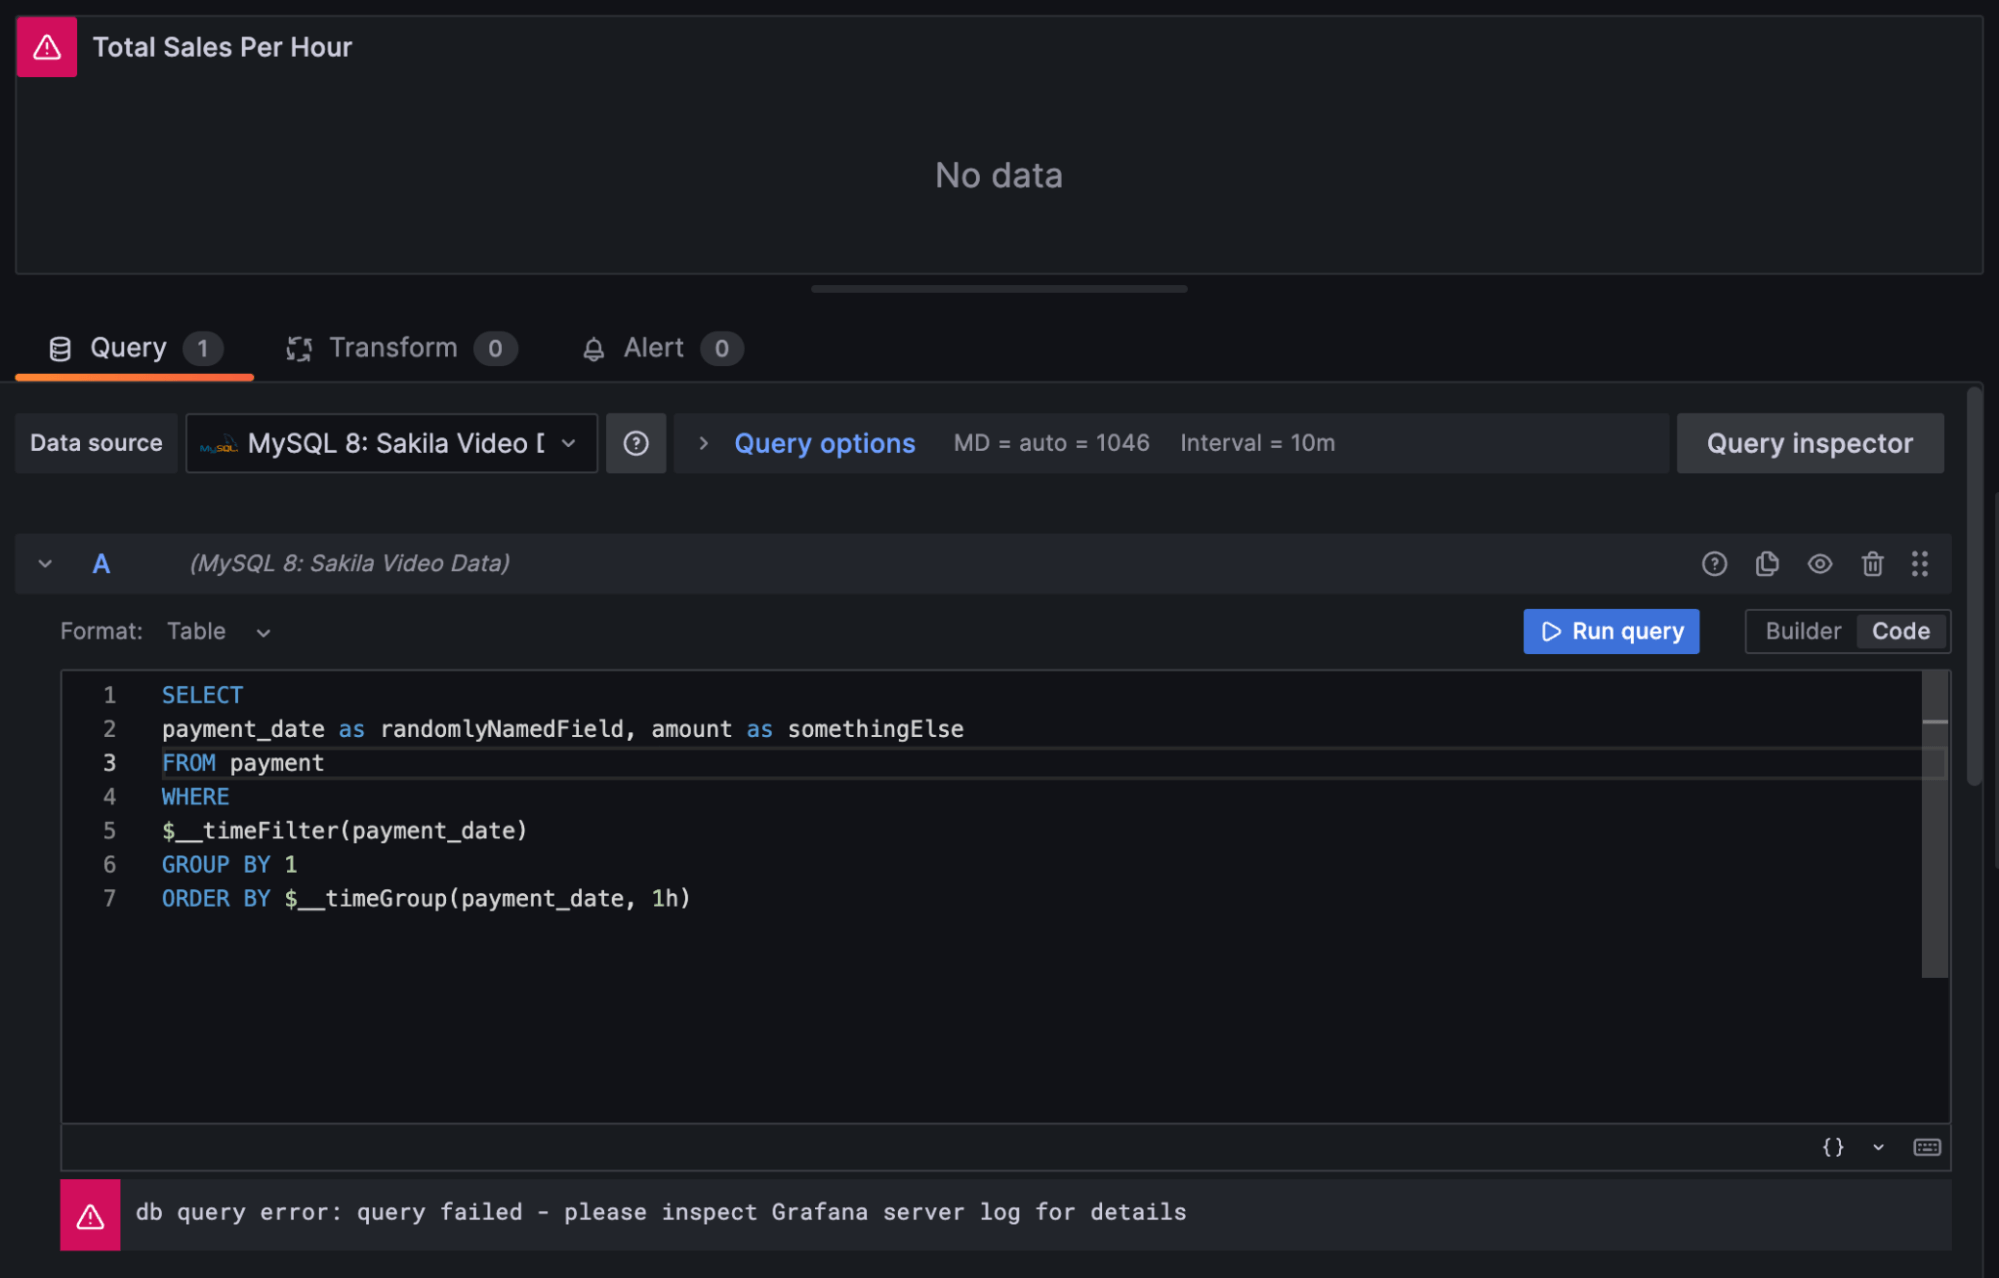
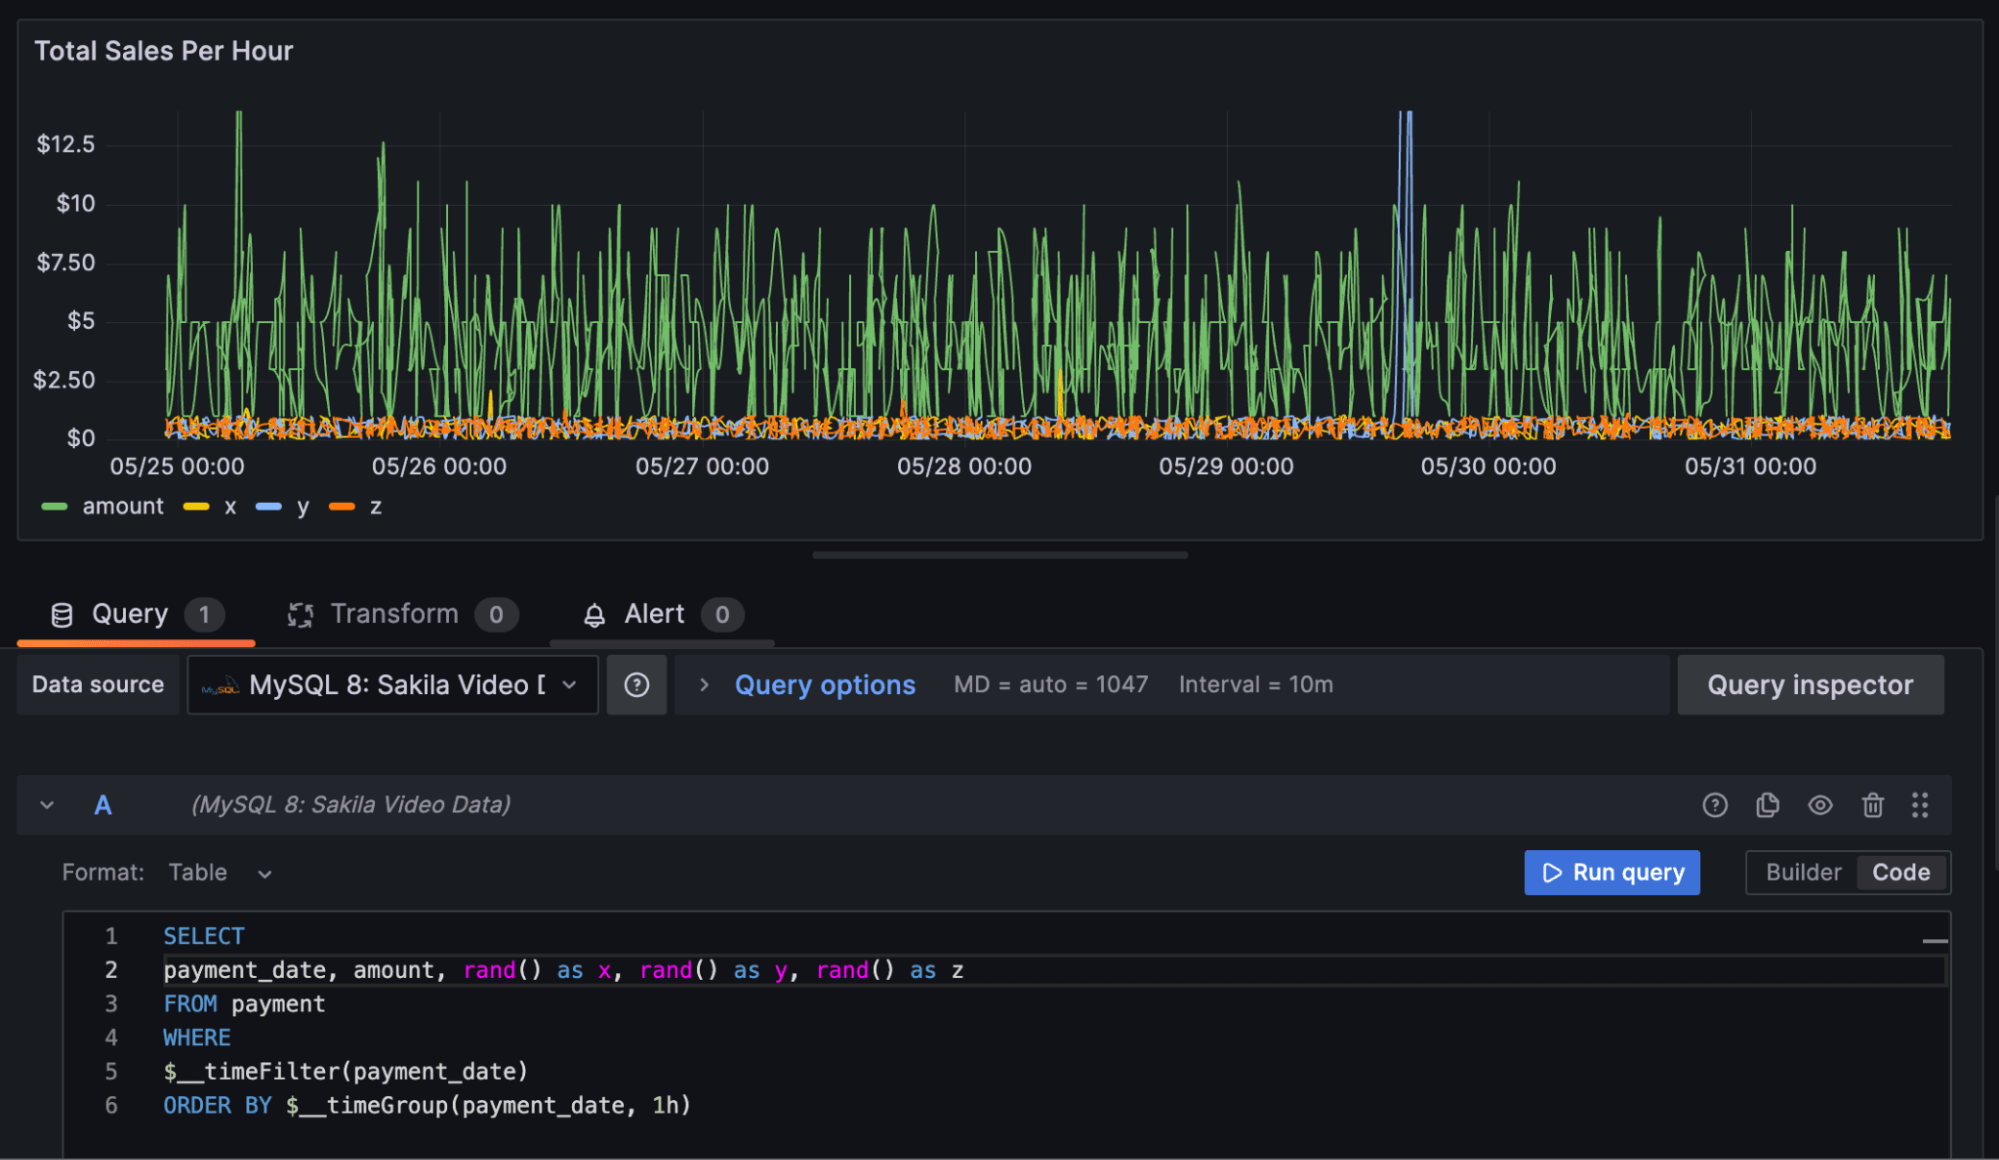
Another common error is returning too much data, or extraneous columns. Here, I have generated random numbers just to add “noise” to the query. You’ll notice that the time series visualization does its best to make sense of the data, yet it just looks like a mess; and random numbers aren’t the same kind of metric as dollars.
It’s best to keep your SELECT clause very compact and to the point. You want to make apples-to-apples comparisons and not mix data types, which will keep the visualization easy to read.
Adapting this example to other use cases
Because Grafana comes with a flexible architecture of dashboards, plugins, queries, and transforms, you can craft any kind of time series visualization you can imagine with the options we’ve covered in this article. It all starts with a simple SQL query and the use of some macros that will make sure your query performs well and is tailored to your dashboard’s designated time range.
The same basic techniques apply to all SQL databases, so whether you are on MySQL, PostgreSQL or any other relational database, you can inspect this example on Grafana Play and use it as a reference while you are building your next query.
Grafana Cloud is the easiest way to get started with metrics, logs, traces, and dashboards. We recently added new features to our generous forever-free tier, including access to all Enterprise plugins for three users. Plus there are plans for every use case. Sign up for free now!

