How Ultimate improved workflow, adoption, and more with Grafana IRM
“So you get paged and wake up in the middle of the night, you don’t know what’s going on, and there you are needing to figure things out — What kind of tabs do I need open? Where do I find the logs? Where are the dashboards and the metrics?”
If you’ve ever been on call, this refrain, voiced by Alexander Rösel, Senior Software Engineer at Ultimate, will sound all too familiar. Engineers are often left scrambling when an incident happens, juggling multiple tools and switching back and forth in a mad dash to get things fixed.

That’s exactly what led Ultimate to reevaluate its incident response management (IRM) stack. Their industry-leading customer support automation platform helps companies to improve customer satisfaction and increase efficiency with AI. Ultimate’s incident response, however, was anything but automatic prior to adopting Grafana Cloud.
In this Q&A, which has been edited for clarity, Rösel and his colleague Shashi Ravula, Platform Engineering Manager, discuss why Ultimate moved to Grafana Cloud for IRM and how those efforts were spearheaded by their interest in Grafana OnCall. They share how the migration has translated to better workflows, more adoption, and improved communication among a 20-person team of developers and engineers that split on-call debugging duties, as well as how Grafana Cloud’s ease of use and functionality has led to teams across the company getting value out of the stack.

What was it that initially attracted you to Grafana Cloud?
Rösel: I got super interested when Shashi talked to me about Grafana OnCall. We already had Grafana as an open source tool internally, but it wasn’t heavily used because we had dashboards and logs and on-call stuff spread across many different applications. And that led to a lot of overhead for us developers on call.
Ravula: We knew we wanted to move to Grafana Cloud, and there was also the whole point of cost optimization, too. We were spreading our money across multiple different tools and [the system] was indeed doing its job, but it took a lot of cognitive load for developers to actually understand all of those tools. There was a learning curve and there wasn’t enough documentation in one place.
How has adopting OnCall helped?
Rösel: Since we’re inside the Grafana ecosystem, when we get an alert, we can attach dashboards and widgets to them. So all of these kinds of things, all the automation around OnCall, it really helps us.
It’s really good to have a consistent way of handling incidents. We know that if you declare an incident, there’s an incident channel in Slack that people join automatically because it’s announced in the global channel where everyone else is. Updates are regularly posted from Grafana OnCall to Slack, so we don’t need to run around and keep everyone updated on the process. And then Grafana Incident makes sure that everyone else can pull the information wherever they are, whether it’s Slack, email, or in the Grafana interface directly, and that’s definitely made a huge impact.

And so the broader Grafana Cloud ecosystem has played into this as well?
Rösel: I noticed that when I’m on call and I get the alert, I’m way more assured about whether it’s us or a third-party provider we integrate with, because we have the logs, we have the metrics now, and people started to build a lot of dashboards. We can see people are using it more, asking for more and more introductions: How does PromQL work? How does LogQL work? And even from non-programmers. People are super interested because it really helps us understand our system better.
Ravula: Part of the appeal of Grafana Cloud was the idea that we can have all of those things in one suite, so it will be very easy for developers to navigate through the dashboard and OnCall and get those metrics right next to the logs and traces.
You’re seeing interest outside of the engineers?
Rösel: Customer Success was able to just get in and build their own alerts. They created alerts for their bots so they knew when some of the customer reports acted up or had some elevated error rate, instead of being reactive and only replying when the customer says something seems off.

How has the adoption been among the technical teams?
Ravula: We want to be a very lean platform team where we enable our product teams to self service but don’t handhold them throughout everything. And at some point after the introduction of Grafana Cloud, there was a change in culture where they were saying, “We can build it ourselves.” And the example Alex gave was really crucial because sometimes we felt like the Customer Success teams were more engaged with Grafana Cloud — and Grafana Alerting, specifically — than the engineers themselves. And it put pressure back on the engineers saying, “Hey, when these people are doing their own stuff, why can’t we do it and make it our platform much better?”
By the numbers
Dashboards
- Old system: ~20
- Grafana Cloud: 70
Active users
- Old system: ~15
- Grafana Cloud: ~50
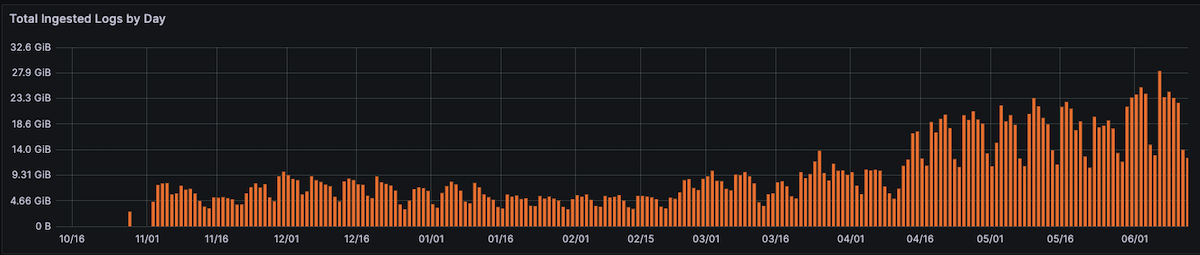
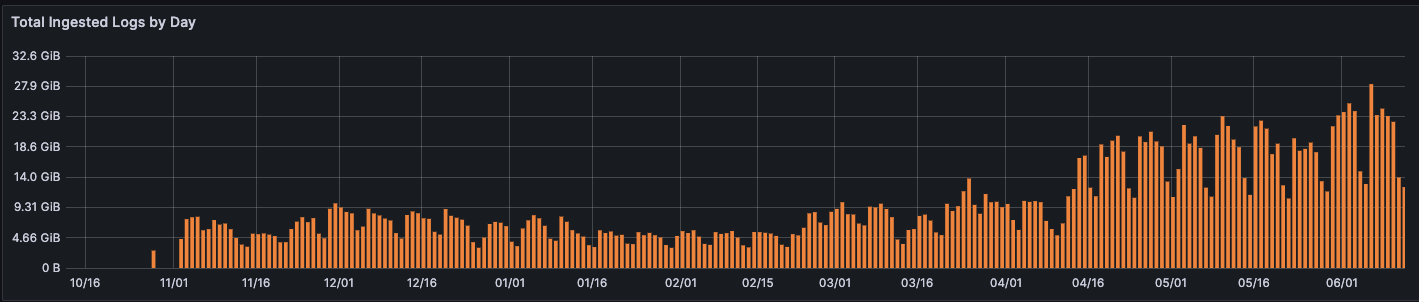
Log volumes
- Old system: 7.8GB (with fluctuations)
- Grafana Cloud: 28GB
Data sources
- Old system: 1
- Grafana Cloud: 22; including Google Cloud Logs, Google Cloud Monitoring, Github stats and releases, Sentry issues, Apache DevLake, and more.
So what’s next for Ultimate and Grafana Cloud?
(Note: Ultimate currently uses Grafana Cloud Logs, Grafana Cloud k6, and Grafana’s IRM tools. Going forward, they’re looking to adopt Grafana Faro and to save costs on their Sentry APM service by pushing traces to Grafana Cloud Traces.)
Ravula: We are starting to launch Grafana Cloud Traces. This will become one of the most important value-adds because it’ll be the one of those pillars that was missing in our company for a long time for the observability stack. Once that’s there, we want to see where we can be more efficient with capacity planning or performance bottlenecks and troubleshooting and root cause analysis, which would even impact our MTTR and all of these other DevOps numbers.
We know that we are still not there at the maturity level we want to be for Observability — we also want to improve on the current framework of SLI, SLOs, and SLA side of things (we saw the demo about Grafana SLO), but as far as OnCall I think Grafana Labs is doing an amazing job responding to our requests on time and acting on our feedback immediately. We are very, very happy with that progress, and I’m sure that it’ll become a complete observability suite for incident management.
Grafana Cloud is the easiest way to get started with metrics, logs, traces, and dashboards. We have a generous forever-free tier and plans for every use case. Sign up for free now!