Build better PromQL queries with Grafana's metrics explorer
As more people and organizations adopt Prometheus and Grafana for observability, we at Grafana Labs want to make it easier for this expanding pool of users to answer questions about their systems, regardless of whether they’re experts or novices.
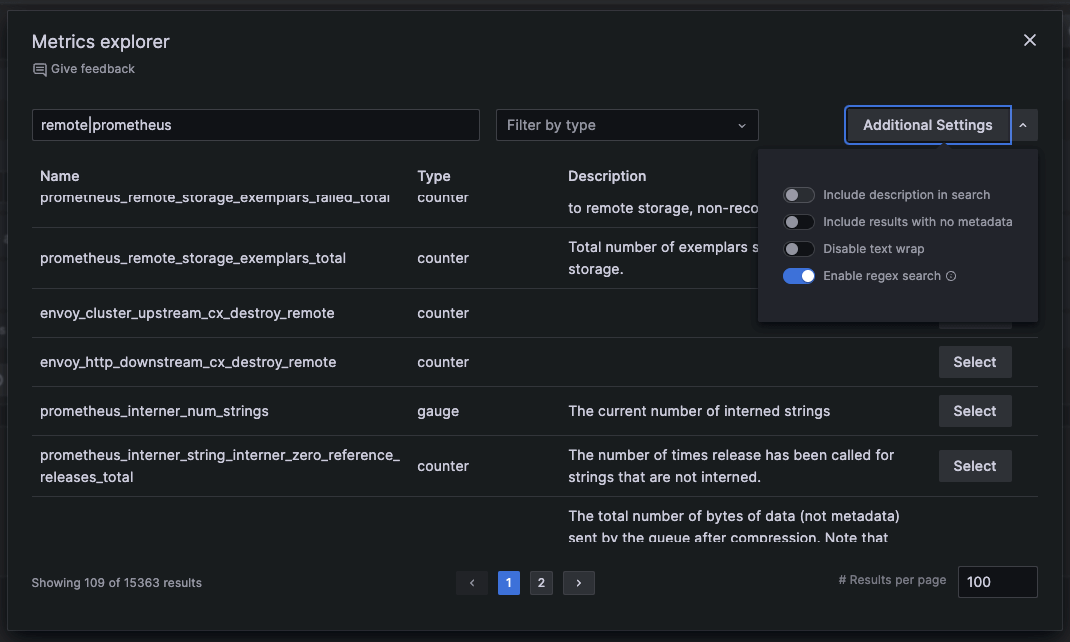
That’s why we’re adding a feature to enhance metric browsing in the Prometheus query builder in addition to the metric select. The paginated and searchable metrics explorer will help engineers get more comfortable with PromQL, which will help them build better, more insightful queries. (And don’t feel left out if you’re an advanced user. Some of the features can help you too.)
As of Grafana 10.1, this feature will be generally available. The experimental version can be used by turning on the feature flag prometheusMetricEncyclopedia in v9.5.0 and above. In this blog, we’ll share why we added this component, then we’ll discuss how you can improve your querying today with these new capabilities:
- Fuzzy search by name or name and description
- Metrics filtered by Prometheus types
- Metrics displayed in in a paginated list with a configurable number of results displayed per page
- Metric name, type, and description in the display
- Additional setting for regex search
Why we’re adding the metrics explorer
Prometheus has become the industry standard for monitoring applications and services, but it can be a bit daunting for newcomers. For example, when you implement Prometheus in your environment, you get a couple hundred metrics out of the box. What’s great about Prometheus is you can continue to add on to that and instrument all sorts of updates that collect tons of custom metrics, but that also presents problems if you aren’t well versed in building queries with PromQL, the querying language for Prometheus.
Now, if you’re a super user, you were probably comfortable using Grafana’s previous Prometheus query builder or code editor since you were the one instrumenting Prometheus. You’re familiar with the metrics and you’ve probably queried the same ones hundreds of times. But that isn’t the case for everyone.
If you’re a beginner, you probably aren’t familiar with the metrics you’re collecting — their names or what they’re actually measuring — and you might not be sure how to build the right query. Or maybe you’re an SRE that’s in the middle of an escalation and you don’t trust the previous dashboards you’ve explored, so you want to test things out and explore new metrics.
Whether you’re a novice at building queries or just new to the metrics at hand, you’re facing a bunch of unknown unknowns. You want more information about your metrics and you want to navigate the information easier, so you need a degree of flexibility that the previous metrics select dropdown doesn’t provide.
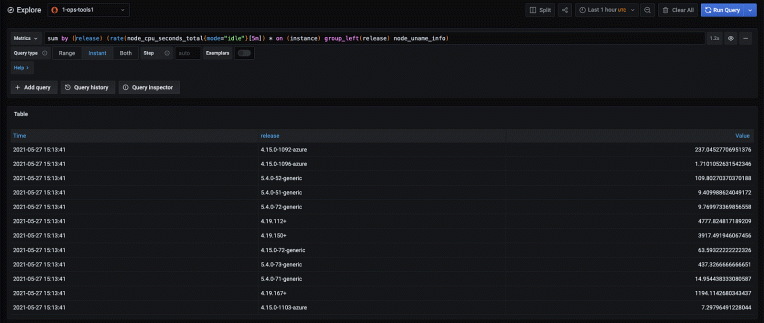
For example, one user told us they want to know about all their metrics associated with errors. In the current metrics select dropdown, they need to know and enter an exact name or substring, otherwise the full results won’t get surfaced. The metric select returns at most 1,000 results.
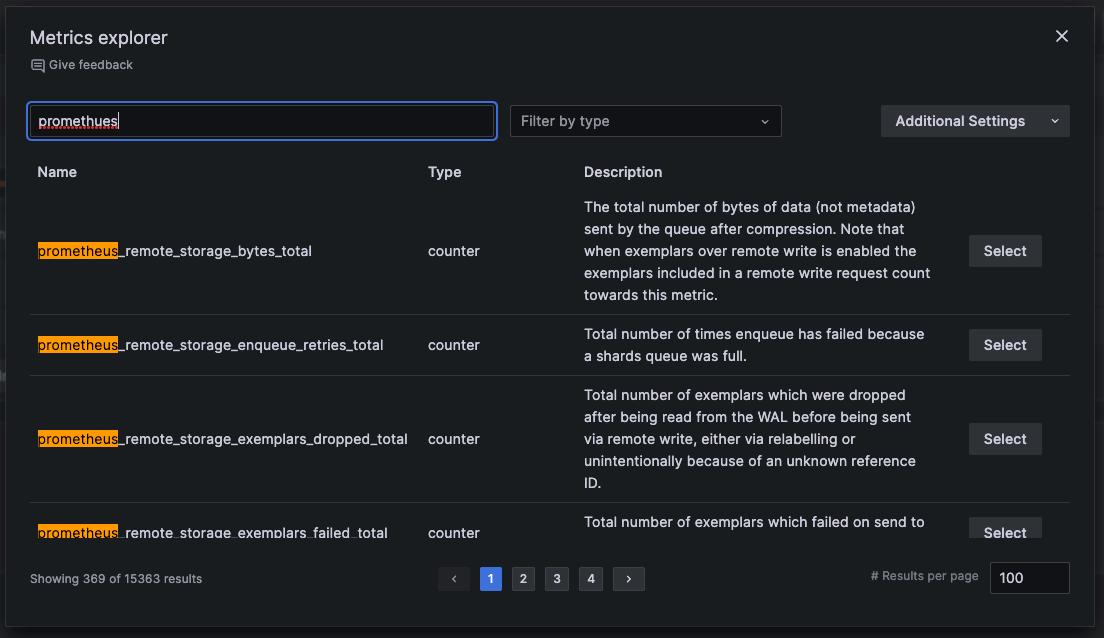
But with metrics explorer, you can search not only the name but also the type and metadata description, which is helpful if your metric doesn’t include the keyword you searched for. Metrics explorer also includes a fuzzy search, so, if you’re anything like me and you transpose E and U when you type in “Prometheus,” you’ll still get the results you’re looking for. And those are just some of the helpful improvements that come with this new feature.
There’s supposed to be a video here, but for some reason there isn’t. Either we entered the id wrong (oops!), or Vimeo is down. If it’s the latter, we’d expect they’ll be back up and running soon. In the meantime, check out our blog!
How to benefit from metrics explorer
Now that we’ve discussed why we’re making the change, let’s take a quick look at how these capabilities work and how they can benefit your querying experience in Grafana.
Fuzzy search
Use a fuzzy search to search by name or name and description. Previously, you had to enter an exact match of the metric name or substring, and some metric names could run as long as 50 characters. This increased the likelihood of a mistake, which would translate to a longer time to search for a metric.
And even if you enter everything correctly, sometimes teams don’t set up naming conventions perfectly, which means some results you want could be missing in your search results. With fuzzy search, a typo won’t get in the way of finding your answers.

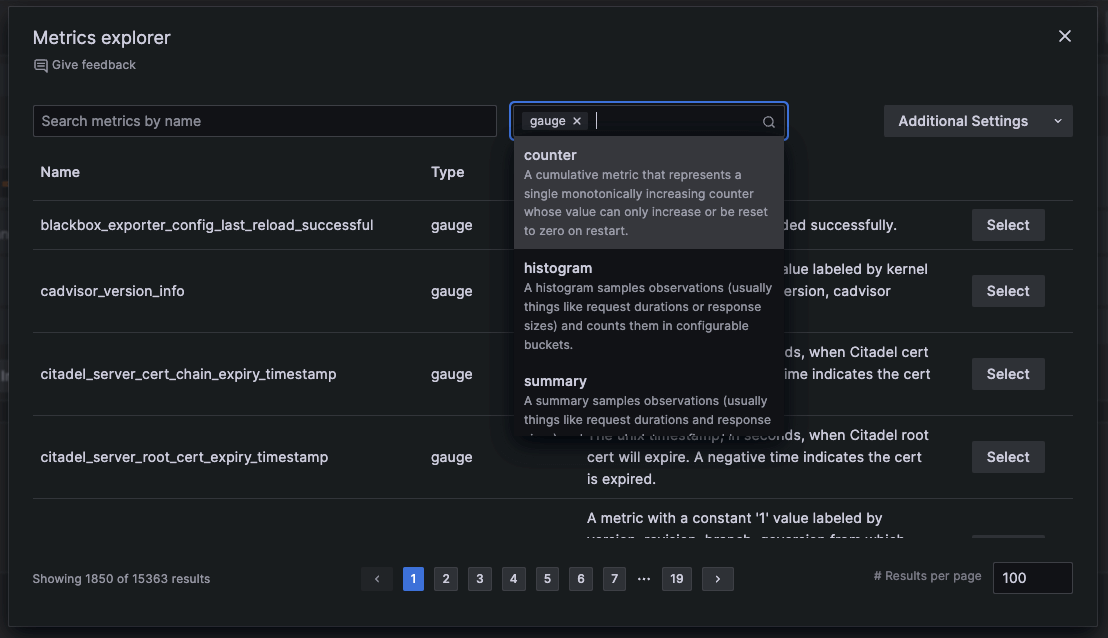
Filter metrics by Prometheus type
Prometheus has four types of metrics: gauge, counter, histogram, and summary. The filtering capability here is fairly straightforward, but what’s interesting about it is how it can help newer users better understand how to build queries.
Let’s take the example of an alerts metric. You know the alert is related to a number, which means the metric will always be some sort of number you can then operate on. But what you might not know is the complexity behind how that number is being computed. It could be a simple counter that goes up or down, or it could be part of a complex histogram. When you consider the type of metric you’re looking for, you have a more foundational understanding of Prometheus and the kind of functions that would be reasonable to apply. For example, you would apply the rate function to a counter, but never to a gauge.
Displays metrics in a paginated list
A Prometheus instance can contain tens of thousands of metric names, and scrolling through that list line-by-line is not a great user experience. (Grafana can actually surface more than this through our backend, though the view is still capped at 1,000.) But if you have tens of thousands of metrics that you’re querying on, you’re putting tremendous stress on the Prometheus API, which can lead to timeouts.
With the paginated list, all those results are still present and searchable in the frontend. The fuzzy search can easily handle searching tens of thousands of names. The paginated list can display as many as a user wants to display with the results per page option.
All metrics displayed with a name, type, and description
Previously, you didn’t always know if a metric had a description. Sometimes they’d be there, but other times you’d have to hover over each metric to get its name, type, and description, which led to a lot of hoping and guessing.
But now, all that information is automatically included, making it much easier to check if it’s there or if it’s been updated — no hovering needed.
Expert feature: search metrics by regex using only the backend
This optimization feature is for Grafana users that want to search their metrics with regex. The metrics explorer offers an additional setting to query the Prometheus API with a regex search. Because this setting requires an additional call to the backend, it can be slower than the frontend fuzzy search when it’s turned on. We believe it is worthwhile to offer our users this feature though, especially since they can turn it on or off at will.
Confidently take your queries to the next level
The metrics explorer gives you a deeper understanding of the foundations of a Prometheus query, which is the metric. And having that deeper understanding helps you develop more complicated queries and more confidence as a PromQL user. Through user testing and metrics expert interviews, we found that this is a useful tool for onboarding new users and a visually appealing way to search many metric names. The metrics explorer gives users the ability to explore, gain knowledge, and become more confident in writing queries.
The next steps for the metrics explorer include adding label filters, refining the additional settings, and exploring more capabilities of the fuzzy search. We’d also love to hear your feedback on this new feature. Reach out in our Grafana Labs Community Slack or GitHub. You can also share your opinion in this brief survey.
Grafana Cloud is the easiest way to get started with metrics, logs, traces, and dashboards. We have a generous forever-free tier and plans for every use case. Sign up for free now!