The lowdown on Loki for log aggregation: 5 demos you don’t want to miss
Looking to get started with log aggregation? Or perhaps take your logging game to a whole new, more advanced level? You’ve come to the right place.
Grafana Loki is a key component of Grafana Labs’ open and composable Grafana LGTM stack (Loki for logs, Grafana for visualization, Tempo for traces, Mimir for metrics). A horizontally scalable, highly-available, multi-tenant log aggregation system, Loki has a lot to offer — and, with each new release, becomes even easier to use and more feature rich.
Loki, importantly, represents one of the three main pillars of observability. These pillars include metrics, which show you what is happening in your environment; traces, which show you where it’s happening; and logs, which show you why it’s happening. (We also believe that continuous profiling is the next pillar of observability.)
In addition to our Loki technical documentation, Grafana Labs offers a number of demo videos — including those in our webinars and GrafanaCON 2023 on-demand sessions — that dive into both the basics of Loki features and use cases, as well as more advanced topics, such as configuring Loki for high availability or optimizing query performance.
We’ve compiled some of those expert-led resources into five must-see videos. So, whether you’re a seasoned Loki user or somebody who’s just ramping up with the log aggregation system, rest assured — there’s a video on this list for you.
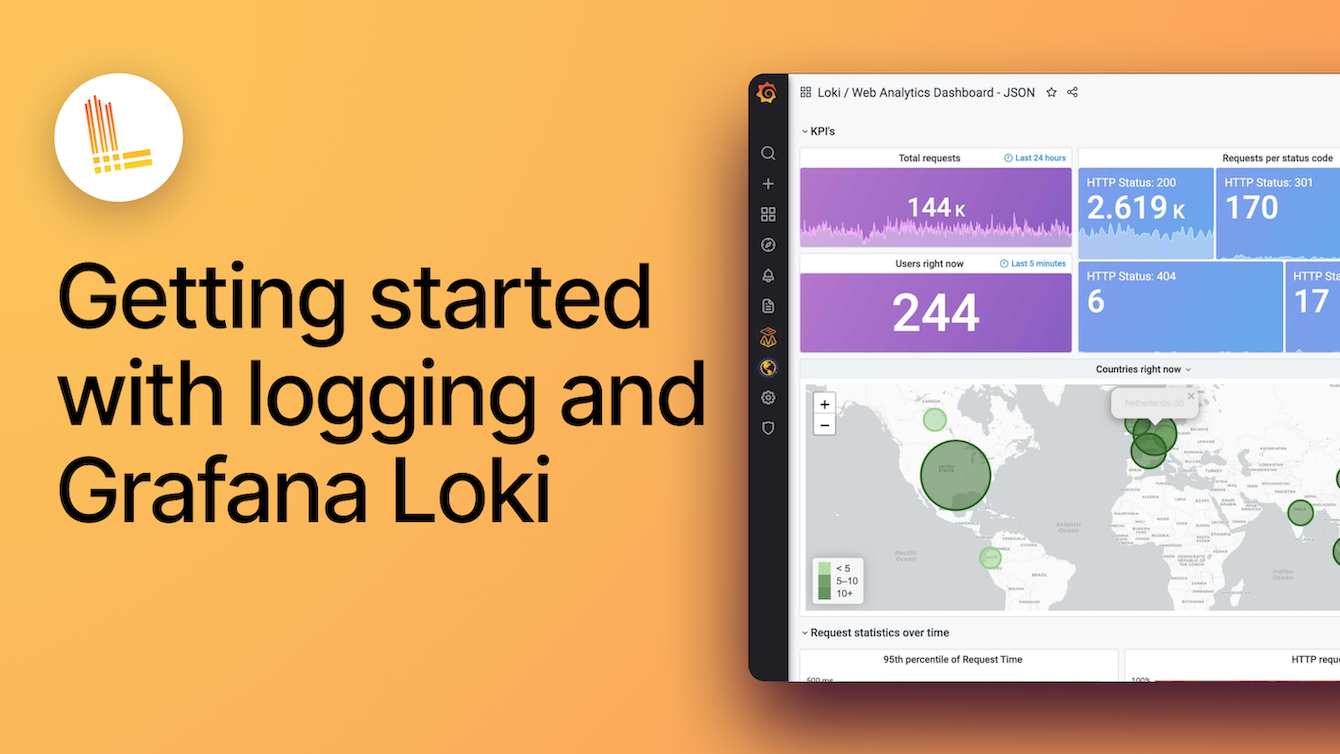
Getting started with logging and Grafana Loki
- Who should watch it: New Loki users — or anyone who just wants to brush up on their Loki fundamentals
- Video type: Webinar
- Speaker: Brian Ashburn, Senior Solutions Engineer, Grafana Labs
In this webinar, Ashburn perfectly summarizes what sets Loki apart from other log aggregation systems: “It’s tailored for logs,” he says, “but built for developers and operators.”
He then goes on to prove it by sharing specific tips and best practices for getting started with Loki. For example, he walks through the process of getting logs into Loki — whether they’re from Kubernetes or a 10-year-old legacy app in a custom format. He covers how to store and search logs, as well as options for running Loki, including as a single binary/monolith, on microservices, on Grafana Cloud, or with Grafana Enterprise Logs.
In addition, Ashburn demos new and updated Loki features to create metrics from logs and alert on your logs with powerful Prometheus-style alerting rules.
Essential Grafana Loki configuration settings
- Who should watch it: Intermediate or advanced Loki users looking to explore configuration options (Note: Before checking out this webinar, we highly recommend watching the one above on getting started with Loki.)
- Video type: Webinar
- Speakers: Navish Bahl, Principal Solutions Engineer, Grafana Labs; Kaviraj Kanagaraj, Software Engineer, Grafana Labs
This webinar jumps right into the technical details of Loki configuration settings and parameters. To start, the speakers discuss configurations for running Loki as a single binary — a deployment mode recommended for smaller test or demo environments — and then move on to configuring Loki for high availability (sharing lots and lots of sample config files along the way). Bahl and Kanagaraj also explore how three components — the shared ring, properly routed traffic, and shared storage — enable Loki to scale horizontally.
The webinar also covers how to set up and configure popular Loki agents, including Promtail and Docker, as well as configuring Loki storage for popular storage backends, such as file system storage and object storage on Google Cloud Storage, AWS S3, and Azure Blob Storage. Loki limits and runtime overrides are also covered.
Viewers will walk away with an understanding of how Grafana Labs configures and runs Loki internally (Hint: our clusters are pretty large, with about 4,500 active tenants).
“This is just an idea of what we do with Loki, what you can do, too, and how we got there,” Bahl says.

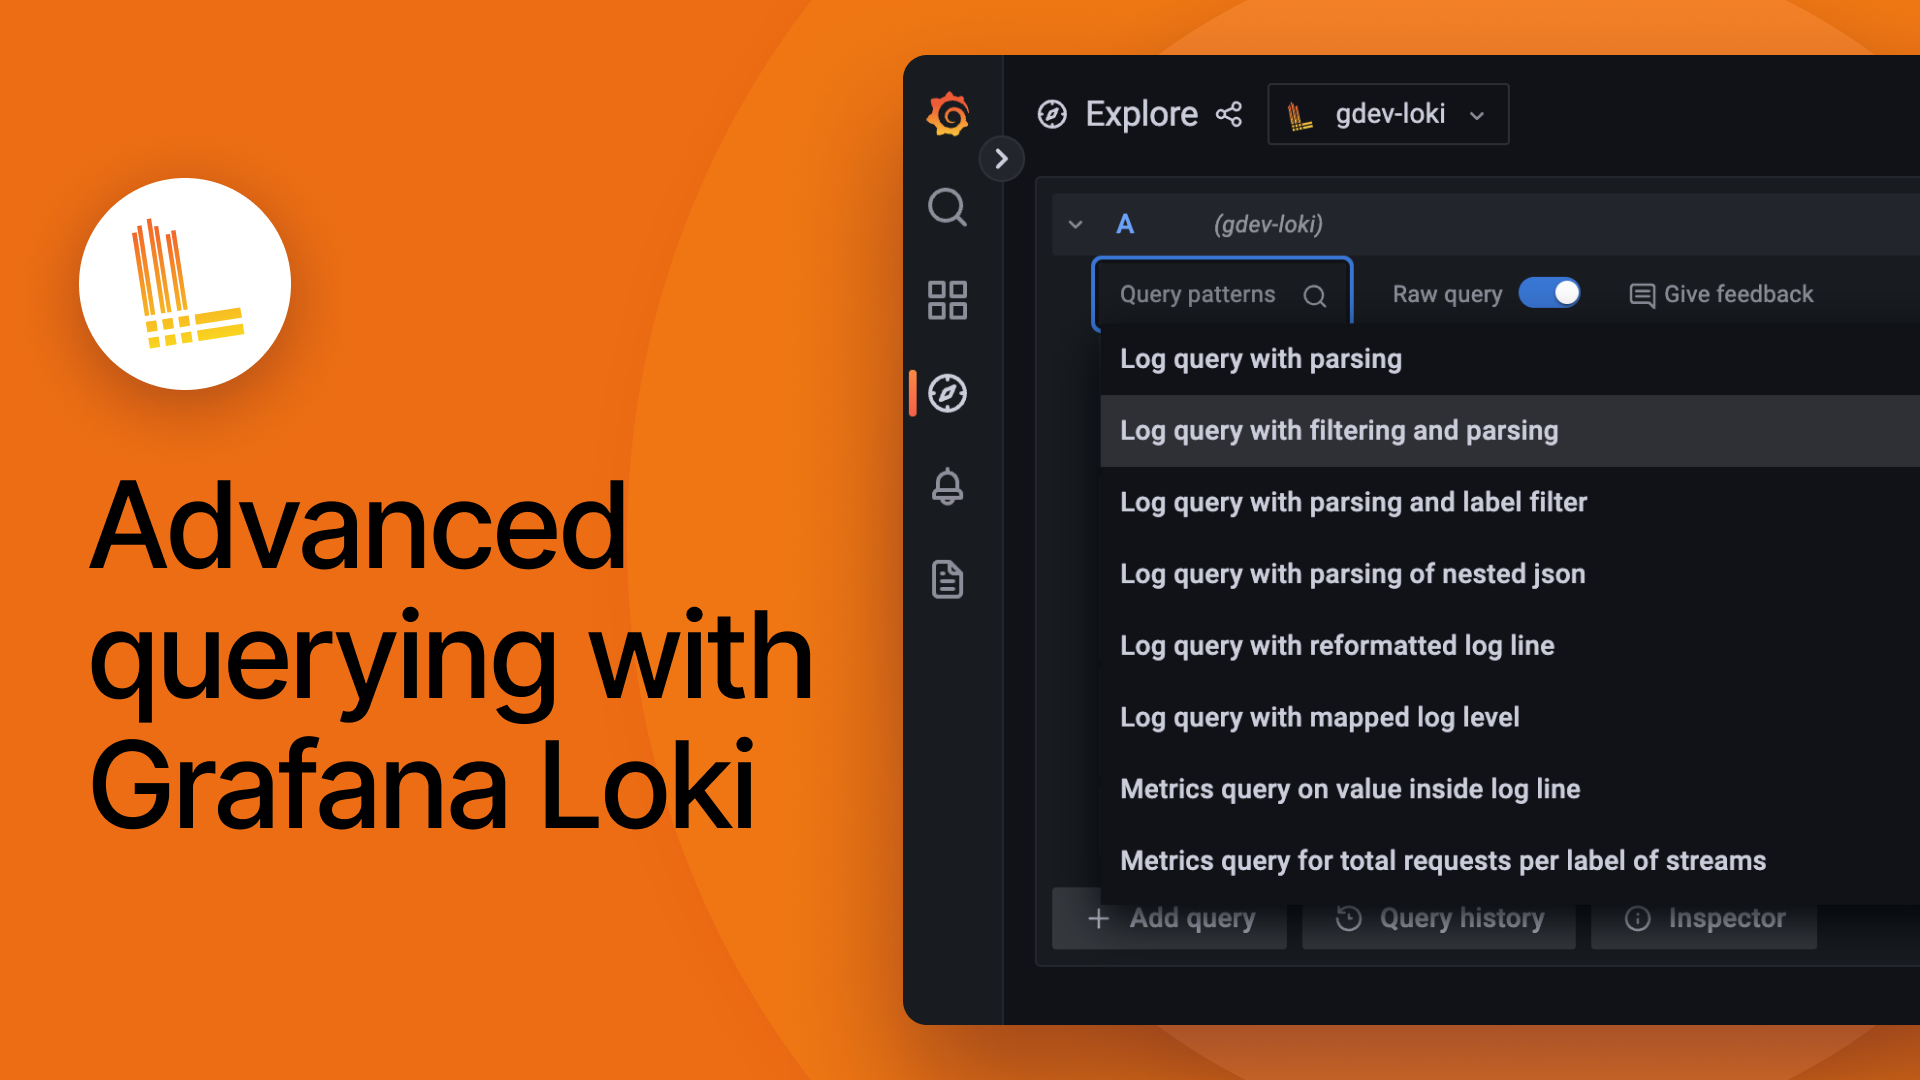
Advanced querying with Grafana Loki
- Who should watch it: Intermediate or advanced Loki users looking to optimize their queries
- Video type: Webinar
- Speakers: Tulayb Mahmood, Senior Solutions Engineer, Grafana Labs; Christian Haudum, Software Engineer, Grafana Labs
This webinar uncovers best practices for operating Grafana Loki as efficiently as possible and maximizing query performance. The speakers offer practical advice to optimize Loki configurations for both cost-efficiency and speed. Specifically, they discuss the role of label selectors, filters, parsers, and query re-use to boost query performance.
“It might seem very obvious and intuitive, however, it’s something folks often overlook in the first place: the biggest lever you can control with maximizing your log query performance is actually making sure you are using the right label selectors in the first place,” says Mahmood.
The webinar also covers generating metrics to create a graphical representation of log information; the key differences between instant and range queries; and why TSDB, the new Loki index that went GA with the Loki 2.8 release, is more efficient, faster and scalable than BoltDB, the index that preceded it.
“This new way of indexing effectively means that we can support up to 4x-faster queries, so we’ve seen up to 400GB a second of processing speed being used, and we can make the index size a fraction of what it used to be,” Mahmood says.
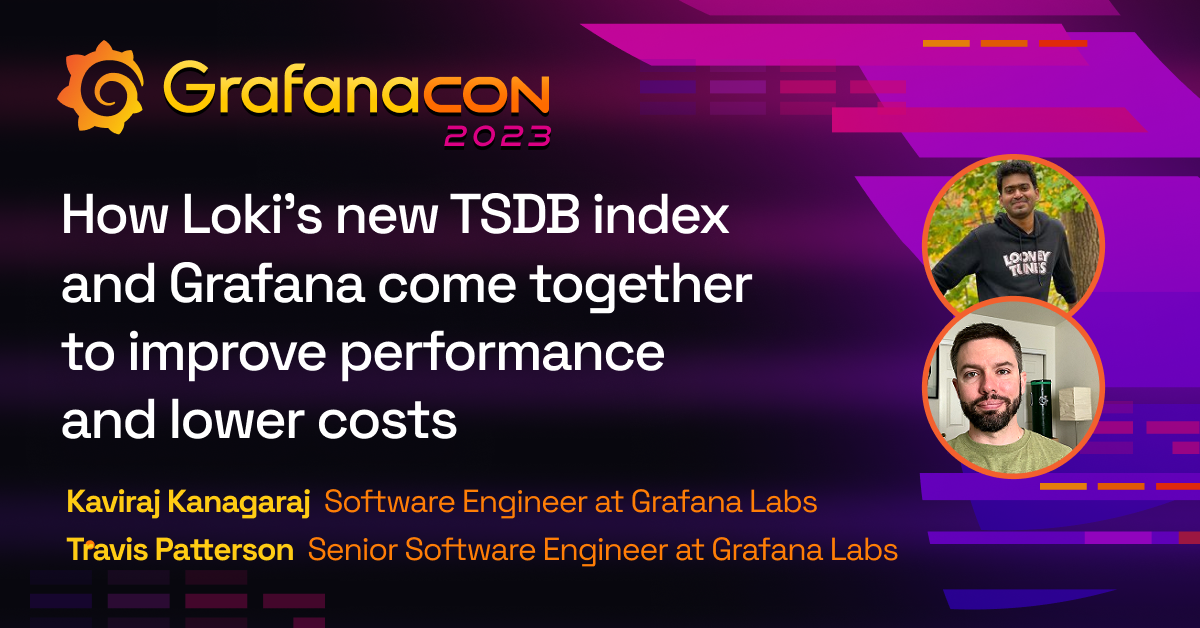
How Loki’s new TSDB index and Grafana come together to improve performance and lower costs
- Who should watch it: Anybody who wants a deep dive into the TSDB index
- Video type: GrafanaCON 2023 on-demand session
- Speakers: Kaviraj Kanagaraj, Software Engineer, Grafana Labs; Travis Patterson, Senior Software Engineer, Grafana Labs
Want to learn the ins and outs of the new TSDB index? This session’s for you.
Join Grafana Labs engineers and Loki contributors Kavi Kanagaraj and Travis Patterson to discover the specific cost and performance improvements they’ve seen since transitioning Grafana Cloud Logs, the fully managed Loki-as-a-service product from Grafana Labs, to the TSDB index.
For example, learn how the TSDB index — which is inspired by the Prometheus TSDB storage format — significantly reduces your object storage footprint so you consume fewer resources at query time.
“There is much less resource consumption for all the index lookups, which, in turn, makes all metadata queries run much faster,” Kanagaraj says.
The session also highlights recent ease-of-use improvements for Loki operators, including stream sharding, as well as improvements for those querying logs, including LogQL expression validation, better autocomplete, and query splitting.
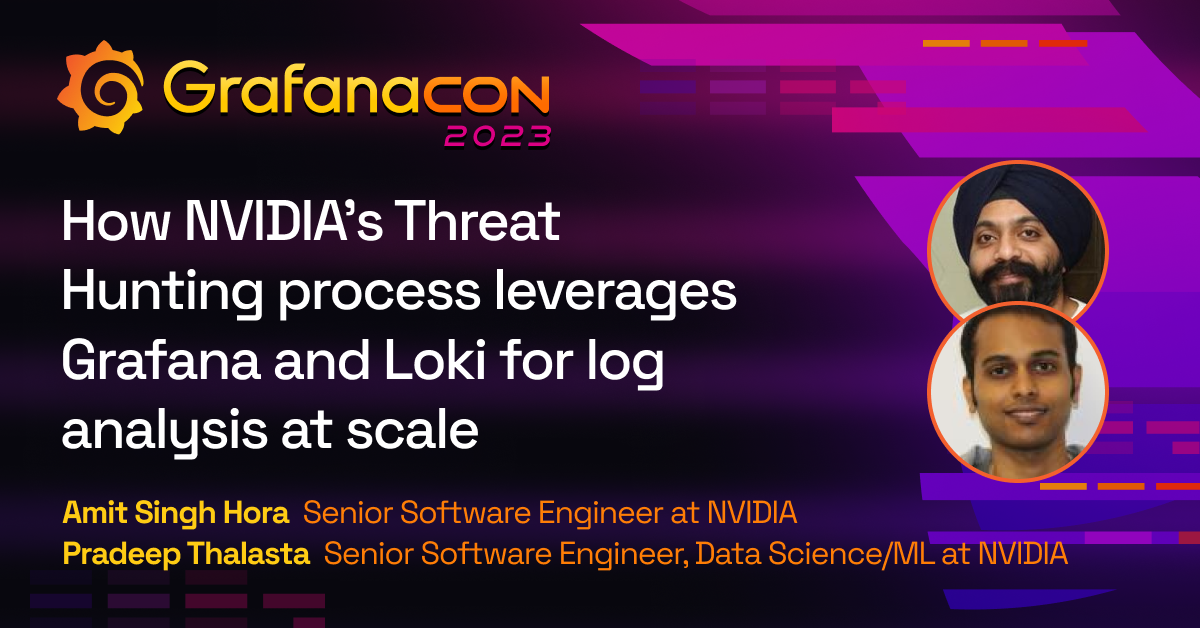
How NVIDIA’s Threat Hunting process leverages Grafana and Loki for log analysis at scale
- Who should watch it: Anybody who wants to learn about a cutting-edge, security-focused use case for Loki
- Video type: GrafanaCON 2023 on-demand session
- Speakers: Amit Singh Hora, Senior Software Engineer, NVIDIA; Pradeep Thalasta, Senior Software Engineer, Data Science/ML, NVIDIA
The security team at NVIDIA, a leading manufacturer of GPU and AI hardware and software, has developed a powerful Threat Detection System (TDS) for analyzing security logs at scale to detect malicious activity. At the heart of that system? Grafana and Grafana Loki.
Specifically, the team uses Grafana and Grafana Loki to analyze different data types, such as network logs alongside access logs, to identify and respond quickly to suspicious activity.
“We wanted to enable searching of non-indexed security logs at scale to enable SOC teams to analyze, aggregate, and search security logs and correlate them from various sources to hunt down hidden threats,” Thalasta says.
The speakers detail why they ultimately chose Grafana Loki as their log aggregation system (Spoiler alert: they wanted something cost-effective, open source, scalable, and flexible enough to integrate with a range of cloud platforms), and share best practices for deploying and managing Loki for scale and multi-tenancy.
Lastly, viewers hear what’s on the horizon for NVIDIA’s Threat Hunting project, including a centralized alerting system for security analysts and incident response teams.
Check out all of our webinars and on-demand conference videos for in-depth demos, deep-dive discussions, helpful Q&As, and more!

