New in Grafana 10: Securely monitor and query network-secured data sources from Grafana Cloud
Update 2023-10-05: Private Data Source Connect is now generally available to all Grafana Cloud users, including those in our forever-free tier. To learn about the latest updates to PDC, go to our recent blog post.
Grafana is designed to visualize data in beautiful dashboards, no matter where the information lives. However, if you are considering the hosted Grafana Cloud observability stack for visualizing your data, you might run into a roadblock: network security.
The problem is that some data sources, like MySQL databases or Elasticsearch clusters, are hosted within private networks. These networks might run on on-prem infrastructure, or virtual private clouds (VPCs), which are isolated networks running on public cloud providers like AWS, GCP, or Azure.
Currently, in order to query these data sources from Grafana Cloud, you have to open your private network to a range of IP addresses, which is a non-starter for a lot of IT security teams. So the challenge is, how do you connect to your private data from Grafana Cloud, without exposing your network?
There’s supposed to be a video here, but for some reason there isn’t. Either we entered the id wrong (oops!), or Vimeo is down. If it’s the latter, we’d expect they’ll be back up and running soon. In the meantime, check out our blog!
How to monitor private network data with Grafana Cloud
Our answer to safely monitoring private network data is Private Data Source Connect (PDC), which is available now in public preview in Grafana Cloud Pro and Advanced. This feature is part of the recent Grafana 10 release, which was announced at GrafanaCON 2023.
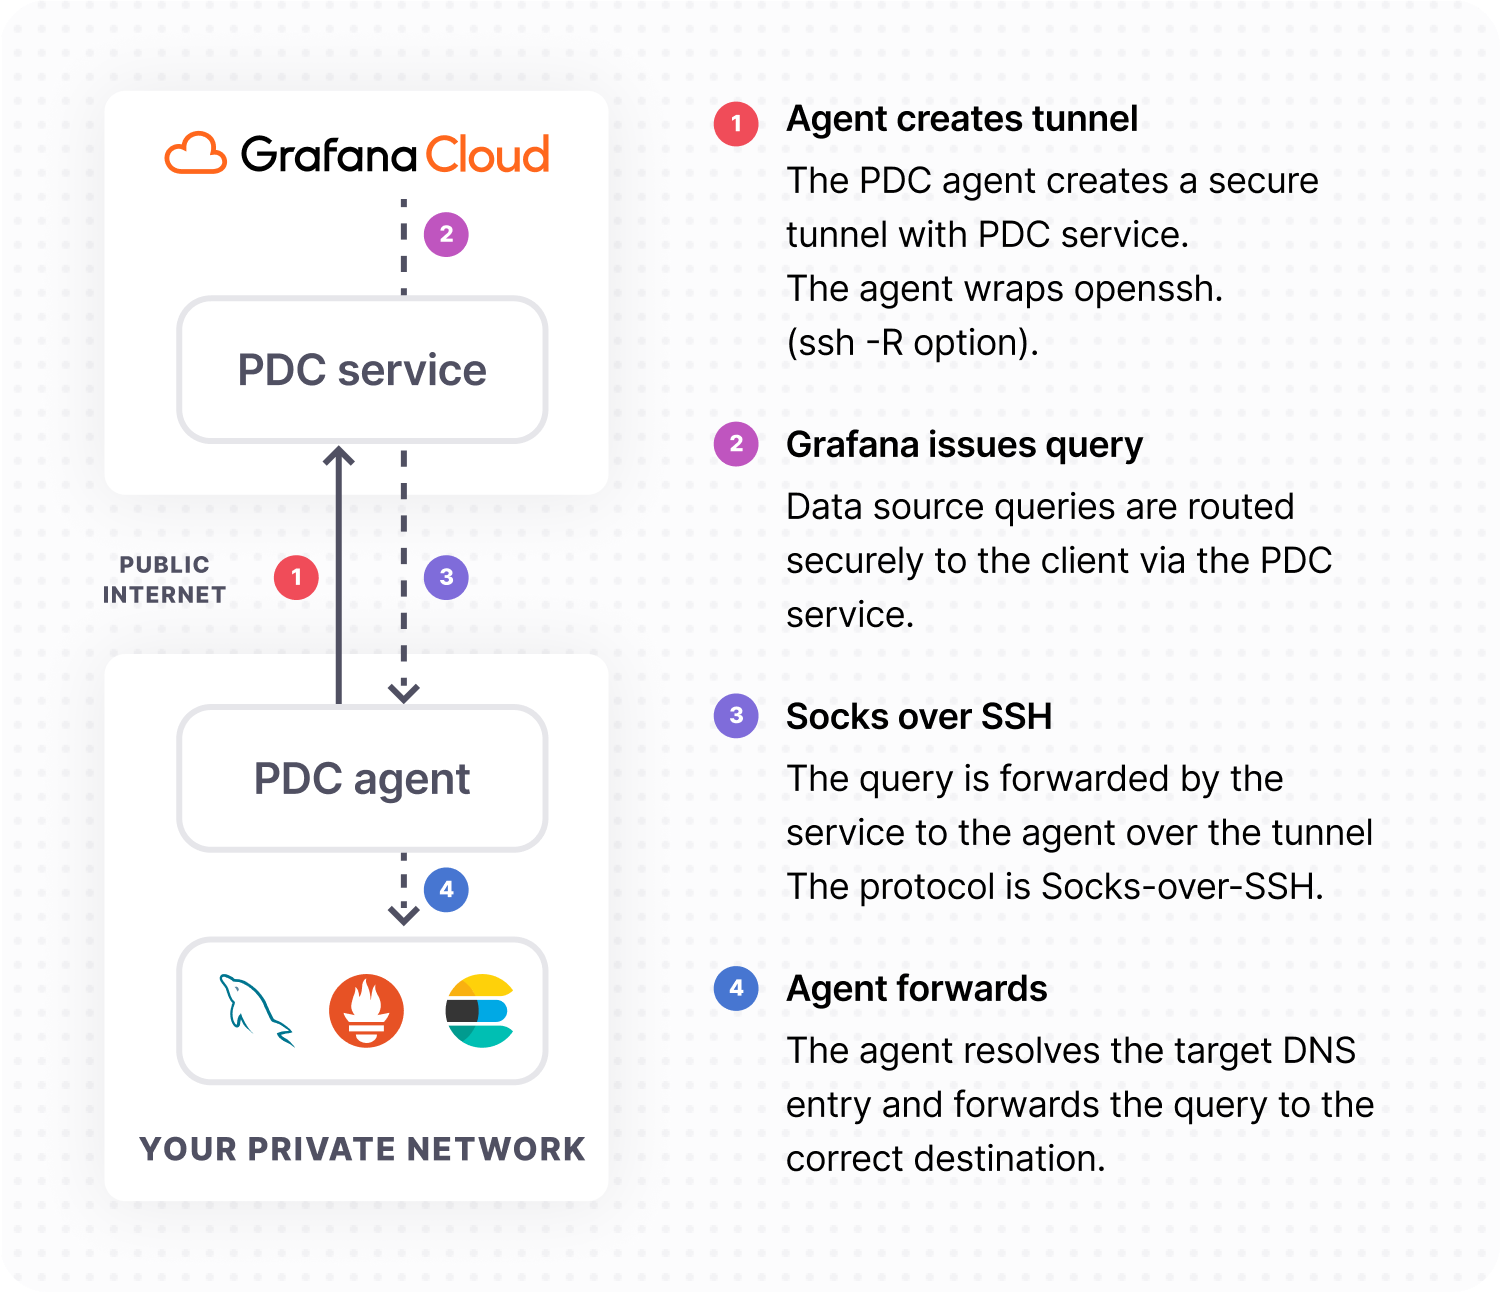
PDC uses SOCKS over SSH to establish a secure connection between a lightweight PDC agent you deploy on your network and your Grafana Cloud stack. PDC keeps the network connection totally under your control.
It’s easy to set up and manage, uses industry-standard security protocols, and works across public cloud vendors as well as a wide variety of secure networks.
Here’s how it works:

How to set up Private Data Source Connect in Grafana Cloud
- Head to your Grafana instance and click on Connections > Private Data Source Connections
- Follow the step-by-step instructions to generate an API key and deploy the agent to your network using Kubernetes or Docker. You can deploy multiple PDC agents to your network using the same configuration for horizontal scaling and fault tolerance.
- Configure data sources in Grafana Cloud using their internal hostnames, and enable the secure socks proxy option in each data source config.
Private Data Source Connect is in public preview, which means that we are still actively developing the feature. Right now, there are two known limitations:
- Currently you can connect each Grafana Cloud stack to just one private network, but you can connect to many data sources on that network using the same connection. In the future you’ll be able to connect to many networks — for example, VPCs on both Azure and AWS — from a single Grafana Cloud stack.
- PDC currently works for a subset of Grafana data sources, which are listed in our Grafana Cloud documentation. We will add support for more data sources over time.
To learn more about Private Data Source Connect, go to our Grafana Cloud docs.
If you’re not already using Grafana Cloud — the easiest way to get started with observability — sign up now for a free 14-day trial of Grafana Cloud Pro, with unlimited metrics, logs, traces, and users, long-term retention, and access to all Enterprise plugins.
