Grafana 10 release: New panels, Grafana as code updates, data correlations, and more
We are beyond thrilled to announce the arrival of Grafana 10, which was highlighted during the GrafanaCON 2023 keynote. The latest major release of the popular visualization and monitoring tool, which now has more than 20 million users around the world, is not just about introducing new features. Grafana 10 is also about enabling you to achieve more — more analysis, more collaboration, more insights, more efficiency and, of course, more beautiful dashboards.
Whether you’re a Grafana power user or just getting started on your observability journey, Grafana 10 will empower you, enable you, and assist you in maximizing your data comprehension.
Let’s take a look at some of the new capabilities that Grafana 10 offers, shall we? You can explore all the new features by upgrading your instance or downloading Grafana 10 today. Or the easiest way to get started is to sign up for Grafana Cloud, which has a generous forever-free tier and plans for every use case. Get your free account today!
For a full demo of Grafana 10, watch the “Deep dive into Grafana 10” GrafanaCON session.
Grafana dashboards: New ways to correlate, visualize, and share data
New visualization panels? Check. New features to bring together disparate data? Check. New capabilities that allow you to share dashboards with external teams, stakeholders, or your in-laws who still don’t quite understand what you do? Check.
Collectively, the new Grafana dashboarding advancements in Grafana 10 not only make your data look good. Your team will also look good as they leverage Grafana dashboards to enhance their efficiency, improve response times, and make confident data-driven decisions.
Build dynamic dashboards for real-time data with new Grafana panels
Available in Grafana OSS, Grafana Cloud (Free, Pro, Advanced), and Grafana Enterprise
What’s a Grafana release without new visualizations? In Grafana 10, our new trend panel (public preview) allows you to graph ascending numeric X-axis data, enabling more adaptable data visualization.

The datagrid panel (experimental) is a game changer for data management, offering a spreadsheet-like interface that allows you to edit, fine-tune, and organize your data within each dashboard.
Together, with the canvas panel (now GA) and updates to the time series panel — you can add time regions! — and more, Grafana 10 allows you to build more dynamic, custom dashboards that showcase real-time data and enhance your team’s ability to develop comprehensive insights.
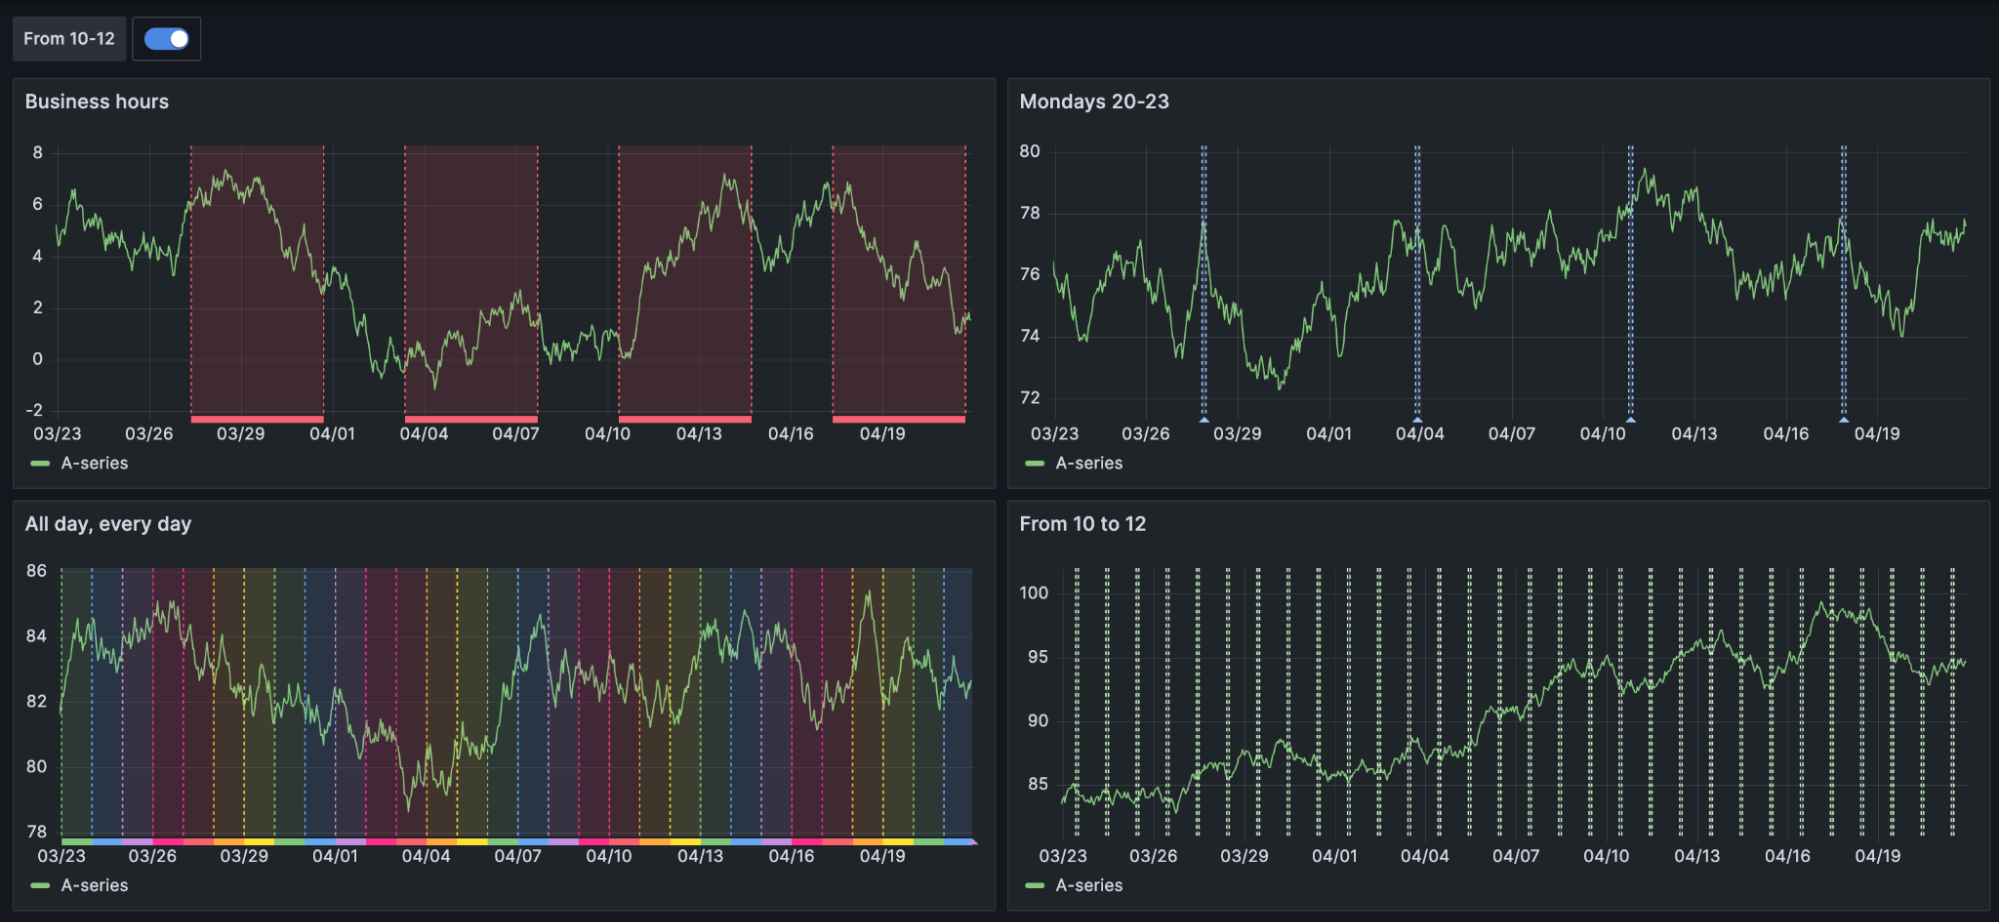
To learn more about the latest visualizations updates, check out our What’s New documentation for Grafana 10.
Share Grafana dashboards with Public Dashboards
Public preview available in Grafana OSS, Grafana Cloud (Free, Pro, Advanced), and Grafana Enterprise
With our latest updates to Public Dashboards, which allow you to share Grafana dashboards with anyone outside of your organization, we’ve added support for more functionality, such as collapsing rows, hiding queries, and zooming into panels. It’s also easier for you to manage your public dashboards because they are all categorized separately under Dashboards in the Grafana UI.
In addition, Grafana Cloud Pro and Advanced users can now send dashboards via email. As a result, you can put together more comprehensive reports and analyses for clients and external stakeholders that include data visualizations supporting your insights and information.
To try it out, enable the publicDashboards feature toggle. If you’re using Grafana Cloud, and would like to enable this feature, please contact customer support.
There’s supposed to be a video here, but for some reason there isn’t. Either we entered the id wrong (oops!), or Vimeo is down. If it’s the latter, we’d expect they’ll be back up and running soon. In the meantime, check out our blog!
Unify data, no matter where it lives, with Correlations
Public preview available in Grafana OSS, Grafana Cloud (Free, Pro, Advanced), and Grafana Enterprise
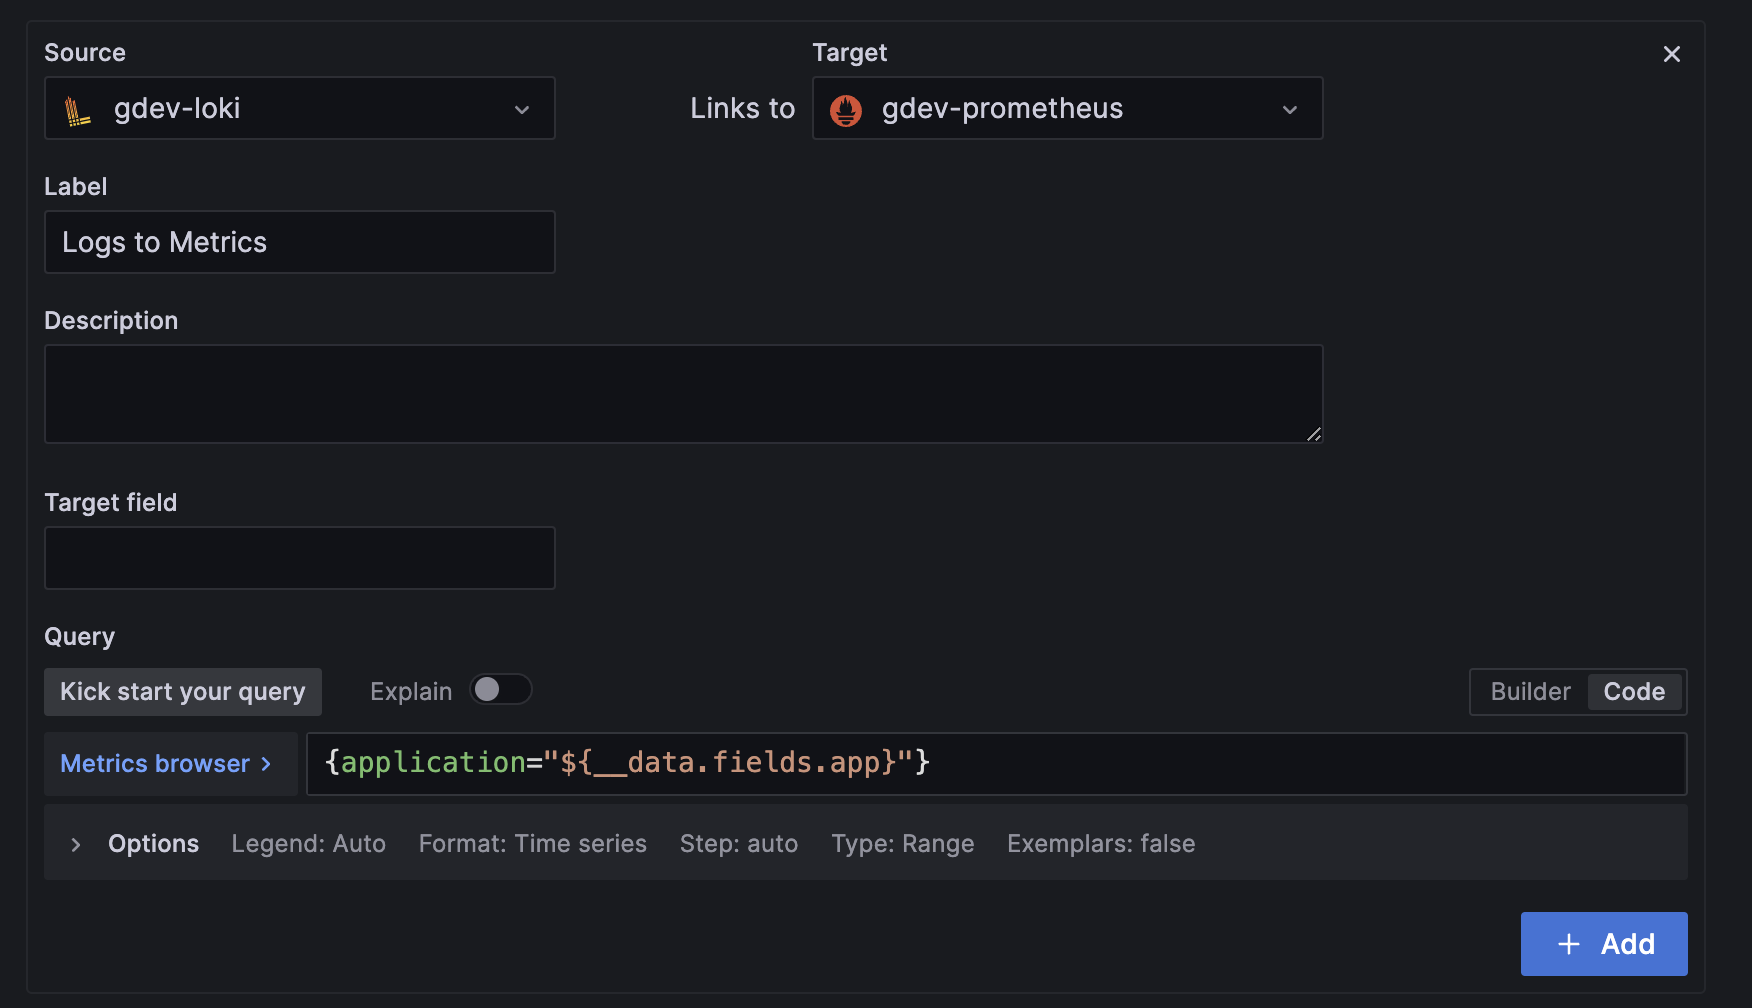
More than two-thirds of active Grafana users have at least four data sources configured for their stack, according to our recent Observability Survey. Whether you have 4 or 40, the task of correlating your information from multiple data sources has never been easier. With the Correlations feature, simply define the relationship between data sources within Explore and then seamlessly pivot and link between disparate data sources.
So whether it’s application performance metrics in one system, server logs in another, or user activity data in yet another, the unified view of all your data will help create meaningful connections between your datasets.
To try out Correlations, enable the correlations feature toggle for Grafana OSS and Enterprise. If you’re using Grafana Cloud, please contact customer support.
Optimize development with Grafana as code and more
Harness the power of Grafana 10 to simplify your development and maintenance processes. Our enhanced plugin platform and development tools enable you to build robust applications with minimal upkeep. Also, Grafana as code features, such as our generated libraries, Grafonnet, and an improved Terraform provider, facilitate seamless development and deployment of solutions and products.
Build dashboards from Grafana app plugins with Grafana Scenes
Public preview in Grafana OSS, Grafana Cloud (Free, Pro, Advanced), and Grafana Enterprise
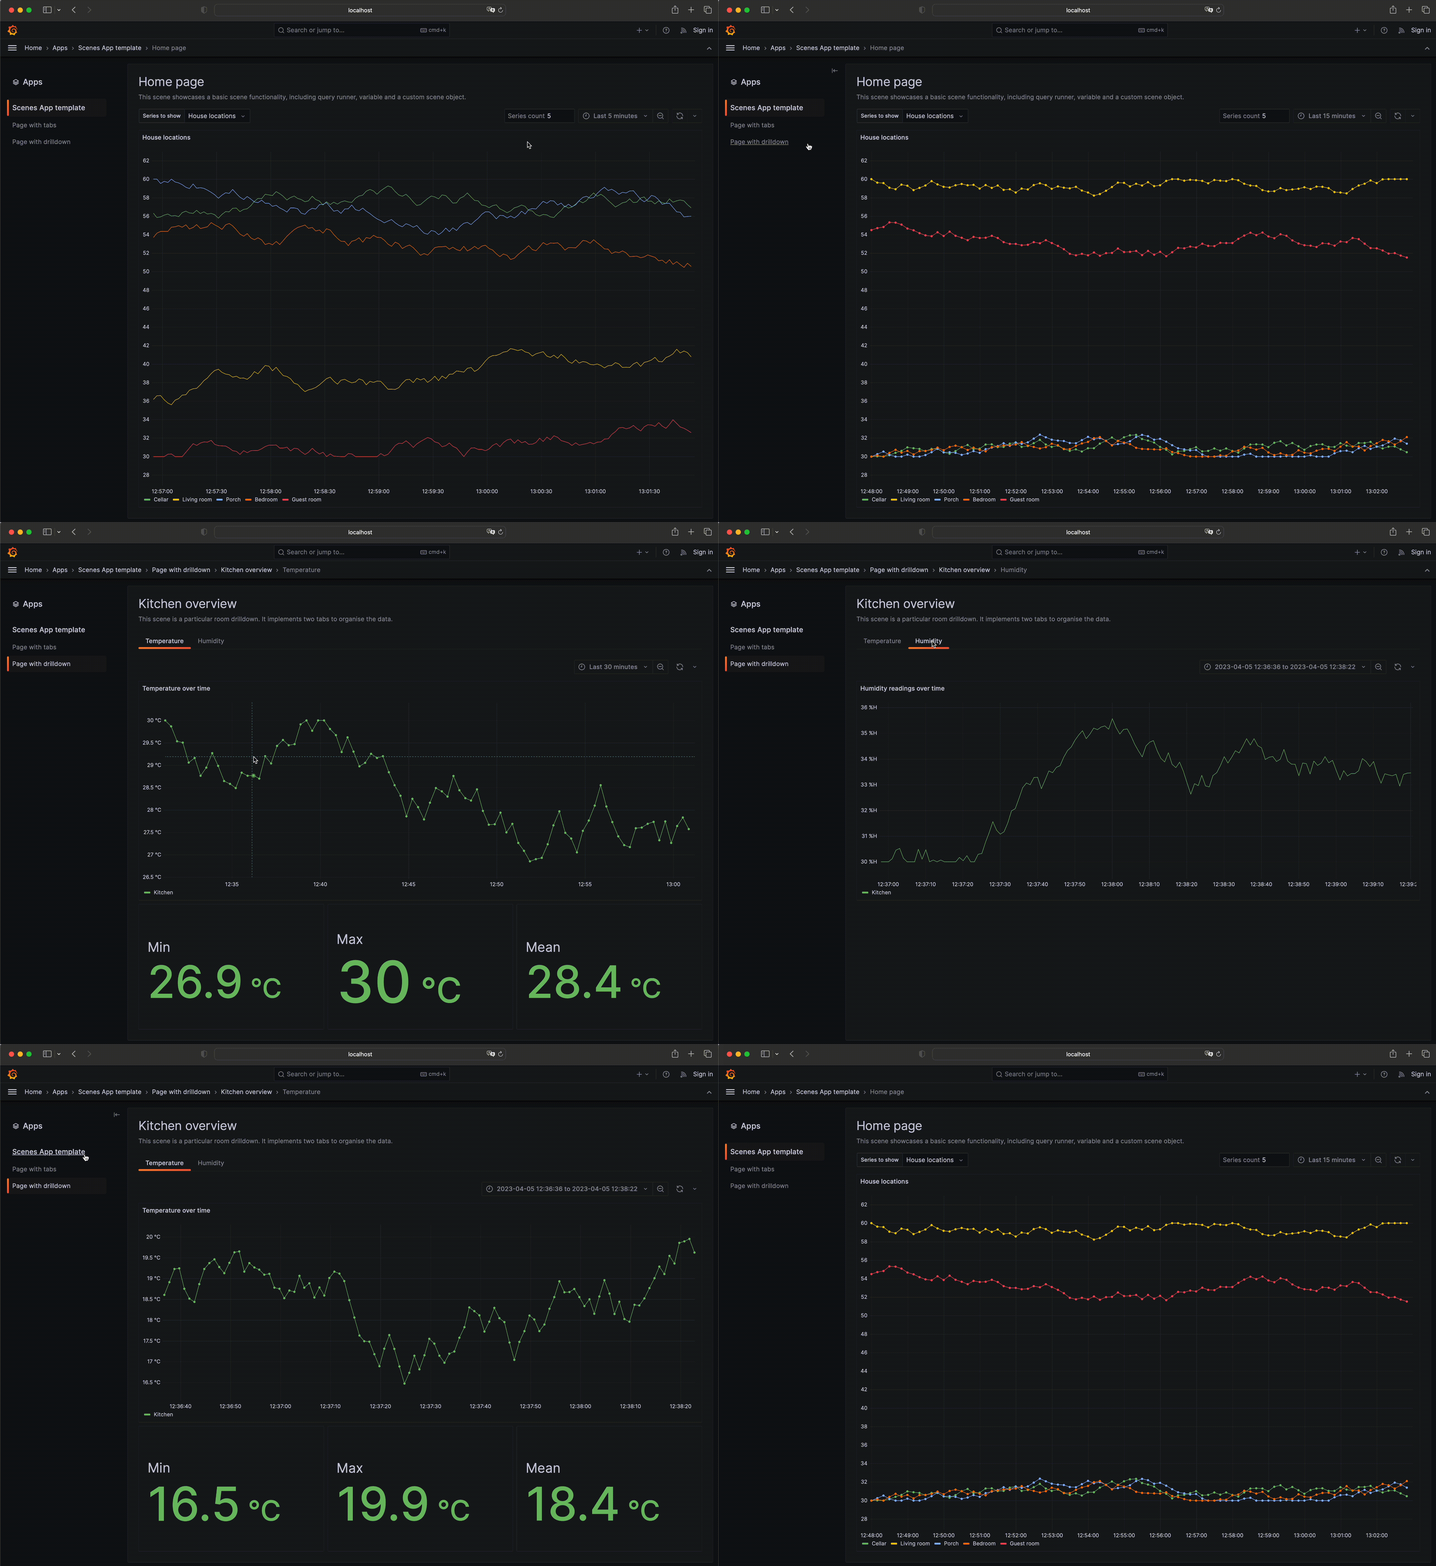
Grafana Scenes is a new frontend library that allows you to build dynamic and custom dashboard like experiences from Grafana app plugins. Now you can easily create apps that mirror the Grafana dashboarding experience, complete with template variable support, flexible layouts, dynamic panel rendering, and so much more.
To learn more, check out Grafana Scenes on GitHub or watch the GrafanaCON session “How to build dynamic, customizable dashboards with Grafana Scenes.”
Better dashboard management with as code automation
Public preview available in Grafana OSS, Grafana Cloud (Free, Pro, Advanced), and Grafana Enterprise
Does managing dashboards feel like being stuck in a hamster wheel? We’ve heard your feedback, and we’re making it better. Meet Grafana’s new and improved code libraries, geared towards making dashboard management less cumbersome.
No more grappling with complex JSON or rewriting your code. Instead, we’re introducing a second Grafana interface focused solely on managing dashboards as code, helping you keep everything up-to-date effortlessly.
We’re also unveiling a revamped version of our Grafonnet library and a Terraform provider for composing dashboards. To top it off, we are making the entire framework public in the spirit of open source, which always guides Grafana Labs. This means that you will have access to documentation as code, both as part of the schema and generated alongside the libraries, so no more guesswork about how to use a specific field while writing your dashboards as code.
Updated Grafana plugin development tools
Generally available in Grafana OSS, Grafana Cloud (Free, Pro, Advanced), and Grafana Enterprise
Thanks to our “big tent” philosophy, plugins play a crucial role in the Grafana ecosystem. There are currently more than 150 plugins in the catalog, and the number is growing. With Grafana 10, we’re taking a giant leap forward in plugin development, providing the community with tools to increase the speed, quality, and reliability of plugins. Our plugin SDK enhancements and Create-Plugin tool have been designed to quickly diagnose and resolve issues with Grafana plugins through added distributed tracing and debugging capabilities.
Inside Grafana’s improved user experience
In our ongoing effort to create a more intuitive experience in Grafana, the latest major release introduces navigation updates that reduce the friction of getting started with dashboarding and increase your ability to find your data.
For new users to Grafana (Welcome!), we implemented a new onboarding experience with guided workflows and better tips in the UI to simplify the learning process. For power users, the new subfolders feature along with data source updates make dashboard management and data retrieval less of a slog.
For everyone? Grafana 10 provides a more consistent user experience within Grafana that makes it easy to find what you’re looking for and jump between different tools within the product.
To see all the Grafana 10 navigation improvements, join us for the GrafanaCON session “Grafana’s new navigation: A journey of user experience, design, and continuous improvement.”
Enhanced navigation and seamless onboarding
Generally available in Grafana OSS, Grafana Cloud (Free, Pro, Advanced), and Grafana Enterprise
Optimizing the navigation experience in Grafana has been a major focus of the latest Grafana release. This enhanced, intuitive user experience — which includes a new header with search, breadcrumbs, and a reorganized menu — means less hassle and more time for what truly matters: deriving meaningful insights from your data.
But it’s not just about improving the lives of Grafana power users. First impressions count, too. We’ve fine-tuned the onboarding process so that getting started with building Grafana dashboards and configuring a data source is easier, with better prompts and an updated data source picker in the Grafana UI. The goal is to make setting up data sources, integrations, and agent configs a more connected and seamless experience across Grafana.
Easy organization, enhanced security with Grafana subfolders
Public preview available in Grafana OSS, Grafana Cloud (Free, Pro, Advanced), and Grafana Enterprise
No more searching for the Grafana dashboard you need. Resource management is easier with Grafana’s subfolders feature, which allows you to organize dashboards into folders based on business units, departments, teams, or whatever works best for your team.
Designed so you can mirror your organization’s structure within the Grafana UI, subfolders enable you to create a more self-serve observability solution for your teams. But within reason — you can now also assign users, teams, or role-specific permissions at the folder level. Thus you can limit access to sensitive information in each folder to authorized personnel only, while enhancing the overall security of your data.
With these user-friendly folder structures, sifting through your dashboards for the right visualization becomes easier, saving time (and your sanity) while safeguarding confidential data.
To get started creating subfolders, enable the nestedFolders feature toggle. If you’re using Grafana Cloud, and would like to enable this feature, please contact customer support. We recommend that you enable this feature only on test or development instances.
There’s supposed to be a video here, but for some reason there isn’t. Either we entered the id wrong (oops!), or Vimeo is down. If it’s the latter, we’d expect they’ll be back up and running soon. In the meantime, check out our blog!
More secure and scalable authentication
Addressing the common challenges for large organizations and Grafana Cloud users, Grafana 10 delivers revamped authentication capabilities, including a self-service SAML UI. By streamlining authentication workflows and encouraging teams to self-serve, you’ll maintain fine-grained and customized access control while also increasing organizational efficiency as your org grows.
Query private data sources without exposing your network
Public preview available in Grafana Cloud Pro and Advanced
Data security and privacy have become critical factors in today’s data-driven world. It’s essential to ensure that you can connect to your data sources without compromising the safety of your information.
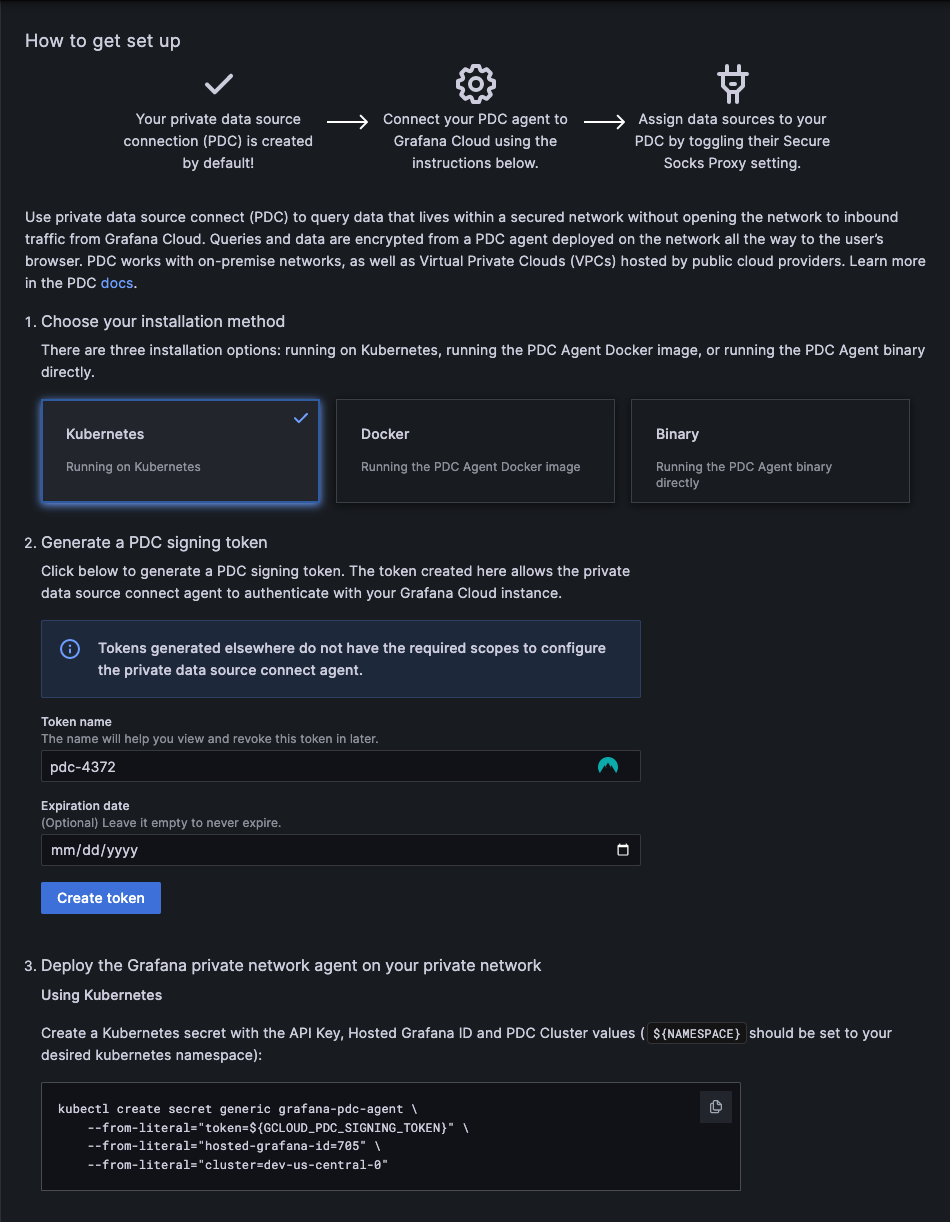
But some data sources run in private networks, like on-premises networks or virtual private clouds (VPCs). To query these data sources from Grafana Cloud, you had to open your private network to a range of IP addresses, a non-starter for many IT security teams. The challenge is, how do you connect to your private data from Grafana Cloud, without exposing your network?
In Grafana 10, we’re upping the ante in data security with Private Data Source Connect (PDC), which uses SOCKS over SSH to establish a secure connection between a lightweight PDC agent you deploy on your network and your Grafana Cloud stack. With PDC, you can now query private data sources from Grafana Cloud and maintain secure connections with your private data sources.
Easy SAML authentication setup in the Grafana UI
Generally available in Grafana OSS, Grafana Cloud (Free, Pro, Advanced), and Grafana Enterprise
With Grafana 10, we’re giving you the tools to independently set up SAML authentication for your teams. The new guided setup experience streamlines the SAML configuration process, eliminating the need to restart Grafana and reducing the likelihood of introducing errors.
This updated UI allows for swift and secure SAML authentication configuration, enhancing the security of your Grafana setup.
There’s supposed to be a video here, but for some reason there isn’t. Either we entered the id wrong (oops!), or Vimeo is down. If it’s the latter, we’d expect they’ll be back up and running soon. In the meantime, check out our blog!
Get started with Grafana 10
Whether you manage vast amounts of data, analyze metrics, or simply love creating compelling dashboards, Grafana 10 brings new capabilities that help you go beyond just visualizing data. You’ll be able to put together narratives that make sense of complex information, share your insights with a broader audience, or drive more impactful, confident decisions.
For a complete list of new features, check out the Grafana documentation, our changelog, or the What’s New in Grafana 10.0 documentation.
You can also join us on our Grafana Labs community forums to discuss any of the new features, workflows, or how to incorporate these changes into your dashboards, queries, and visualizations.
For a live demo of all the latest features, check out our GrafanaCON 2023 session “Deep dive into Grafana 10.”
Upgrade Grafana today
Download the latest version of Grafana today or try it out on Grafana Cloud, which has a generous forever-free tier and plans for every use case. Sign up for free today!
Refer to our upgrade Grafana documentation for more information about upgrading your Grafana installation.
Thank you!
A huge thanks to all the Grafana users who contributed by submitting PRs, bug reports, and feedback! Your involvement and support over the past decade has helped to make Grafana better with each release.
