

How to start monitoring your ClickHouse instance or cluster with Grafana Cloud
ClickHouse is an open source, column-oriented database management system designed for OLAP (analytical) workloads. ClickHouse supports various data formats and SQL queries, and is popular for clickstream analysis as well as log processing use cases.
We are pleased to announce that ClickHouse now has a dedicated observability integration in Grafana Cloud, which makes it easy to troubleshoot issues, track potential latency, and prevent data loss.
Let’s walk through how to easily set up a Grafana Cloud account and start monitoring ClickHouse today!
How to configure ClickHouse integration with Grafana Cloud
The ClickHouse integration utilizes metrics exposed by ClickHouse itself. To activate it, please confirm that the Prometheus section is activated in the config file.
Once that’s confirmed, go through these steps to get ready for monitoring your ClickHouse deployment with Grafana Cloud:
- A Grafana Cloud account is required to use the ClickHouse integration. If you don’t have a Grafana Cloud account, you can sign up for a free account today.
- In your Grafana instance on Grafana Cloud use the left-side navigation to get to the Connections Console (Home > Connections > Connect data).
- Install the ClickHouse Infrastructure Integration and configure the Grafana Agent to collect logs and metrics from it. Please refer to our documentation on how to install and manage integrations for more information. For details around configuring Grafana Agent for this integration, refer to the ClickHouse integration documentation.
Start monitoring your ClickHouse instance or cluster
After the integration is installed, you will see three prebuilt dashboards for ClickHouse and a set of ClickHouse-related alerts automatically installed into your Grafana Cloud account.
ClickHouse Overview dashboard
This dashboard gives a general overview of the ClickHouse instance or cluster based on all the metrics exposed by ClickHouse.

We monitor several metrics here, including:
ClickHouseMetrics_MemoryTrackingClickHouseProfileEvents_QueryClickHouseProfileEvents_SelectQueryClickHouseMetrics_MySQLConnection
The Overview dashboard also contains a log panel so you can correlate logs and metrics for troubleshooting. In order to see signals correlated on the same dashboard, job and instance labels must match for metrics scrape config and the logs scrape config in the Agent configuration file.
To get more information on how to set this up, refer to the corresponding documentation.

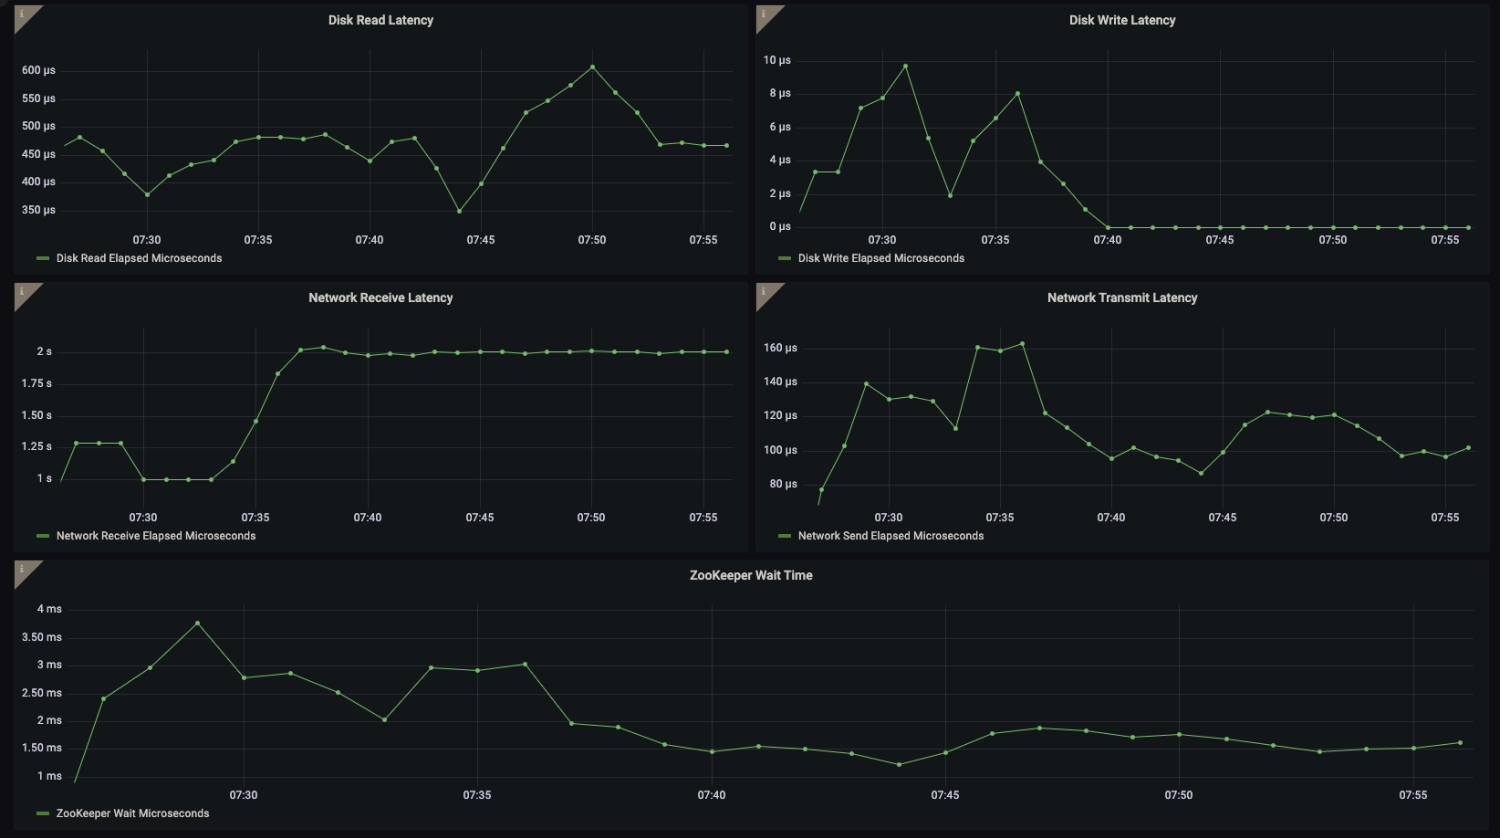
ClickHouse Latency dashboard
This dashboard will give you a good view and understanding of the current latencies, e.g., disk read and write, network latencies, and ZooKeeper wait times.
Now, you may be asking why you need to consider ZooKeeper latencies. The answer is simple: When you use ClickHouse in a distributed mode, ZooKeeper is used to coordinate the configuration and state of the cluster. Specifically, ZooKeeper is used to manage the list of nodes in the cluster, track the status of each node, and distribute configuration changes across the cluster. This ensures that each node in the cluster is aware of the other nodes and their status and configuration changes are propagated consistently.
If the ZooKeeper wait times are consistently high, it can indicate performance issues with the ZooKeeper cluster, which can cause problems with the overall operation of the distributed systems that rely on it, including ClickHouse.
ClickHouse Replica dashboard
Monitoring replicas in ClickHouse is crucial to ensure data consistency, accuracy, availability, and performance of the system. Replicas provide redundancy, fault tolerance, and enable distributed query processing. Early detection of issues allows for corrective action to be taken before they impact the system’s operation, ensuring optimal system performance and query accuracy.

ClickHouse alerts
The integration also comes packaged with a number of warnings and critical alerts. Let’s look a bit closer at two of them:
ClickHouseReplicationQueueBackingUp
This is a warning when the ClickHouse replication tasks are processing slower than expected, which causes replication queue size to back up and exceed the configured threshold value.
ClickHouseRejectedInserts
This is a critical alert! It’s triggered when ClickHouse inserts are rejected because items are inserted faster than ClickHouse is able to merge them. You will want to act immediately to make sure you don’t lose data.
When data ingestion fails due to issues such as data type mismatches, missing columns, or exceeded maximum insert size, the rejected inserts are logged in the system, along with the reason for rejection. These rejected inserts may result in data loss or delays in data ingestion, which can impact downstream systems and users who rely on the data for analysis and decision-making.
As always, all alerts thresholds are default examples, and can be configured to meet the needs of your environment.
Start monitoring ClickHouse with Grafana Cloud today
As we demonstrated in this blog, these dashboards and alerts can help you easily get your ClickHouse monitoring up and running. Give our ClickHouse integration a try, and let us know what you think! You can reach out to us in our Grafana Labs Community Slack in the #Integrations channel.
And if you’re looking to monitor additional environments, check out our solutions page for a list of other tools and platforms we can help you visualize and monitor with Grafana Cloud. At Grafana Labs, we have a “big tent” philosophy of providing a consistent experience across as many data sources and environments as possible, and we’re continuing to expand our integrations to support our community’s needs.
Grafana Cloud is the easiest way to get started with metrics, logs, traces, and dashboards. We have a generous forever-free tier and plans for every use case. Sign up for free now!


