How to manage CVE security vulnerabilities with Grafana, MergeStat, and OSV-Scanner
Patrick DeVivo is a software engineer and founder of MergeStat, an open source project that makes it possible to query the contents, history, and metadata of source code with SQL.
The security posture of software supply chains has been a significant topic lately. Recent high-profile breaches have shown the importance of managing risks from third party code. Take, for example, the Log4Shell vulnerability (tracked as CVE-2021-44228 — Grafana Labs was not affected). It had a huge impact on the industry when it was first disclosed due to the ubiquity of the dependency it appears in (the Log4J logging framework for Java) and the degree of impact a successful exploit could inflict (remote code execution).
Managing these security vulnerability risks should be a part of any organization’s software development practices, regardless of size or maturity. CVE exposure management is a key part of a software security program, and more tools and products are emerging to help engineering organizations mitigate and understand risks from third-party code. In early 2021, Google launched OSV (Open Source Vulnerabilities), a public dataset for consumers and maintainers of open source software to access and aggregate precise dependency vulnerability information. The OSV-Scanner project, a free open source tool for executing vulnerability scans against source code, was introduced soon after. The scanner looks at dependencies declared in a code base and compares them against the OSV dataset, looking for known CVEs.
In this post, I’ll show how Grafana, MergeStat, and OSV-Scanner can be used together to build a completely open source security vulnerability reporting and monitoring solution for source code.
Visualizing vulnerabilities
MergeStat syncs the output of open source tools (such as code scanners like OSV-Scanner) into an SQL database, enabling downstream reporting and querying in visualization tools such as Grafana.
Here’s what the resulting experience looks like in a Grafana dashboard:

We use this dashboard at MergeStat, and with a quick glance, we’re able to quickly see the following information about CVEs detected across our organization’s source code:
- The total count of vulnerabilities across all repos
- The average age of a vulnerability (based on its publication date)
- The distribution of vulnerabilities by severity across all repos
- The distribution of vulnerabilities by package ecosystem across all repos
- The distribution of vulnerability age (based on publication date)
- A table of all detected vulnerabilities
We created the dashboard using variables in Grafana, which makes it possible to quickly filter all the panels by repo. For example, if there are key code bases for which CVE information is more critical, the repo filter at the top of the dashboard can be used to cut down the dataset to only show detected vulnerabilities in those key repos. This may be useful for filtering out old or legacy code bases that are no longer deployed into production environments.
In the screenshot above, you can see data from OSV scans executed by MergeStat across all the public repositories in the CNCF organization on GitHub. We used this organization to collect sample public data to showcase the power and flexibility of the solution.
The benefits
Having a dashboard like the one above makes it possible to use entirely open source tools to set up a basic CVE reporting and management system. It allows users to quickly understand their exposure profile, and allows teams to prioritize where mitigations should be employed.
Understanding CVE exposure in general terms (across the organization, across projects, across ecosystems) allows for a broad survey of a company’s current security posture. Using and filtering this data allows an organization to focus on critical and high severity security vulnerabilities, such as in key repos first. This is important for prioritization of mitigations, as it can often be overwhelming when a program is first established.
Filtering the CVE results based on repository or package ecosystem (npm vs. python, for example) allows an organization to identify the teams or individuals who will play a central role in applying mitigations. That may include upgrading dependencies, applying patches, and more.
Many software organizations are adopting a “shift-left” approach to their software security by running security tools such as CVE scanners in CI pipelines. This can prevent builds and merges of insecure code when critical or high severity issues are detected. This dashboard alone won’t enable a shift-left solution; however, it’s a powerful overview and discoverability tool for security-conscious developers and software leaders.
How it works
MergeStat accesses source code from VCS hosts such as GitHub and GitLab. You can configure MergeStat to use the OSV-Scanner sync, which will schedule scans of your source code and store the results in a PostgreSQL database. This database is part of a MergeStat instance and can be connected to directly by tools such as Grafana for data visualization.
A data source is added to a Grafana instance to access the PostgreSQL database directly, allowing for visualizations and dashboards to be built accessing the OSV scan results.
The JSON export of this dashboard can be found here.
Using a CVE dashboard at your organization
To use this dashboard to monitor and report on CVEs on private code bases within your organization, you’ll need the following:
- A Grafana instance
- A MergeStat instance with Git repos added and the OSV-Scanner enabled
- The JSON export of the dashboard to import into your Grafana instance
Grafana instance
Follow the getting started guide to set up a new Grafana instance. Your instance will need to access the PostgreSQL database that MergeStat uses.
MergeStat instance
You’ll want an instance of MergeStat. You can follow the getting started guide for a local instance if you’re just looking to run an instance using Docker Compose.
You’ll also need to set up your MergeStat instance with Git repositories. Repositories can be automatically imported from a GitHub organization using an auto-import. This will allow MergeStat to add all the repos in a GitHub organization and pick up any new ones that are subsequently created.
Next, add the OSV-Scanner sync and enable it for the Git repos you want to run scans on. You can add the OSV-Scanner sync by navigating to Repo Syncs and clicking Add Sync.
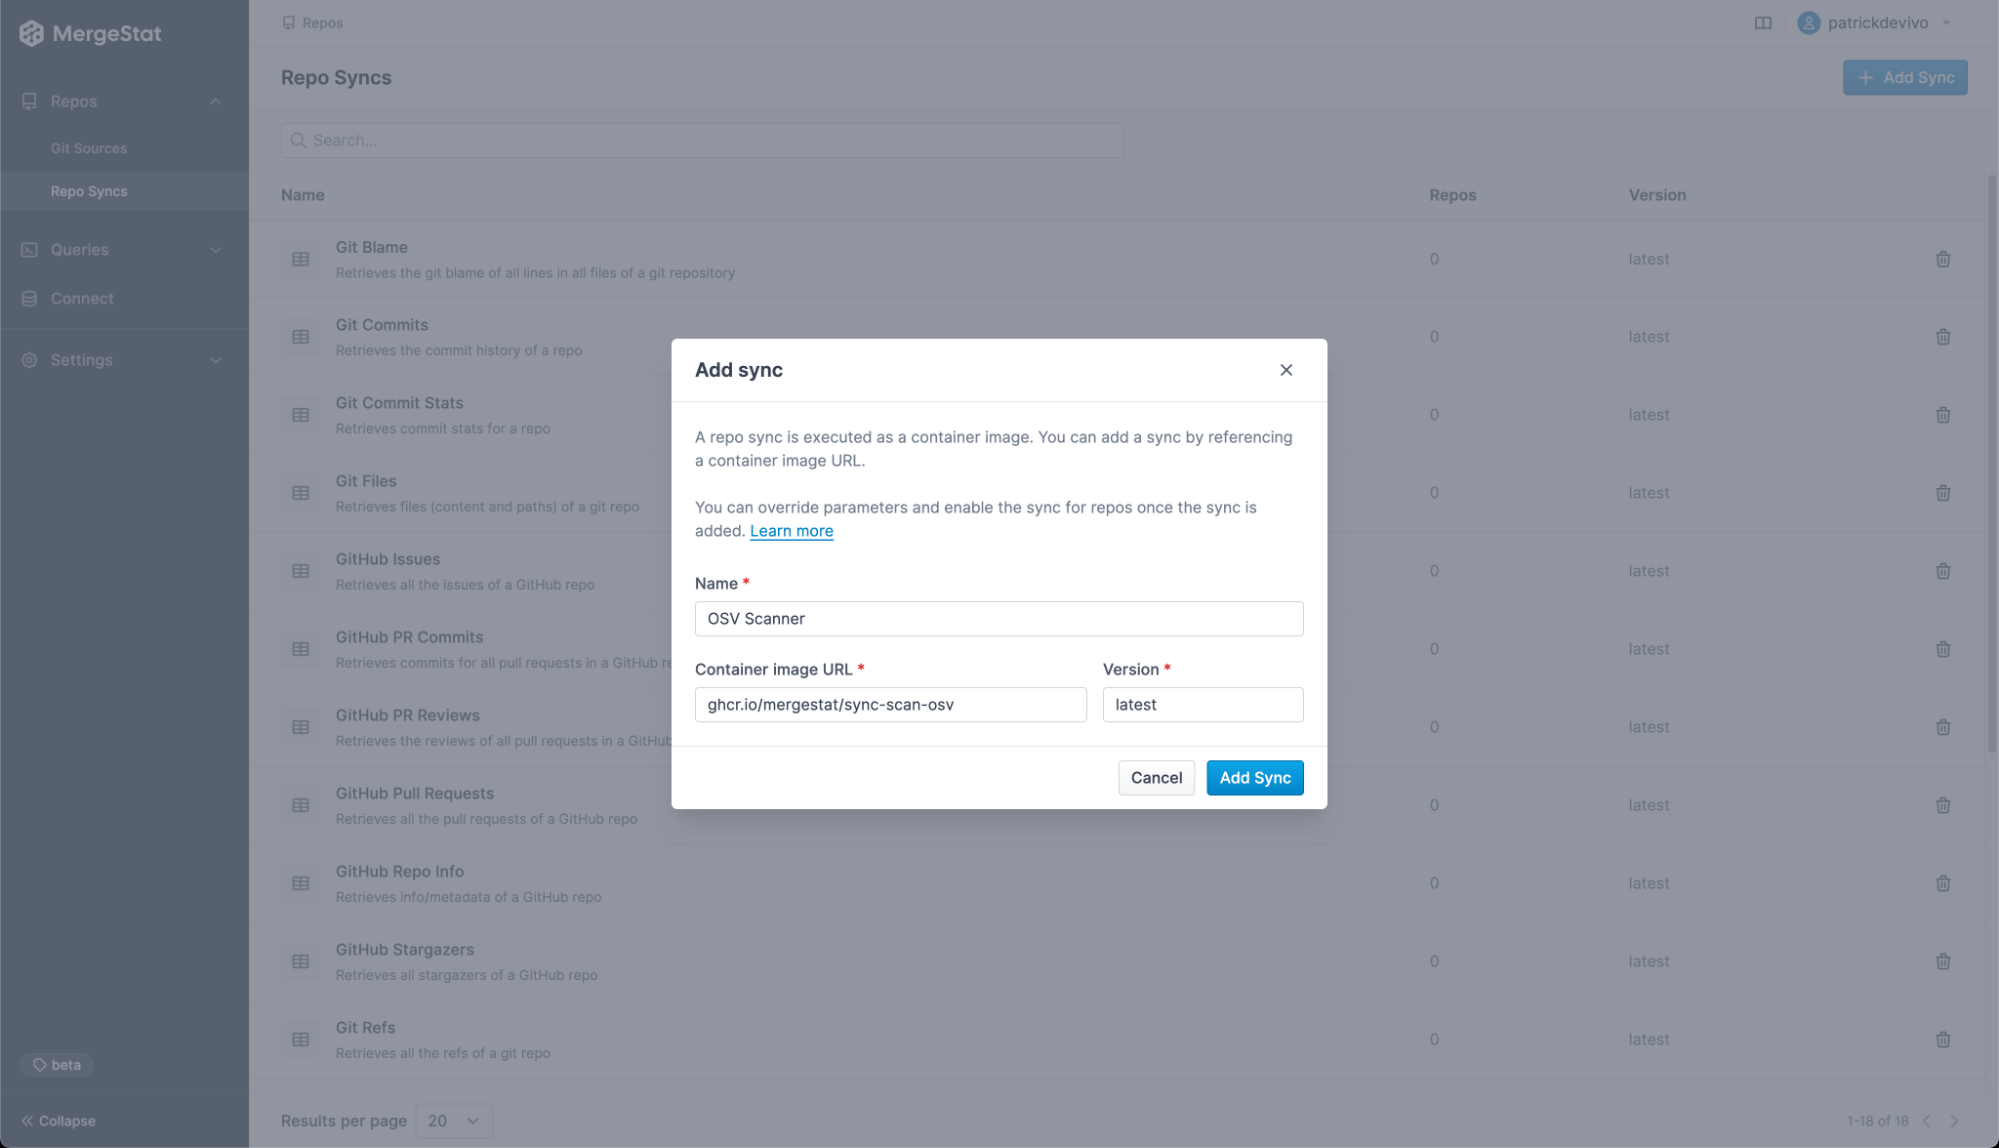
Specify ghcr.io/mergestat/sync-scan-osv as the container image and latest as the version. Finally, enable this sync to run on the Git repositories you want to scan, either by clicking Enable For All in the Git Source page, or one repo at a time on each repo page.
MergeStat will now run OSV-Scanner scans on your Git repos and stash the results in PostgreSQL.
Connecting MergeStat and Grafana
Finally, to get the full dashboard experience, you’ll need to connect your Grafana instance to the PostgreSQL database that MergeStat syncs to.
Add a new PostgreSQL data source to Grafana, and import this JSON export of the dashboard.
🎉And that’s it!
You should now have a fully open source CVE management and reporting solution using Grafana, MergeStat and the OSV-Scanner.
I hope these tools can be used together to help your organization manage CVE risk across your source code and mitigate application security vulnerability!
Want to share your Grafana story and dashboards with the community? Drop us a note at stories@grafana.com.