
How to use Argo CD to configure Kubernetes Monitoring in Grafana Cloud
Since Kubernetes Monitoring launched in Grafana Cloud last year, we have introduced highly customizable dashboards and powerful analytics features. We’ve also focused on how to make monitoring and managing resource utilization within your fleet easier and more efficient.
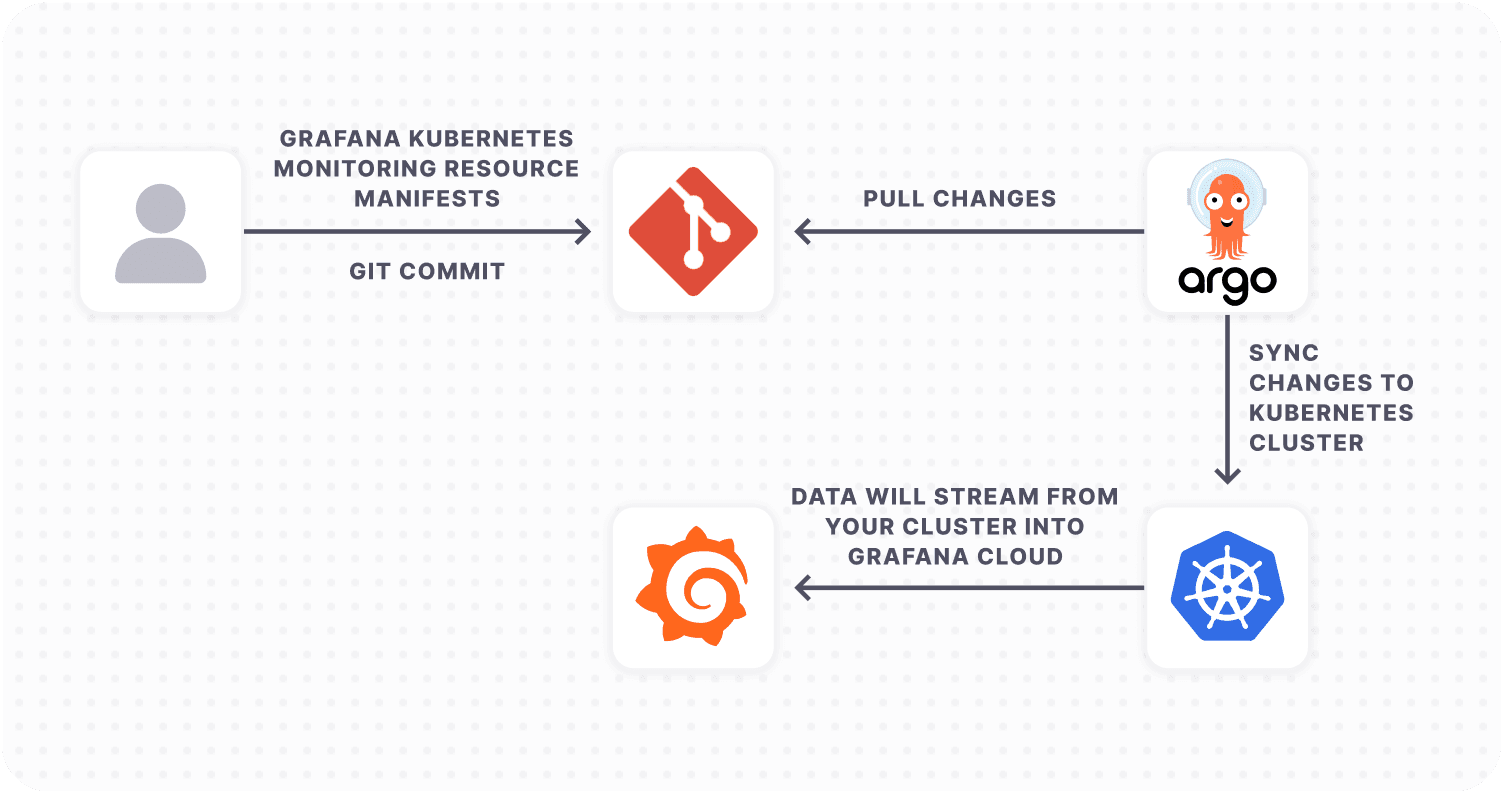
But what’s an easy way to add resources to your cluster while using Kubernetes Monitoring? ArgoCD has become the established tool for implementing GitOps workflows, simplifying the process of deploying and managing Kubernetes resources. If you are using Argo CD to manage your Kubernetes deployments, you can easily configure Grafana Cloud’s Kubernetes Monitoring solution to work with your cluster.
In this blog post, we’ll walk you through how to use Argo CD to configure Kubernetes Monitoring in Grafana Cloud.
What is Argo CD?
Argo CD is a declarative, open source GitOps continuous delivery tool that helps to automate the deployment of applications to Kubernetes clusters. It provides a centralized and standardized way of managing Kubernetes resources in large and complex environments. By using Argo CD, users can easily manage their Kubernetes resources and applications using Git repositories, allowing for version control and auditability.
Argo CD’s key features and capabilities include the ability to manually or automatically deploy applications to a Kubernetes cluster; automatic synchronization of application state to the current version of declarative configuration; a web user interface and command-line interface; and the ability to detect and remediate configuration drift. It also has role-based access control (RBAC), which allows for multi-cluster management, single sign-on (SSO) with various providers, and support for webhooks that trigger actions.
Why pair Argo CD with Kubernetes Monitoring in Grafana Cloud?
Kubernetes Monitoring in Grafana Cloud simplifies monitoring your Kubernetes fleet by:
- Deploying Grafana Agent with useful defaults for collecting metrics that aid in cardinality management.
- Providing custom queries to collect useful logs.
- Offering preconfigured dashboards, alert rules, and recording rules for users to plug into their existing infrastructure.
But there is some manual effort required to deploy the necessary resources for Kubernetes Monitoring in Grafana Cloud. Users have to copy the configurations and run the commands, which are outlined in Grafana Cloud. While easy enough to do, this process can quickly become error-prone, especially in larger, more complex environments where multiple teams may be deploying resources across multiple clusters. Plus each change must be verified and deployed to each cluster by hand.
As a result, GitOps tools like Argo CD can help to automate Kubernetes resource deployment. Argo CD takes a declarative, GitOps approach to Kubernetes resource management, allowing for automated and standardized deployments across multiple clusters. This method not only saves time, but also reduces the risk of deployment errors and inconsistencies.
There are three key advantages to deploying Kubernetes Monitoring with Argo CD:
- You’ll use a GitOps-based approach to manage resources required by Grafana Cloud’s Kubernetes Monitoring solution.
- It’s easier to make changes in a controlled environment to Grafana Agent configuration and resources.
- The Git repository would be maintained as a single source of truth for your Kubernetes resources.
Prerequisites for configuring Argo CD with Grafana Cloud
Before you begin, make sure you have the following available:
- Argo CD installed and running in your Kubernetes cluster
- A Git repository to store configuration files
- A Grafana Cloud account (You can sign up for free today!)
Metrics and events: Deploy Grafana Agent ConfigMap and StatefulSet
Create Grafana Agent ConfigMap
Note: The default scrape interval is set to 60s. Scrape intervals lower than 60s may result in increased costs (DPM > 1). To learn more, see our documentation on active series and DPM.
Replace ${NAMESPACE} with your namespace\ ${METRICS_USERNAME} with Prometheus Instance ID ${PROMETHEUS_URL} with the push endpoint URL of the Prometheus Instance\ ${LOGS_USERNAME} with Loki Username ${LOKI_URL} with the push endpoint URL of the Loki Instance\ ${GRAFANA_CLOUD_API_KEY} with your Grafana Cloud API Key
Paste the following script into your shell and run it to create the metrics Agent ConfigMap configuration file.
cat >> metrics.yaml <<'EOF'
apiVersion: v1
kind: ConfigMap
metadata:
 name: grafana-agent
 namespace: ${NAMESPACE}
data:
 agent.yaml: |
   metrics:
     wal_directory: /var/lib/agent/wal
     global:
       scrape_interval: 60s
       external_labels:
         cluster: cloud
     configs:
     - name: integrations
       remote_write:
       - url: ${PROMETHEUS_URL}
         basic_auth:
           username:${METRICS_USERNAME}
           password:${GRAFANA_CLOUD_API_KEY}
       scrape_configs:
       - bearer_token_file: /var/run/secrets/kubernetes.io/serviceaccount/token
         job_name: integrations/kubernetes/cadvisor
         kubernetes_sd_configs:
             - role: node
         metric_relabel_configs:
             - source_labels: [__name__]
               regex: container_fs_writes_bytes_total|container_memory_working_set_bytes|kube_statefulset_metadata_generation|kubelet_pod_worker_duration_seconds_bucket|container_memory_rss|kube_pod_owner|cluster:namespace:pod_cpu:active:kube_pod_container_resource_requests|container_cpu_cfs_periods_total|kubelet_pleg_relist_interval_seconds_bucket|kube_statefulset_status_update_revision|container_fs_writes_total|kube_pod_container_resource_requests|kube_deployment_metadata_generation|kubelet_certificate_manager_server_ttl_seconds|kube_node_status_allocatable|kubelet_running_pod_count|volume_manager_total_volumes|kube_pod_container_resource_limits|kube_persistentvolumeclaim_resource_requests_storage_bytes|rest_client_requests_total|kubelet_volume_stats_inodes_used|kube_job_status_start_time|node_namespace_pod_container:container_cpu_usage_seconds_total:sum_irate|container_memory_cache|node_namespace_pod_container:container_memory_swap|container_fs_reads_bytes_total|kube_horizontalpodautoscaler_status_current_replicas|kubelet_pod_start_duration_seconds_count|cluster:namespace:pod_cpu:active:kube_pod_container_resource_limits|namespace_workload_pod|kubelet_running_containers|kubernetes_build_info|kube_node_status_condition|node_namespace_pod_container:container_memory_cache|kubelet_cgroup_manager_duration_seconds_bucket|kube_pod_status_phase|container_network_transmit_packets_dropped_total|kubelet_runtime_operations_errors_total|kube_statefulset_status_current_revision|container_memory_swap|kubelet_volume_stats_capacity_bytes|process_cpu_seconds_total|kube_daemonset_status_desired_number_scheduled|kube_deployment_status_replicas_available|machine_memory_bytes|kube_node_info|kubelet_running_pods|kubelet_server_expiration_renew_errors|container_cpu_usage_seconds_total|namespace_workload_pod:kube_pod_owner:relabel|container_network_transmit_packets_total|go_goroutines|kube_pod_container_status_waiting_reason|kube_horizontalpodautoscaler_spec_min_replicas|kube_job_failed|kube_horizontalpodautoscaler_spec_max_replicas|kube_daemonset_status_current_number_scheduled|namespace_memory:kube_pod_container_resource_requests:sum|kubelet_node_name|kube_statefulset_replicas|namespace_cpu:kube_pod_container_resource_limits:sum|cluster:namespace:pod_memory:active:kube_pod_container_resource_requests|kube_statefulset_status_observed_generation|container_network_transmit_bytes_total|kubelet_volume_stats_available_bytes|kubelet_certificate_manager_client_ttl_seconds|kubelet_runtime_operations_total|node_namespace_pod_container:container_memory_rss|kubelet_pleg_relist_duration_seconds_bucket|storage_operation_errors_total|kubelet_certificate_manager_client_expiration_renew_errors|kube_pod_info|process_resident_memory_bytes|kubelet_pleg_relist_duration_seconds_count|kube_daemonset_status_number_misscheduled|container_network_receive_packets_dropped_total|node_filesystem_size_bytes|kube_statefulset_status_replicas_ready|kube_deployment_status_replicas_updated|kube_deployment_status_observed_generation|kube_deployment_spec_replicas|kube_statefulset_status_replicas_updated|node_quantile:kubelet_pleg_relist_duration_seconds:histogram_quantile|kube_namespace_status_phase|node_namespace_pod_container:container_memory_working_set_bytes|kubelet_pod_start_duration_seconds_bucket|cluster:namespace:pod_memory:active:kube_pod_container_resource_limits|kubelet_volume_stats_inodes|kube_daemonset_status_updated_number_scheduled|kube_replicaset_owner|container_network_receive_bytes_total|namespace_cpu:kube_pod_container_resource_requests:sum|container_fs_reads_total|kube_node_status_capacity|kube_node_spec_taint|storage_operation_duration_seconds_count|kubelet_pod_worker_duration_seconds_count|kube_resourcequota|node_filesystem_avail_bytes|kubelet_cgroup_manager_duration_seconds_count|kube_horizontalpodautoscaler_status_desired_replicas|namespace_memory:kube_pod_container_resource_limits:sum|container_cpu_cfs_throttled_periods_total|kubelet_node_config_error|kube_job_status_active|kube_daemonset_status_number_available|kube_statefulset_status_replicas|container_network_receive_packets_total|kube_pod_status_reason|kubelet_running_container_count|kube_namespace_status_phase|container_cpu_usage_seconds_total|kube_pod_status_phase|kube_pod_start_time|kube_pod_container_status_restarts_total|kube_pod_container_info|kube_pod_container_status_waiting_reason|kube_daemonset.*|kube_replicaset.*|kube_statefulset.*|kube_job.*|kube_node.*|node_namespace_pod_container:container_cpu_usage_seconds_total:sum_irate|cluster:namespace:pod_cpu:active:kube_pod_container_resource_requests|namespace_cpu:kube_pod_container_resource_requests:sum|node_cpu.*|node_memory.*|node_filesystem.*
               action: keep
         relabel_configs:
             - replacement: kubernetes.default.svc.cluster.local:443
               target_label: __address__
             - regex: (.+)
               replacement: /api/v1/nodes/${1}/proxy/metrics/cadvisor
               source_labels:
                 - __meta_kubernetes_node_name
               target_label: __metrics_path__
         scheme: https
         tls_config:
             ca_file: /var/run/secrets/kubernetes.io/serviceaccount/ca.crt
             insecure_skip_verify: false
             server_name: kubernetes
       - bearer_token_file: /var/run/secrets/kubernetes.io/serviceaccount/token
         job_name: integrations/kubernetes/kubelet
         kubernetes_sd_configs:
             - role: node
         metric_relabel_configs:
             - source_labels: [__name__]
               regex: container_fs_writes_bytes_total|container_memory_working_set_bytes|kube_statefulset_metadata_generation|kubelet_pod_worker_duration_seconds_bucket|container_memory_rss|kube_pod_owner|cluster:namespace:pod_cpu:active:kube_pod_container_resource_requests|container_cpu_cfs_periods_total|kubelet_pleg_relist_interval_seconds_bucket|kube_statefulset_status_update_revision|container_fs_writes_total|kube_pod_container_resource_requests|kube_deployment_metadata_generation|kubelet_certificate_manager_server_ttl_seconds|kube_node_status_allocatable|kubelet_running_pod_count|volume_manager_total_volumes|kube_pod_container_resource_limits|kube_persistentvolumeclaim_resource_requests_storage_bytes|rest_client_requests_total|kubelet_volume_stats_inodes_used|kube_job_status_start_time|node_namespace_pod_container:container_cpu_usage_seconds_total:sum_irate|container_memory_cache|node_namespace_pod_container:container_memory_swap|container_fs_reads_bytes_total|kube_horizontalpodautoscaler_status_current_replicas|kubelet_pod_start_duration_seconds_count|cluster:namespace:pod_cpu:active:kube_pod_container_resource_limits|namespace_workload_pod|kubelet_running_containers|kubernetes_build_info|kube_node_status_condition|node_namespace_pod_container:container_memory_cache|kubelet_cgroup_manager_duration_seconds_bucket|kube_pod_status_phase|container_network_transmit_packets_dropped_total|kubelet_runtime_operations_errors_total|kube_statefulset_status_current_revision|container_memory_swap|kubelet_volume_stats_capacity_bytes|process_cpu_seconds_total|kube_daemonset_status_desired_number_scheduled|kube_deployment_status_replicas_available|machine_memory_bytes|kube_node_info|kubelet_running_pods|kubelet_server_expiration_renew_errors|container_cpu_usage_seconds_total|namespace_workload_pod:kube_pod_owner:relabel|container_network_transmit_packets_total|go_goroutines|kube_pod_container_status_waiting_reason|kube_horizontalpodautoscaler_spec_min_replicas|kube_job_failed|kube_horizontalpodautoscaler_spec_max_replicas|kube_daemonset_status_current_number_scheduled|namespace_memory:kube_pod_container_resource_requests:sum|kubelet_node_name|kube_statefulset_replicas|namespace_cpu:kube_pod_container_resource_limits:sum|cluster:namespace:pod_memory:active:kube_pod_container_resource_requests|kube_statefulset_status_observed_generation|container_network_transmit_bytes_total|kubelet_volume_stats_available_bytes|kubelet_certificate_manager_client_ttl_seconds|kubelet_runtime_operations_total|node_namespace_pod_container:container_memory_rss|kubelet_pleg_relist_duration_seconds_bucket|storage_operation_errors_total|kubelet_certificate_manager_client_expiration_renew_errors|kube_pod_info|process_resident_memory_bytes|kubelet_pleg_relist_duration_seconds_count|kube_daemonset_status_number_misscheduled|container_network_receive_packets_dropped_total|node_filesystem_size_bytes|kube_statefulset_status_replicas_ready|kube_deployment_status_replicas_updated|kube_deployment_status_observed_generation|kube_deployment_spec_replicas|kube_statefulset_status_replicas_updated|node_quantile:kubelet_pleg_relist_duration_seconds:histogram_quantile|kube_namespace_status_phase|node_namespace_pod_container:container_memory_working_set_bytes|kubelet_pod_start_duration_seconds_bucket|cluster:namespace:pod_memory:active:kube_pod_container_resource_limits|kubelet_volume_stats_inodes|kube_daemonset_status_updated_number_scheduled|kube_replicaset_owner|container_network_receive_bytes_total|namespace_cpu:kube_pod_container_resource_requests:sum|container_fs_reads_total|kube_node_status_capacity|kube_node_spec_taint|storage_operation_duration_seconds_count|kubelet_pod_worker_duration_seconds_count|kube_resourcequota|node_filesystem_avail_bytes|kubelet_cgroup_manager_duration_seconds_count|kube_horizontalpodautoscaler_status_desired_replicas|namespace_memory:kube_pod_container_resource_limits:sum|container_cpu_cfs_throttled_periods_total|kubelet_node_config_error|kube_job_status_active|kube_daemonset_status_number_available|kube_statefulset_status_replicas|container_network_receive_packets_total|kube_pod_status_reason|kubelet_running_container_count|kube_namespace_status_phase|container_cpu_usage_seconds_total|kube_pod_status_phase|kube_pod_start_time|kube_pod_container_status_restarts_total|kube_pod_container_info|kube_pod_container_status_waiting_reason|kube_daemonset.*|kube_replicaset.*|kube_statefulset.*|kube_job.*|kube_node.*|node_namespace_pod_container:container_cpu_usage_seconds_total:sum_irate|cluster:namespace:pod_cpu:active:kube_pod_container_resource_requests|namespace_cpu:kube_pod_container_resource_requests:sum|node_cpu.*|node_memory.*|node_filesystem.*
               action: keep
         relabel_configs:
             - replacement: kubernetes.default.svc.cluster.local:443
               target_label: __address__
             - regex: (.+)
               replacement: /api/v1/nodes/${1}/proxy/metrics
               source_labels:
                 - __meta_kubernetes_node_name
               target_label: __metrics_path__
         scheme: https
         tls_config:
             ca_file: /var/run/secrets/kubernetes.io/serviceaccount/ca.crt
             insecure_skip_verify: false
             server_name: kubernetes
       - job_name: integrations/kubernetes/kube-state-metrics
         kubernetes_sd_configs:
             - role: pod
         metric_relabel_configs:
             - source_labels: [__name__]
               regex: container_fs_writes_bytes_total|container_memory_working_set_bytes|kube_statefulset_metadata_generation|kubelet_pod_worker_duration_seconds_bucket|container_memory_rss|kube_pod_owner|cluster:namespace:pod_cpu:active:kube_pod_container_resource_requests|container_cpu_cfs_periods_total|kubelet_pleg_relist_interval_seconds_bucket|kube_statefulset_status_update_revision|container_fs_writes_total|kube_pod_container_resource_requests|kube_deployment_metadata_generation|kubelet_certificate_manager_server_ttl_seconds|kube_node_status_allocatable|kubelet_running_pod_count|volume_manager_total_volumes|kube_pod_container_resource_limits|kube_persistentvolumeclaim_resource_requests_storage_bytes|rest_client_requests_total|kubelet_volume_stats_inodes_used|kube_job_status_start_time|node_namespace_pod_container:container_cpu_usage_seconds_total:sum_irate|container_memory_cache|node_namespace_pod_container:container_memory_swap|container_fs_reads_bytes_total|kube_horizontalpodautoscaler_status_current_replicas|kubelet_pod_start_duration_seconds_count|cluster:namespace:pod_cpu:active:kube_pod_container_resource_limits|namespace_workload_pod|kubelet_running_containers|kubernetes_build_info|kube_node_status_condition|node_namespace_pod_container:container_memory_cache|kubelet_cgroup_manager_duration_seconds_bucket|kube_pod_status_phase|container_network_transmit_packets_dropped_total|kubelet_runtime_operations_errors_total|kube_statefulset_status_current_revision|container_memory_swap|kubelet_volume_stats_capacity_bytes|process_cpu_seconds_total|kube_daemonset_status_desired_number_scheduled|kube_deployment_status_replicas_available|machine_memory_bytes|kube_node_info|kubelet_running_pods|kubelet_server_expiration_renew_errors|container_cpu_usage_seconds_total|namespace_workload_pod:kube_pod_owner:relabel|container_network_transmit_packets_total|go_goroutines|kube_pod_container_status_waiting_reason|kube_horizontalpodautoscaler_spec_min_replicas|kube_job_failed|kube_horizontalpodautoscaler_spec_max_replicas|kube_daemonset_status_current_number_scheduled|namespace_memory:kube_pod_container_resource_requests:sum|kubelet_node_name|kube_statefulset_replicas|namespace_cpu:kube_pod_container_resource_limits:sum|cluster:namespace:pod_memory:active:kube_pod_container_resource_requests|kube_statefulset_status_observed_generation|container_network_transmit_bytes_total|kubelet_volume_stats_available_bytes|kubelet_certificate_manager_client_ttl_seconds|kubelet_runtime_operations_total|node_namespace_pod_container:container_memory_rss|kubelet_pleg_relist_duration_seconds_bucket|storage_operation_errors_total|kubelet_certificate_manager_client_expiration_renew_errors|kube_pod_info|process_resident_memory_bytes|kubelet_pleg_relist_duration_seconds_count|kube_daemonset_status_number_misscheduled|container_network_receive_packets_dropped_total|node_filesystem_size_bytes|kube_statefulset_status_replicas_ready|kube_deployment_status_replicas_updated|kube_deployment_status_observed_generation|kube_deployment_spec_replicas|kube_statefulset_status_replicas_updated|node_quantile:kubelet_pleg_relist_duration_seconds:histogram_quantile|kube_namespace_status_phase|node_namespace_pod_container:container_memory_working_set_bytes|kubelet_pod_start_duration_seconds_bucket|cluster:namespace:pod_memory:active:kube_pod_container_resource_limits|kubelet_volume_stats_inodes|kube_daemonset_status_updated_number_scheduled|kube_replicaset_owner|container_network_receive_bytes_total|namespace_cpu:kube_pod_container_resource_requests:sum|container_fs_reads_total|kube_node_status_capacity|kube_node_spec_taint|storage_operation_duration_seconds_count|kubelet_pod_worker_duration_seconds_count|kube_resourcequota|node_filesystem_avail_bytes|kubelet_cgroup_manager_duration_seconds_count|kube_horizontalpodautoscaler_status_desired_replicas|namespace_memory:kube_pod_container_resource_limits:sum|container_cpu_cfs_throttled_periods_total|kubelet_node_config_error|kube_job_status_active|kube_daemonset_status_number_available|kube_statefulset_status_replicas|container_network_receive_packets_total|kube_pod_status_reason|kubelet_running_container_count|kube_namespace_status_phase|container_cpu_usage_seconds_total|kube_pod_status_phase|kube_pod_start_time|kube_pod_container_status_restarts_total|kube_pod_container_info|kube_pod_container_status_waiting_reason|kube_daemonset.*|kube_replicaset.*|kube_statefulset.*|kube_job.*|kube_node.*|node_namespace_pod_container:container_cpu_usage_seconds_total:sum_irate|cluster:namespace:pod_cpu:active:kube_pod_container_resource_requests|namespace_cpu:kube_pod_container_resource_requests:sum|node_cpu.*|node_memory.*|node_filesystem.*
               action: keep
         relabel_configs:
             - action: keep
               regex: kube-state-metrics
               source_labels:
                 - __meta_kubernetes_pod_label_app_kubernetes_io_name
       - bearer_token_file: /var/run/secrets/kubernetes.io/serviceaccount/token
         job_name: integrations/node_exporter
         kubernetes_sd_configs:
             - namespaces:
                 names:
                     - default
               role: pod
         metric_relabel_configs:
             - source_labels: [__name__]
               regex: container_fs_writes_bytes_total|container_memory_working_set_bytes|kube_statefulset_metadata_generation|kubelet_pod_worker_duration_seconds_bucket|container_memory_rss|kube_pod_owner|cluster:namespace:pod_cpu:active:kube_pod_container_resource_requests|container_cpu_cfs_periods_total|kubelet_pleg_relist_interval_seconds_bucket|kube_statefulset_status_update_revision|container_fs_writes_total|kube_pod_container_resource_requests|kube_deployment_metadata_generation|kubelet_certificate_manager_server_ttl_seconds|kube_node_status_allocatable|kubelet_running_pod_count|volume_manager_total_volumes|kube_pod_container_resource_limits|kube_persistentvolumeclaim_resource_requests_storage_bytes|rest_client_requests_total|kubelet_volume_stats_inodes_used|kube_job_status_start_time|node_namespace_pod_container:container_cpu_usage_seconds_total:sum_irate|container_memory_cache|node_namespace_pod_container:container_memory_swap|container_fs_reads_bytes_total|kube_horizontalpodautoscaler_status_current_replicas|kubelet_pod_start_duration_seconds_count|cluster:namespace:pod_cpu:active:kube_pod_container_resource_limits|namespace_workload_pod|kubelet_running_containers|kubernetes_build_info|kube_node_status_condition|node_namespace_pod_container:container_memory_cache|kubelet_cgroup_manager_duration_seconds_bucket|kube_pod_status_phase|container_network_transmit_packets_dropped_total|kubelet_runtime_operations_errors_total|kube_statefulset_status_current_revision|container_memory_swap|kubelet_volume_stats_capacity_bytes|process_cpu_seconds_total|kube_daemonset_status_desired_number_scheduled|kube_deployment_status_replicas_available|machine_memory_bytes|kube_node_info|kubelet_running_pods|kubelet_server_expiration_renew_errors|container_cpu_usage_seconds_total|namespace_workload_pod:kube_pod_owner:relabel|container_network_transmit_packets_total|go_goroutines|kube_pod_container_status_waiting_reason|kube_horizontalpodautoscaler_spec_min_replicas|kube_job_failed|kube_horizontalpodautoscaler_spec_max_replicas|kube_daemonset_status_current_number_scheduled|namespace_memory:kube_pod_container_resource_requests:sum|kubelet_node_name|kube_statefulset_replicas|namespace_cpu:kube_pod_container_resource_limits:sum|cluster:namespace:pod_memory:active:kube_pod_container_resource_requests|kube_statefulset_status_observed_generation|container_network_transmit_bytes_total|kubelet_volume_stats_available_bytes|kubelet_certificate_manager_client_ttl_seconds|kubelet_runtime_operations_total|node_namespace_pod_container:container_memory_rss|kubelet_pleg_relist_duration_seconds_bucket|storage_operation_errors_total|kubelet_certificate_manager_client_expiration_renew_errors|kube_pod_info|process_resident_memory_bytes|kubelet_pleg_relist_duration_seconds_count|kube_daemonset_status_number_misscheduled|container_network_receive_packets_dropped_total|node_filesystem_size_bytes|kube_statefulset_status_replicas_ready|kube_deployment_status_replicas_updated|kube_deployment_status_observed_generation|kube_deployment_spec_replicas|kube_statefulset_status_replicas_updated|node_quantile:kubelet_pleg_relist_duration_seconds:histogram_quantile|kube_namespace_status_phase|node_namespace_pod_container:container_memory_working_set_bytes|kubelet_pod_start_duration_seconds_bucket|cluster:namespace:pod_memory:active:kube_pod_container_resource_limits|kubelet_volume_stats_inodes|kube_daemonset_status_updated_number_scheduled|kube_replicaset_owner|container_network_receive_bytes_total|namespace_cpu:kube_pod_container_resource_requests:sum|container_fs_reads_total|kube_node_status_capacity|kube_node_spec_taint|storage_operation_duration_seconds_count|kubelet_pod_worker_duration_seconds_count|kube_resourcequota|node_filesystem_avail_bytes|kubelet_cgroup_manager_duration_seconds_count|kube_horizontalpodautoscaler_status_desired_replicas|namespace_memory:kube_pod_container_resource_limits:sum|container_cpu_cfs_throttled_periods_total|kubelet_node_config_error|kube_job_status_active|kube_daemonset_status_number_available|kube_statefulset_status_replicas|container_network_receive_packets_total|kube_pod_status_reason|kubelet_running_container_count|kube_namespace_status_phase|container_cpu_usage_seconds_total|kube_pod_status_phase|kube_pod_start_time|kube_pod_container_status_restarts_total|kube_pod_container_info|kube_pod_container_status_waiting_reason|kube_daemonset.*|kube_replicaset.*|kube_statefulset.*|kube_job.*|kube_node.*|node_namespace_pod_container:container_cpu_usage_seconds_total:sum_irate|cluster:namespace:pod_cpu:active:kube_pod_container_resource_requests|namespace_cpu:kube_pod_container_resource_requests:sum|node_cpu.*|node_memory.*|node_filesystem.*
               action: keep
         relabel_configs:
             - action: keep
               regex: prometheus-node-exporter.*
               source_labels:
                 - __meta_kubernetes_pod_label_app_kubernetes_io_name
             - action: replace
               source_labels:
                 - __meta_kubernetes_pod_node_name
               target_label: instance
             - action: replace
               source_labels:
                 - __meta_kubernetes_namespace
               target_label: namespace
         tls_config:
             ca_file: /var/run/secrets/kubernetes.io/serviceaccount/ca.crt
             insecure_skip_verify: false

   integrations:
     eventhandler:
       cache_path: /var/lib/agent/eventhandler.cache
       logs_instance: integrations
   logs:
     configs:
     - name: integrations
       clients:
       - url: ${GRAFANA_CLOUD_API_KEY}
         basic_auth:
           username: ${LOGS_USERNAME}
           password: ${LOKI_URL}
         external_labels:
           cluster: cloud
           job: integrations/kubernetes/eventhandler
       positions:
         filename: /tmp/positions.yaml
       target_config:
         sync_period: 10s
This ConfigMap configures the Grafana Agent StatefulSet to scrape the cadvisor, kubelet, and kube-state-metrics endpoints in your cluster. It also configures Grafana Agent to collect Kubernetes events from your cluster’s control plane and ship these to your Grafana Cloud Loki instance. To learn more about configuring Grafana Agent, see our Grafana Agent configuration reference docs.
Create Grafana Agent StatefulSet
Replace ${NAMESPACE} with your namespace and paste the following script into your shell and run it to create the configuration file for metrics Grafana Agent StatefulSet.
cat >> metrics-agent.yaml <<'EOF'
apiVersion: v1
kind: ServiceAccount
metadata:
 name: grafana-agent
 namespace: ${NAMESPACE}
---
apiVersion: rbac.authorization.k8s.io/v1
kind: ClusterRole
metadata:
 name: grafana-agent
rules:
- apiGroups:
 - ""
 resources:
 - nodes
 - nodes/proxy
 - services
 - endpoints
 - pods
 - events
 verbs:
 - get
 - list
 - watch
- nonResourceURLs:
 - /metrics
 verbs:
 - get
---
apiVersion: rbac.authorization.k8s.io/v1
kind: ClusterRoleBinding
metadata:
 name: grafana-agent
roleRef:
 apiGroup: rbac.authorization.k8s.io
 kind: ClusterRole
 name: grafana-agent
subjects:
- kind: ServiceAccount
 name: grafana-agent
 namespace: ${NAMESPACE}
---
apiVersion: v1
kind: Service
metadata:
 labels:
   name: grafana-agent
 name: grafana-agent
 namespace: ${NAMESPACE}
spec:
 clusterIP: None
 ports:
 - name: grafana-agent-http-metrics
   port: 80
   targetPort: 80
 selector:
   name: grafana-agent
---
apiVersion: apps/v1
kind: StatefulSet
metadata:
 name: grafana-agent
 namespace: ${NAMESPACE}
spec:
 replicas: 1
 selector:
   matchLabels:
     name: grafana-agent
 serviceName: grafana-agent
 template:
   metadata:
     labels:
       name: grafana-agent
   spec:
     containers:
     - args:
       - -config.expand-env=true
       - -config.file=/etc/agent/agent.yaml
       - -enable-features=integrations-next
       - -server.http.address=0.0.0.0:80
       env:
       - name: HOSTNAME
         valueFrom:
           fieldRef:
             fieldPath: spec.nodeName
       image: grafana/agent:v0.32.1
       imagePullPolicy: IfNotPresent
       name: grafana-agent
       ports:
       - containerPort: 80
         name: http-metrics
       volumeMounts:
       - mountPath: /var/lib/agent
         name: agent-wal
       - mountPath: /etc/agent
         name: grafana-agent
     serviceAccountName: grafana-agent
     volumes:
     - configMap:
         name: grafana-agent
       name: grafana-agent
 updateStrategy:
   type: RollingUpdate
 volumeClaimTemplates:
 - apiVersion: v1
   kind: PersistentVolumeClaim
   metadata:
     name: agent-wal
     namespace: ${NAMESPACE}
   spec:
     accessModes:
     - ReadWriteOnce
     resources:
       requests:
         storage: 5Gi
Kube-state-metrics
kube-state-metrics watches Kubernetes resources in your cluster and emits Prometheus metrics that can be scraped by Grafana Agent. To learn more, see the kube-state-metrics docs.
Replace ${Argo CD_NAMESPACE} with your namespace in which Argo CD is deployed and ${NAMESPACE} with the namespace where you want to deploy Kubernetes Monitoring resources. Then paste the following script into your shell and run it to create the configuration file for kube-state-metrics Argo CD application.
Node_exporter
Node_exporter is used to collect host metrics from each node in your cluster, and emits them as Prometheus metrics.
Replace ${Argo CD_NAMESPACE} with your namespace in which Argo CD is deployed and ${NAMESPACE} with the namespace where you want to deploy Kubernetes Monitoring resources. Then paste the following script into your shell and run it to create the configuration file for node_exporter Argo CD application.
cat >> node-exporter.yaml <<'EOF'
apiVersion: argoproj.io/v1alpha1
kind: Application
metadata:
 name: nodeexporter
 namespace: ${Argo CD_NAMESPACE}
spec:
 destination:
   name: ''
   namespace: ${NAMESPACE}
   server: 'https://kubernetes.default.svc'
 source:
   path: ''
   repoURL: 'https://prometheus-community.github.io/helm-charts'
   targetRevision: 4.16.0
   chart: prometheus-node-exporter
 sources: []
 project: default
 syncPolicy:
   automated:
     prune: true
     selfHeal: true
   retry:
     limit: 2
     backoff:
       duration: 5s
       maxDuration: 3m0s
       factor: 2
   syncOptions:
     - CreateNamespace=true
Logs: Deploy Grafana Agent ConfigMap and DaemonSet
Create Grafana Agent ConfigMap
Replace ${NAMESPACE} with your namespace\ ${METRICS_USERNAME} with Prometheus Instance ID ${PROMETHEUS_URL} with the push endpoint URL of the Prometheus Instance\ ${LOGS_USERNAME} with Loki Username ${LOKI_URL} with the push endpoint URL of the Loki Instance\ ${GRAFANA_CLOUD_API_KEY}
Paste the following script into your shell and run it to create the logs Agent ConfigMap configuration file.
cat >> logs.yaml <<'EOF'
apiVersion: v1
kind: ConfigMap
metadata:
 name: grafana-agent-logs
 namespace: ${NAMESPACE}
data:
 agent.yaml: |
   metrics:
     wal_directory: /tmp/grafana-agent-wal
     global:
       scrape_interval: 60s
       external_labels:
         cluster: cloud
     configs:
     - name: integrations
       remote_write:
       - url: ${PROMETHEUS_URL}
         basic_auth:
           username: ${METRICS_USERNAME}
           password: ${GRAFANA_CLOUD_API_KEY}
   integrations:
     prometheus_remote_write:
     - url: ${PROMETHEUS_URL}
       basic_auth:
         username: ${METRICS_USERNAME}
         password: ${GRAFANA_CLOUD_API_KEY}

   logs:
     configs:
     - name: integrations
       clients:
       - url: ${LOKI_URL}
         basic_auth:
           username: ${LOGS_USERNAME}
           password: ${GRAFANA_CLOUD_API_KEY}
         external_labels:
           cluster: cloud
       positions:
         filename: /tmp/positions.yaml
       target_config:
         sync_period: 10s
       scrape_configs:
       - job_name: integrations/kubernetes/pod-logs
         kubernetes_sd_configs:
           - role: pod
         pipeline_stages:
           - docker: {}
         relabel_configs:
           - source_labels:
               - __meta_kubernetes_pod_node_name
             target_label: __host__
           - action: replace
             replacement: $1
             separator: /
             source_labels:
               - __meta_kubernetes_namespace
               - __meta_kubernetes_pod_name
             target_label: job
           - action: replace
             source_labels:
               - __meta_kubernetes_namespace
             target_label: namespace
           - action: replace
             source_labels:
               - __meta_kubernetes_pod_name
             target_label: pod
           - action: replace
             source_labels:
               - __meta_kubernetes_pod_container_name
             target_label: container
           - replacement: /var/log/pods/*$1/*.log
             separator: /
             source_labels:
               - __meta_kubernetes_pod_uid
               - __meta_kubernetes_pod_container_name
             target_label: __path__
Create Grafana Agent DaemonSet
Replace ${NAMESPACE} with your namespace and paste the following script into your shell and run it to create the configuration file for Logs Grafana Agent DaemonSet.
cat >> logs-agent.yaml <<'EOF'
apiVersion: v1
kind: ServiceAccount
metadata:
 name: grafana-agent-logs
 namespace: ${NAMESPACE}
---
apiVersion: rbac.authorization.k8s.io/v1
kind: ClusterRole
metadata:
 name: grafana-agent-logs
rules:
- apiGroups:
 - ""
 resources:
 - nodes
 - nodes/proxy
 - services
 - endpoints
 - pods
 - events
 verbs:
 - get
 - list
 - watch
- nonResourceURLs:
 - /metrics
 verbs:
 - get
---
apiVersion: rbac.authorization.k8s.io/v1
kind: ClusterRoleBinding
metadata:
 name: grafana-agent-logs
roleRef:
 apiGroup: rbac.authorization.k8s.io
 kind: ClusterRole
 name: grafana-agent-logs
subjects:
- kind: ServiceAccount
 name: grafana-agent-logs
 namespace: default
---
apiVersion: apps/v1
kind: DaemonSet
metadata:
 name: grafana-agent-logs
 namespace: ${NAMESPACE}
spec:
 minReadySeconds: 10
 selector:
   matchLabels:
     name: grafana-agent-logs
 template:
   metadata:
     labels:
       name: grafana-agent-logs
   spec:
     containers:
     - args:
       - -config.expand-env=true
       - -config.file=/etc/agent/agent.yaml
       - -server.http.address=0.0.0.0:80
       env:
       - name: HOSTNAME
         valueFrom:
           fieldRef:
             fieldPath: spec.nodeName
       image: grafana/agent:v0.32.1
       imagePullPolicy: IfNotPresent
       name: grafana-agent-logs
       ports:
       - containerPort: 80
         name: http-metrics
       securityContext:
         privileged: true
         runAsUser: 0
       volumeMounts:
       - mountPath: /etc/agent
         name: grafana-agent-logs
       - mountPath: /var/log
         name: varlog
       - mountPath: /var/lib/docker/containers
         name: varlibdockercontainers
         readOnly: true
     serviceAccountName: grafana-agent-logs
     tolerations:
     - effect: NoSchedule
       operator: Exists
     volumes:
     - configMap:
         name: grafana-agent-logs
       name: grafana-agent-logs
     - hostPath:
         path: /var/log
       name: varlog
     - hostPath:
         path: /var/lib/docker/containers
       name: varlibdockercontainers
 updateStrategy:
   type: RollingUpdate
Git repository setup
The ideal setup is to have changes that are made to the main branch of your Git repository automatically synced within Kubernetes. To achieve this, follow the steps below:
- Create a folder in your Git repository (For this post, let’s create a folder named
kubernetes-monitoring). - Push all the manifest files for earlier steps (metrics.yaml, metrics-agent.yaml, kube-state-metrics.yaml, node-exporter.yaml, logs.yaml and logs-agent.yaml) into the newly created folder.
Argo CD application setup

In the Argo CD web interface, click on the New App button. Enter a name for the application, such as grafana-kubernetes-monitoring, and select the your desired project name (if there is none, select default) and sync policy as automatic. Select Prune Resources and Self Heal options to ensure configuration in Git Repository is always maintained within the Kubernetes cluster. Also tick the Auto-Create Namespace option and the Retry options.
Under Source, enter the URL for your Git repository along with the revision (by default it is HEAD). Set the path to the folder (kubernetes-monitoring).
Under Destination, enter your cluster URL. If it’s the same cluster where Argo CD is deployed, use https://kubernetes.default.svc and the namespace for creating the application resource. The namespace should be the same as the one where Argo CD is deployed.
Select Directory Recurse as its useful when having configuration files within nested folders
Finally, click on the Create button to create the application.
You can also run the below command to create the Argo CD application that monitors your Git Repository folder for changes. Make sure to replace ${GIT_REPO_URL} with your Git Repository URL; ${Argo CD_NAMESPACE} with your namespace in which Argo CD is deployed; and ${NAMESPACE} with the namespace where you want to deploy Kubernetes Monitoring resources.
cat <<'EOF' | kubectl apply -f -
apiVersion: argoproj.io/v1alpha1
kind: Application
metadata:
 name: kubernetes-monitoring
 namespace: ${Argo CD_NAMESPACE}
spec:
 destination:
   name: ''
   namespace: ${NAMESPACE}
   server: 'https://kubernetes.default.svc'
 source:
   path: kubernetes-monitoring
   repoURL: '${GIT_REPO_URL}'
   targetRevision: HEAD
   directory:
     recurse: true
 sources: []
 project: default
 syncPolicy:
   automated:
     prune: true
     selfHeal: true
   retry:
     limit: 3
     backoff:
       duration: 5s
       maxDuration: 3m0s
       factor: 2
   syncOptions:
     - CreateNamespace=true
Once the application has been created, the Kubernetes manifest defined in the Git repository will be automatically deployed.
Install prebuilt Grafana dashboards and alerts
Note: You must have the Admin role to install dashboards and alerts in Grafana Cloud.
Navigate to your Grafana Cloud instance and in the navigation menu, select Kubernetes under the Monitoring section.
Go to the configuration and click on Install dashboards and alert rules.
The configuration has been already completed, so you can now start viewing dashboards.
Once the metrics and logs from your Kubernetes cluster are being ingested into Grafana Cloud, you can:
- Easily navigate around your Kubernetes setup using a single UI. Begin with a cluster view and drill down to specific Kubernetes pods with the preconfigured Grafana dashboards.
- Use node observability. Find out more about node health along with pod density and node logs.
- Use the cluster efficiency dashboard. Understand your resource usage and use the information for capacity planning and optimizing costs and efficiency.
- Stay on top of your cluster. Use the preconfigured Grafana alerts to monitor your fleet.
Next steps for monitoring Kubernetes clusters with Grafana Cloud
Once you have settled into your new Argo CD configuration, you can continue to expand on your observability strategy with Kubernetes Monitoring in Grafana Cloud.
You can leverage the latest integrations available within the Kubernetes Monitoring solution such as Cert Manager, CockroachDB and more. To configure scraping application pod metrics, you can refer to our detailed documentation. And while Kubernetes Monitoring currently covers metrics and logs, to get a complete timeline into data transactions, request durations, and bottlenecks, it is also important to use traces. You can configure your applications to send traces to Grafana Agent, which can then be configured to send that tracing data to Grafana Cloud’s hosted tracing instance.
The easiest way to get started with Kubernetes Monitoring is with Grafana Cloud. We have a generous free forever tier and plans for every use case. Sign up for free today!

