Monitoring a furnace with Home Assistant, Prometheus, and Grafana
About three months ago, I began using Home Assistant (HA), the open source software for home automation. I live in Canada, and I wanted a way to monitor my natural gas furnace usage during the cold winter months. I’ve been working on making my home’s power and energy usage more observable because energy prices are high, I’m cheap, and I enjoy it.
When I couldn’t find any existing simple solutions for monitoring furnace usage, I realized it was a great opportunity to create a project with Grafana.
(Register for the GrafanaCON 2023 session “Get started with home automation with Raspberry Pi and Grafana Cloud” for more more project ideas.)
My goal was to be able to easily visualize how much my furnace runs over time. Let me take you through how I did it.
My Setup
This is everything I used for my project:
- Home Assistant OS running in Virtualbox
- Prometheus running in a Docker container
- Grafana OSS running in a Docker container
- Aqara Zigbee temperature sensor
- SONOFF Zigbee dongle connected to my home server
I’m not going to get into how to set up all of this from scratch, as there is plenty of documentation already out there that covers how to use each of these components. But keep in mind that the rest of this article assumes you have HA running, Prometheus scraping it, and Grafana connected to the Prometheus datasource.
Getting started
My furnace has no “smart” capabilities, and I didn’t want to have to modify it directly, so my solution was to put a temperature sensor in one of my home’s heating vents. The idea was that if I can count the number of minutes that the temperature increases in the vent (or the amount of time it senses a high temperature), that would be the number of minutes the furnace is running.

The Aqara sensor I bought came with a sticky mount and stuck to the inside of my vent pretty well. You’ll need to have the Zigbee integration installed in HA. Connecting the sensor was really easy. All I needed to do was tell the Zigbee integration to search for devices, then hold the reset button on the sensor for five seconds.
Creating my Grafana dashboard
Once everything was connected, it was time to build my dashboard. The only metric I needed to collect was temperature.
My first step was to create a panel with the raw temperature data. This data will populate almost immediately after you connect the temperature sensor, unless you have set Prometheus to scrape at a very large interval. Initially, I recorded the times when I heard my furnace start and stop on a notepad. I noticed it aligned almost perfectly with when the temperature started increasing, and then rapidly fell off.

When I saw this graph, one thing that surprised me was the warmth of the air my furnace was producing. Apparently furnaces will heat the air to approximately double the desired temperature.
Once I had that panel set up and I could visualize each time series, I wanted to find the total number of minutes that the time series spent increasing. I could find the rate of change of the series if I took the derivative of it. Thankfully, Prometheus already has the deriv() function for this. Since I only want increasing change in this case, only positive values matter.
I could see the time the temperature spent increasing by using the following Prometheus query:
deriv(hass_sensor_temperature_celsius{friendly_name="vent_temp Temperature"}[1m]) > bool 0It was important that I kept the query resolution to 1m since I needed to keep the measurements at that granularity.
After running the query, it produced a binary-looking time series. A value of 1 meant the temperature was increasing at that time, and a value of 0 meant it was not. Since the query resolution was 1 minute, I could sum all of these values over my desired time range to find how many minutes the furnace was running.

I needed to apply some transformations to find the sum of all points in the above time series whose value is 1. To access all of my metric labels in table format, I opened the panel query, expanded the options section, and selected Table in the Format dropdown.

Looking at the data in its table form, every minute has a Value column (far right, below). Once again, a value of 1 means the temperature was increasing at that minute, and a value of 0 means it was not.
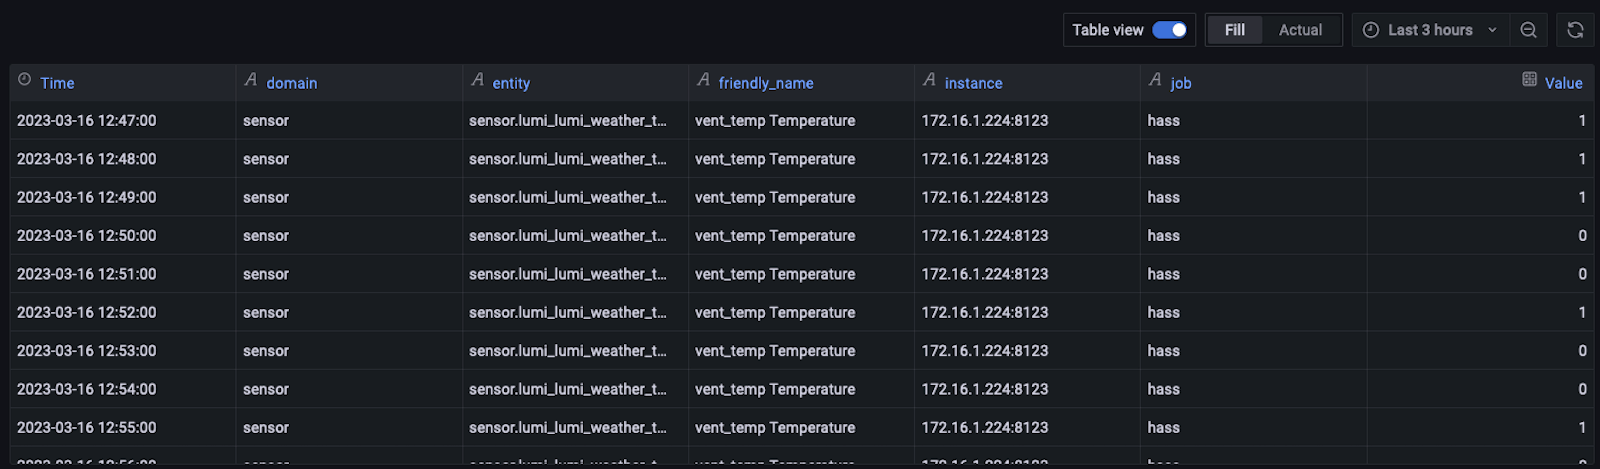
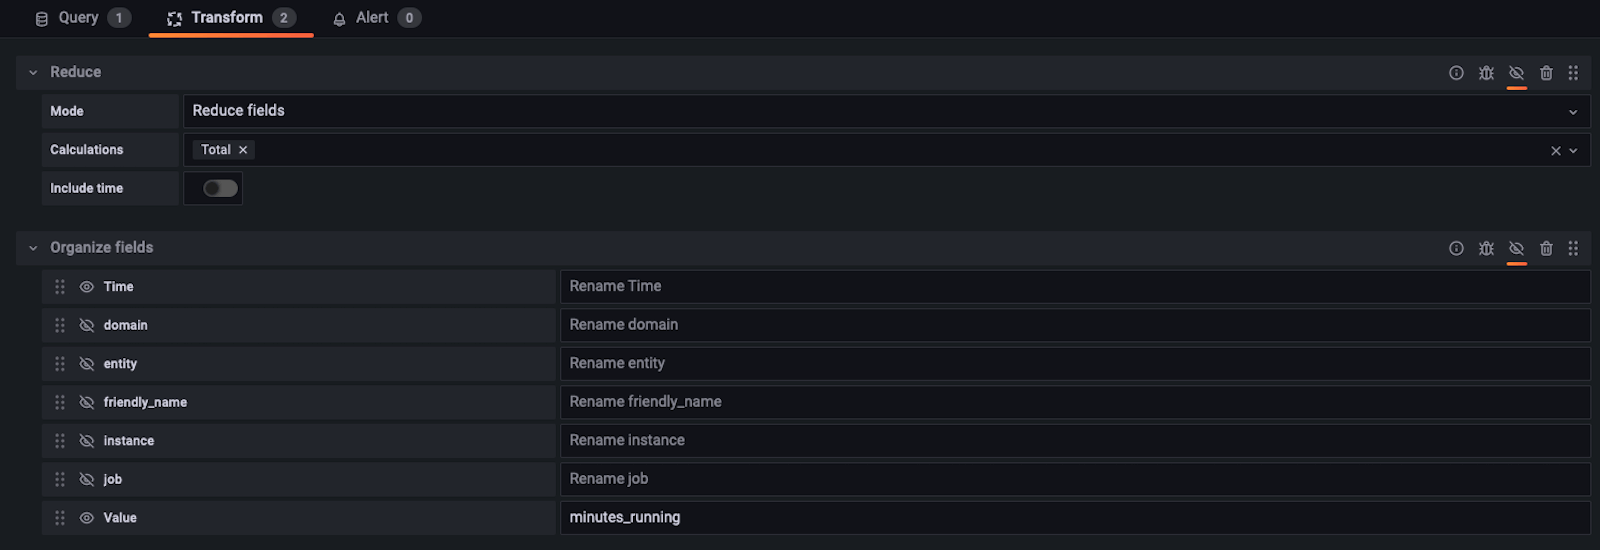
In order to get the number of minutes the furnace was running, I needed to sum all of the values in the Value column, rename the resulting column to minutes_running, and exclude all other columns from the results in the table above, since I only care about how long the furnace has been running.
I did this by selecting the Transform window, then adding a Reduce transformation and then an Organize fields transformation.
My final step was to set up a stat panel to display that data — which is the total number of minutes my furnace has been running for the dashboard’s time range.

This is the final view of the heating section of my home’s energy dashboard.

Due to the 1 minute query resolution, I hit the maximum points you can have in a Prometheus series (11,000) once I went back about a week, so I ended up adding the panel called Historical Furnace Usage.
If you have access to the recorded queries feature, this would be a great use case for that. I didn’t, since I was running Grafana OSS on my home server, so I had to hack my own version of a recorded query together separately.
The takeaways
Overall, this was a fun project and has been a good addition to my home’s observability. I used it frequently in the winter to see how changing my thermostat temperature affected the furnace running time.
I could see how much I was saving by lowering one, two, or three degrees, so I tried to turn the thermostat down more permanently, but my wife vetoed that. Ultimately, we didn’t use the furnace less, but I had data to support my argument for turning it down, which felt like a win.
As for the next steps for my home’s observability, as the weather starts to get warmer, I need to start tracking the time my air conditioner is running (which should be able to be done the same way) and set up power usage monitoring with the Emporia Vue.
Want to share your Grafana story and dashboards with the community? Drop us a note at stories@grafana.com.