
Identify unused, costly metrics with Cardinality Management dashboards in Grafana Cloud
Organizations are dealing with an explosion of metric data as they shift to cloud native architectures and adopt tools like Prometheus and Kubernetes. This in turn can lead to surges in spending on observability metrics. So while teams want a way to scale out metrics adoption to improve their observability — and thus, improve system performance and reliability — they also need to be mindful of skyrocketing costs that could scuttle those efforts before showing meaningful results.
We recently launched Adaptive Metrics, a new feature in Grafana Cloud that enables teams to aggregate unused and partially used metrics into lower cardinality versions of themselves to reduce costs. We also made improvements to another part of our cost management toolset — our Cardinality Management dashboards, which have been upgraded to provide even better insights into your organization’s usage of high cardinality metrics. They’ve also been made available to all Grafana Cloud customers, including those on the Grafana Cloud Free tier.
Let’s take a closer look at how these dashboards can start surfacing unused and costly metrics, and how you can easily pair the dashboards with Adaptive Metrics so you can start saving money today.
Benefits of the enhanced Cardinality Management dashboards
The original Cardinality Management dashboards were introduced late last year to Grafana Cloud Pro and Advanced customers and were aimed at surfacing high cardinality metrics and labels.
Now, these dashboards also supplement cardinality information by indicating whether a metric is used or not. This might sound like a small change, but it can have a big impact on your bottom line when used wisely.
Previously, you could use the Cardinality Management dashboards to easily pinpoint high cardinality metrics that were the biggest contributors to your organization’s metrics spend, but you didn’t necessarily know whether those metrics were important to your operations.
This made it difficult to take action. Imagine trying to root cause an incident and a metric you depend upon is gone. On the other hand, if you don’t drop any high cardinality metrics, you may miss an easy opportunity to lower your costs. With this update, you have the context you need to make informed decisions about those metrics.
How to analyze metrics usage with Cardinality Management dashboards in Grafana Cloud
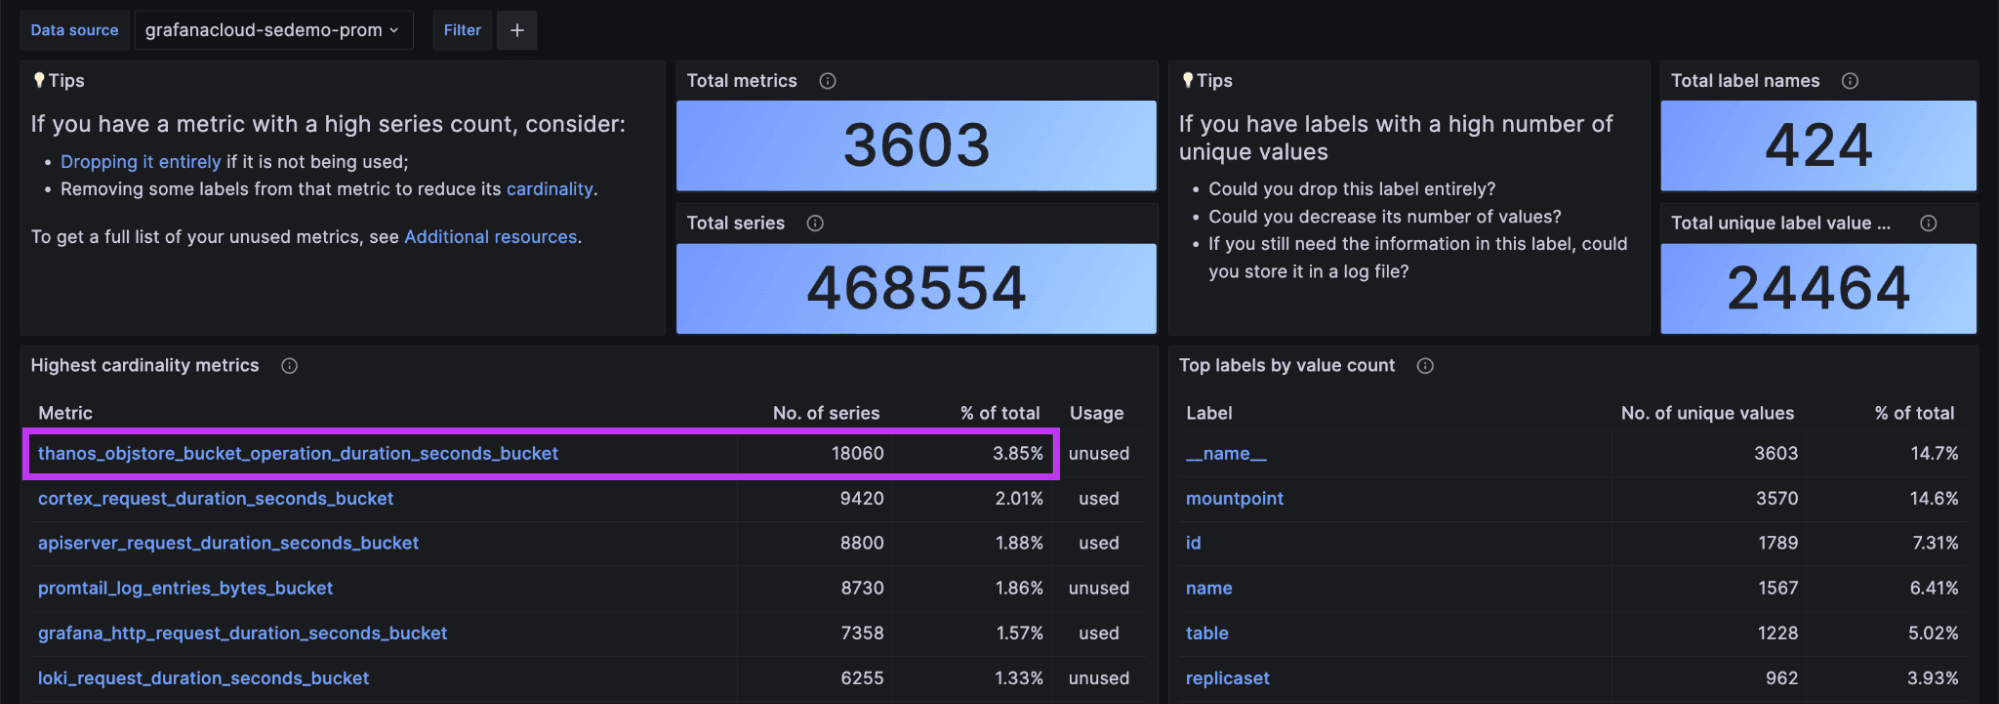
To use the Cardinality Management dashboards, we recommend starting with the Overview dashboard. Upon opening it, you’ll see a summary of the highest cardinality metrics and labels for the selected datasource.
In the screenshot below, for example, you can see that the metric “thanos_objstore_bucket_operation_duration_seconds_bucket,” is the highest cardinality metric.
The newest addition to the Overview dashboard is the Usage column. Every metric is marked either “used” or “unused,” depending on whether there is any reference to it. This Usage indicator is recalculated every 24 hours to provide an up-to-date view of your activity.
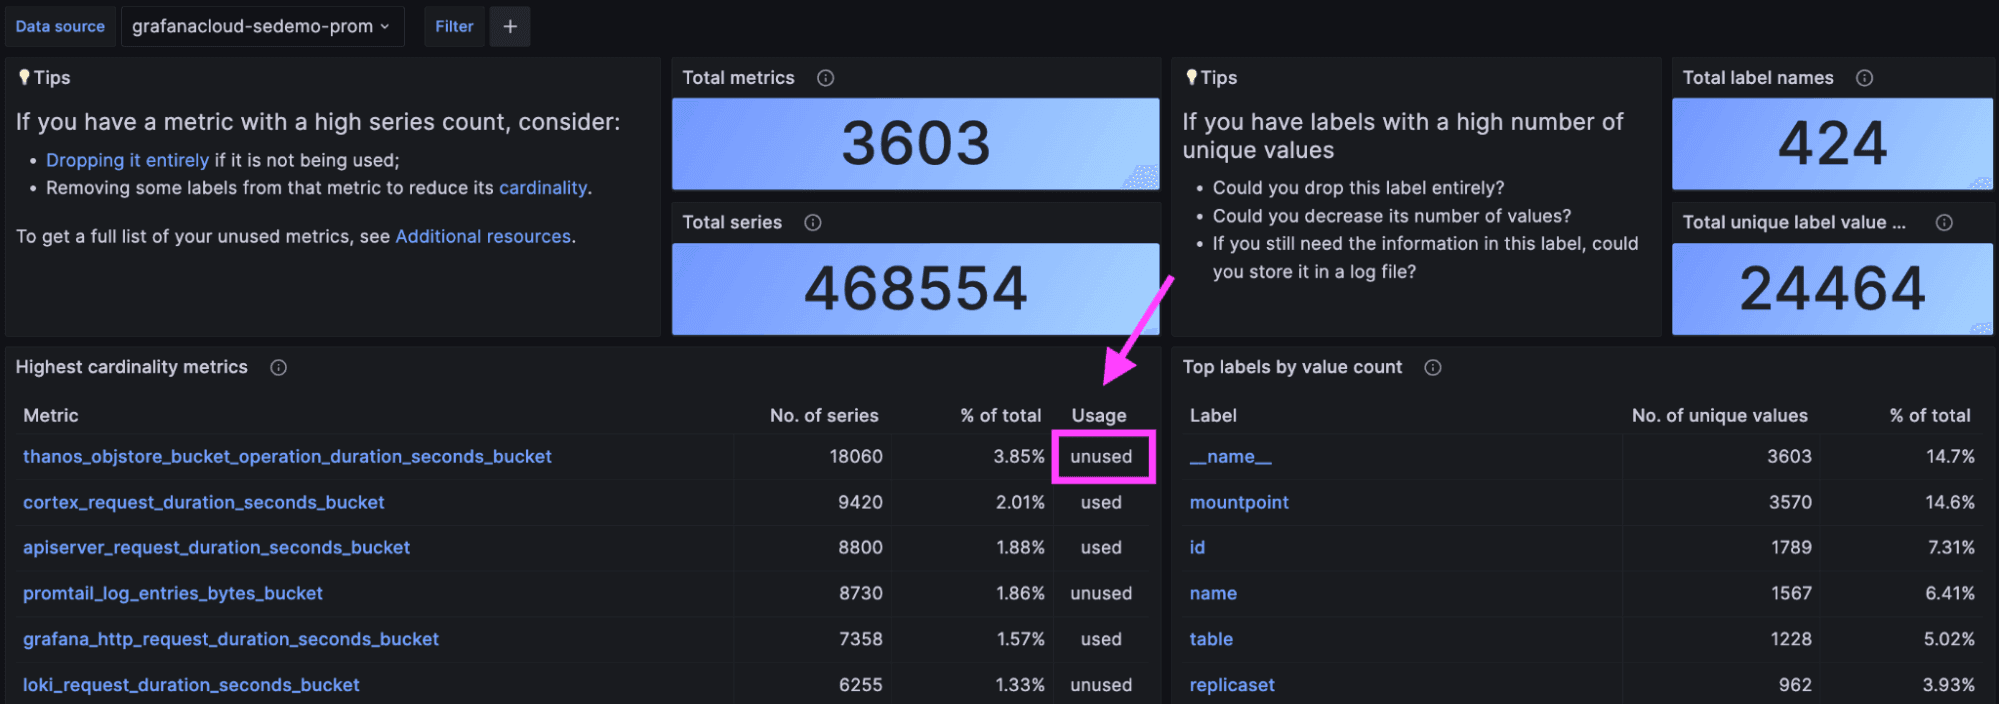
To calculate this Usage indicator, we scan the dashboards, alerting rules, and recording rules installed in your Grafana Cloud account, as well as the last 30 days of queries you’ve run. By analyzing 30 days of query logs, we also detect if someone is querying the metric via Grafana Explore or via API call. The latter case is a common pattern for people who want to write a script that programmatically accesses metrics stored in Grafana Cloud.
Equipped with this usage and cardinality data, you can now make an informed decision. For example, you can stop remote writing the metric “thanos_objstore_bucket_operation_duration_seconds_bucket” to Grafana Cloud and reduce your series count by ~18,000. You can do so with the assurance that you won’t break any existing dashboards, alerts, or recording rules. You’ll also know no one has queried this metric in the last 30 days.
To stop remote writing a metric like this to Grafana Cloud, you can use Prometheus relabel configs. They allow you to define a label and/or metric name pattern that matches specific metrics and then define an action to apply to those matched metrics. To drop the “thanos_objstore_bucket_operation_duration_seconds_bucket” metric from being written by your Grafana Agent or Prometheus to Grafana Cloud, you’d write a relabel rule that looks like this:
  write_relabel_configs:
  - source_labels: [__name__]
    regex: "thanos_objstore_bucket_operation_duration_seconds_bucket"
    action: drop
You’d add this relabel configuration to your Prometheus or Grafana Agent remote write configuration.
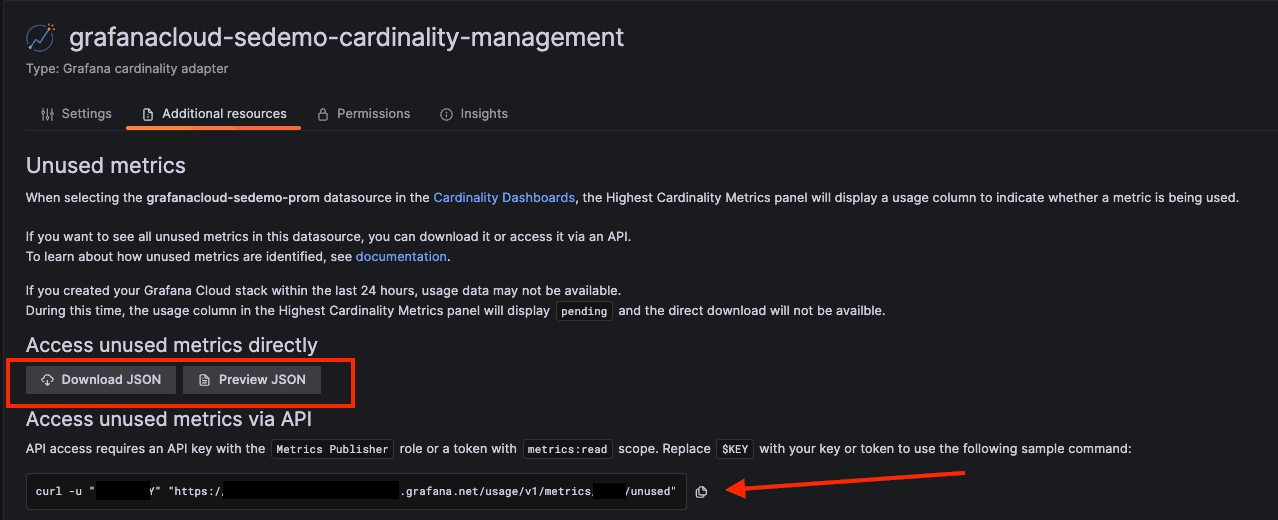
If you want to focus exclusively on unused metrics, click the Additional resources link to get a full list.

From there, you can download or preview the unused metrics list as a JSON document. Alternatively, you can retrieve the list via API call.
Cardinality dashboards vs. Mimirtool
You can get similar insight from Mimirtool’s analyze command, which provides statistics about metrics cardinality and usage for a Prometheus or single tenant in OSS Mimir or Grafana Enterprise Metrics (GEM).
With the addition of usage information, the Cardinality Management dashboards now offer this same functionality, but with these additional benefits:
- No need to run it yourself. The usage indicator in the dashboards runs automatically and refreshes every 24 hours; running Mimirtool is a manual, multi-step process.
- Usage analysis now includes query logs. Mimirtool only looks at metrics usages in dashboards, alerts, and recording rules, which means it misses metrics usage from ad-hoc queries via Grafana Explore or API call.
The one caveat of the Cardinality Management dashboards is that they provide cardinality and usage information about metrics stored in Grafana Cloud. Prometheus, Mimir, and GEM users can still use Mimirtool.
Pair Cardinality Management with Adaptive Metrics to save money
As we’ve discussed, the Cardinality Management dashboards help you make an informed decision about your metrics, but not everyone wants to go through the manual process of changing those metrics. Observability teams and developers have to write the required relabel configurations and update the configuration of potentially hundreds or thousands of Grafana Agents or Prometheis. In some cases, the team in charge of observability may not even have access to these configuration files, making it difficult or impossible to roll out the needed changes.
Moreover, metric usage is not binary. A metric could be used by some queries, but only have a subset of its labels ever accessed. You limit your potential to reduce cardinality — and save money — by focusing solely on completely unused metrics.
Grafana Cloud’s Adaptive Metrics feature addresses these limitations head on. In addition to identifying unused metrics, it also spots partially used metrics — metrics that are used in some capacity but have some labels that are never needed. From there, its powerful aggregation engine can strip away unused labels for you to create lower cardinality versions of these unused and partially used metrics.
This aggregation engine is a part of Grafana Cloud and configurable via API or CLI, making it extremely low effort to apply — and revert, if needed — metrics aggregations. Because Adaptive Metrics analyzes your usage patterns, it can recommend aggregation rules that are guaranteed to keep your dashboards, alerts, recording rules, and historic queries working as they did before aggregation; no rewrites needed.
Based on results from private preview testers, Grafana Cloud Adaptive Metrics can eliminate an estimated 20%-50% of an organization’s time series with no impact on their ability to observe their systems.
Grafana Cloud Adaptive Metrics is now available in a public access program for all Grafana Cloud tiers. Sign up for access here. And if you want to learn more about this new feature, sign up for our upcoming webinars in the Americas and Asia-Pacific.
Grafana Cloud is the easiest way to get started with metrics, logs, traces, and dashboards. We have a generous free forever tier and plans for every use case. Sign up for free now!

