
Monitor Linux with ease: the Grafana Cloud integration gets a major update
Linux is a popular open source operating system used by developers, businesses, and individuals around the world. Linux is known for its flexibility, security, and reliability, making it an excellent choice for servers, desktops, and embedded devices. It’s also widely used in the cloud, powering many of the world’s largest websites and applications
Thanks to the popularity and prevalence of Linux, it’s also one of the most used integrations for Grafana Cloud, which is why we’re excited to share some recent updates that make the Linux integration for Grafana Cloud even more useful!
You’ll find more details below, but in short, this is what we added:
- A three-tier view of Linux nodes with new dashboard types — fleet view, node-specific overview, and drill down
- Links and data links for better navigation between views
- A Grafana Agent filter config to reduce the number of time series generated per node
- New alerts for better control of your Linux instances
- Grafana’s annotations for important events: Reboot, OOM kill, kernel update.
Why the Linux node integration update is important
Fleet view
Previously, the Linux integration was focused on analyzing metrics and logs from a single specific instance. But if you are in a production environment, you might be controlling hundreds of thousands of VMs, so cycling through all of them is not an easy task.
The fleet view dashboard is the single pane of glass that could help you spot any issues or anomalies with your nodes:

A table view here lists all your nodes’ main stats and info. Below that, graphs display the top 25 nodes by CPU, memory/disk, and usage, respectively. These can help to spot high resource usage or saturation.
Once spotted, use table links or your graphs’ data links to jump to the specific host for further inspection. You can create data links to provide more granular context to your links, such as including the series name or even the value under the cursor. For example, if your visualization showed four servers, you could add a data link to one or two of them.
The Fleet view dashboard, together with the Grafana Ansible collection agent role, is the part of toolstack to ease Linux fleet management that is connected to Grafana Cloud: Ansible helps to deploy and update Grafana Agents at scale, while the Linux integration helps to view the data.
Overview dashboard
When you click on one of the links in your fleet view dashboard, it takes you to the overview dashboard, which gives you the most informative metrics and logs about the specific node. In addition to existing CPU, memory, disk and network metrics views, the updated Linux integration adds a new informational row on the top, to give you a better idea of what machine it is, and what resources are provisioned.

From here, if you need to further investigate a specific resource group, such as memory or network, you can easily do so by jumping to one of the drill down dashboards.
Drill down dashboards
Let’s say you suspect a networking stack issue with the node. You can find more networking metrics and their trends by jumping to the network dashboard from the overview dashboard by clicking on Other Nodedashboards:

This would include interfaces stats as well as socket stats and protocol metrics for TCP, UDP, and more.
Drill down dashboards are also available for memory, disks and filesystem, and CPU subsystems. For example, here’s what a CPU subsystem dashboard could look like:

Metrics filtering
This Linux integration update also comes bundled with Grafana Agent’s new recommended configuration to filter unlikely, yet helpful metrics coming from the node_exporter(unix) integration module. Dropping such metrics could reduce the number of time series collected by a third, especially if Linux nodes are used as Kubernetes nodes, thus helping to optimize your Grafana Cloud costs.
(Note: If you already have Grafana Agent deployed and running, click here to see if your configuration needs updating.)
New alerts
If you have a large node fleet, alerts — along with the new fleet view — are instrumental in helping you track any problems that may arise. In this update, we introduced six new alerts to help you track high resource usage or resource saturation on the nodes. For instance, NodeSystemSaturation alert could help you get notified when systems are likely to exhaust their existing resources so you can take appropriate measures.
Reboot annotations to correlate events and metrics
While we at Grafana Labs believe there are as many as four pillars of observability (metrics, logs, traces, and continuous profiling as the emerging fourth), that’s not to say there aren’t other considerations. In fact, some see events as another pillar of observability. The point here is events can be an important part of your observability strategy, and Grafana annotations are great for visualizing critical events and correlating them with metrics.
In this update, we added three events as annotations: System reboot, kernel change, and OOM kill:
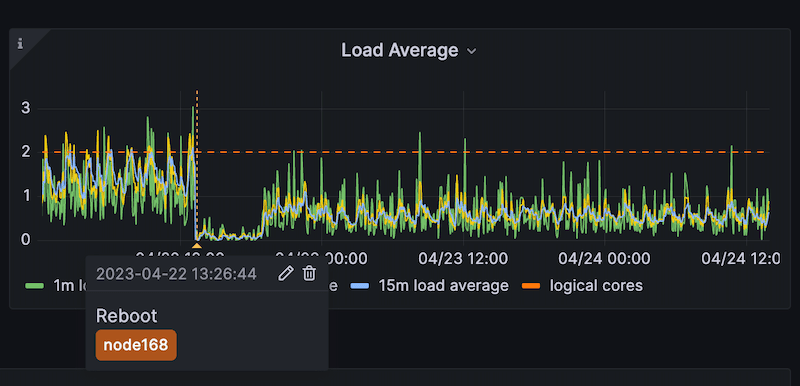
Placing those important system events directly on graphs help to understand the root cause of systems trends changes.
These dashboards and alerts can help you get your Linux monitoring up and running in an easy way which is the goal of this integration.
Give our Linux integration a try, and let us know what you think! You can reach out to us in our Grafana Labs Community Slack in the #Integrations channel.
Grafana Cloud is the easiest way to get started with metrics, logs, traces, and dashboards. We have a generous forever-free tier and plans for every use case. Sign up for free now!

