
Use Canvas panels to customize visualizations in Grafana
The Canvas panel, which will be Generally Available in Grafana 10, combines the power of Grafana with the flexibility of custom elements. Canvas visualizations are extensible, form-built panels you can use to explicitly place elements within static and dynamic layouts. This empowers you to design custom visualizations and overlay data in ways that aren’t possible with standard Grafana panels, all within Grafana’s UI.
If you’ve used popular UI and web design tools, then designing Canvas panels will feel very familiar. Let’s take a look at how we developed this feature. We’ll also discuss how users can benefit from Canvas panels and look at some of the recent upgrades we’ve made in the beta version included in Grafana 9.5.
Grafana Canvas panel origins
Back in the not-so-olden days, most business software was implemented using Windows Form Designer. This tool allows non-programmers to implement complex user interfaces with a basic point-and-click WYSIWYG editor. Although it is disliked by many, the power and flexibility is clear. Grafana supports creating dashboards with high-level visualization components. We created the initial canvas panel as a way to expose explicit control over smaller elements.

Early development
The core structure of the Canvas panel has been stable from the start. It contains a scene class that has a tree structure of all elements that exist on the canvas. This structure is clearly seen from the Canvas panel JSON. These elements in turn have properties — such as background image, color, text, etc. — that can be tied to data or fixed values.
Even with the stable structure, we needed to make some critical decisions in the early days of development. First, we had to determine how to handle moving elements and manage the selection state. While we could have written this functionality ourselves, it would have delayed development by several months. After trying several different options, we landed on the Moveable and Selecto libraries.
Under the hood, when you click and drag an element, the moveable library captures the drag event and simply applies a CSS transform to the DOM element. But simply applying this transform is not enough to make changes persistent. On the drag end event we “save” the element’s position into the panel’s JSON model.
Next, we had to implement a rudimentary constraint system, which determined how elements would respond to changing panel size. This system would grow to handle much more complexity, but we’ll get into that later in this blog post. This basic constraint system was represented as an anchor object on each element with basic boolean properties: top, bottom, left, and right.
Alongside the basic constraint system, we needed to implement an editor to manage canvas element properties. With this basic editor in place, users could add new elements to the canvas, modify their properties, and manage their layering position.
The basic constraint system had inherent limitations. We needed to do better if we wanted to support responsive, flexible layouts. After researching and troubleshooting we landed on adopting Figma’s understanding of constraints. At a high level, canvas elements have a constraint property, broken out into both vertical and horizontal constraints. Breaking out constraints on both vertical and horizontal axes allows you to create more flexible designs.

With the core layout engine in place we were able to focus on various other improvements, including adding an inline editor, a context menu, and elements such as metric value that enable you to quickly tie into your data.
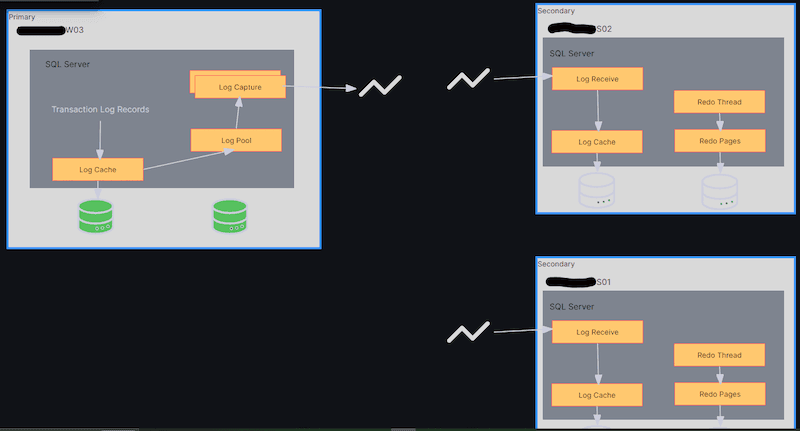
With the Canvas panel you can explicitly place elements within static and dynamic layouts. This way, you can design custom visualizations and overlay data in ways that aren’t possible with standard Grafana panels. For example, let’s say you want to get a high level view of your SQL availability group. First, you can use the Canvas panel to construct a high-level view of your system. Then you can tie data to your visualization and set color thresholds to get a quick view of your system’s status. This is exactly what Grafana user Dave Pinnock (@dp106) showed off in the active community discussion about the Canvas panel.
The Canvas panel isn’t just for the classic synthetic monitoring use case; it can extend into monitoring real-world physical systems, too. For example, we’ve seen users build panels that show the occupancy for desks and rooms in an office based on sensor data stored in InfluxDB. These are just some of the ways people are using the versatility of custom background images and custom element overlays tied to their data.
Recent development
With the Grafana 9.4 release earlier this year, we made a number of major enhancements to Canvas, including the ability to draw connections between elements, add data links, and even a new server element.
There is a lot to cover, so let’s dive in! First, I recommend you check out the following Grafana 9.4 video, which provides an overview of additional capabilities such as creating connections between elements and integrating the server element type.
Connection properties
Connections support setting both their size and color based on fixed or field values so you can easily visualize what your data represents. For example, in a service graph you can effortlessly tell which path has more requests based on the size and color of the connection.

Data links
Canvas now allows users to easily include data links, which can significantly enhance the functionality and usefulness of the panel. You can seamlessly link to relevant dashboards within Grafana by adding a data link to a canvas element, such as a metric value element.
This new feature not only provides users with more comprehensive and accurate information, but also allows for a more intuitive and streamlined experience. With inline editing disabled, you can quickly access data links by simply hovering over the connected element, making it easier than ever to stay up-to-date with your complex systems.
More to come
The Canvas panel in Grafana has come a long way since its inception, and it’s now a powerful tool for creating custom visualizations. Its flexibility and versatility make it unique and allow users to create complex layouts and designs with ease. And with recent improvements such as the introduction of connections and data links, the Canvas panel is more capable than ever before.
Looking forward, we plan to partner with the community to shape the development of the panel. We are also considering ways to improve the user experience of designing your canvas. These include adding new element types, considering methods to automatically generate a layout based on the shape of your data, and improving integration with other visualization software.
We can’t wait to see what users will create with these new tools and how they will continue to push the boundaries of what’s possible with Grafana. In the meantime, we would love your feedback on Canvas. Please check out the Github discussion and join the conversation!
Grafana Cloud is the easiest way to get started with metrics, logs, traces, and dashboards. We have a generous free forever tier and plans for every use case. Sign up for free now!

