
Gain real user monitoring insights with Grafana Cloud Frontend Observability
At ObserabilityCON 2022, we announced a limited private preview program for Grafana Cloud Frontend Observability, our hosted service for real user monitoring. Today we are excited to introduce a public preview program that makes Frontend Observability accessible to all Grafana Cloud users, including those in our generous free-forever tier. Simply look for Frontend under Apps in the left-hand navigation of the Grafana Cloud UI and click through to set up the feature. (Not a Grafana Cloud user? You can sign up for a free account today.)
Powered by Grafana Faro, our open source web SDK for telemetry collection, Grafana Cloud Frontend Observability provides Development, Operations, and SRE teams out-of-the-box insights into the real end user experience of their web applications and enables them to quickly understand and resolve unhandled errors.
What is frontend observability and why does it matter?
Simply put, frontend observability is about applying core observability concepts to debugging performance issues with client-side applications, revealing user issues that couldn’t be observed or diagnosed any other way. A great user experience requires a high-performing frontend application, but frontends are increasingly complex and fragile: They run on different devices, browsers, and operating systems, and they have dependencies on a variety of third-party integrations. And because part of the code runs on the client, they can be very difficult to debug.
For some time, customers using Grafana Cloud to monitor their backend services have been requesting a tool for discovering and understanding problems in their frontend applications. With Grafana Cloud Frontend Observability, we are happy to provide customers with exactly what they’ve been asking for: a seamless, curated workflow to understand errors and their relevance, monitor transaction performance, and quantify website quality using Web Vitals, a set of standards developed by Google to define a positive user experience.

Prioritize and fix frontend errors faster with Error Awareness
Errors always happen, whether or not you have perfect test coverage (the ratio of the overall application code that is continuously tested). But when there are many individual error events, it becomes hard to make sense of all your errors and prioritize them for troubleshooting. Error Awareness in Frontend Observability intelligently groups similar errors together and allows you to investigate errors down to specific lines of code, ultimately reducing mean time to repair (MTTR). (We are starting with frontend errors with plans to expand this capability for exceptions captured via tracing.)
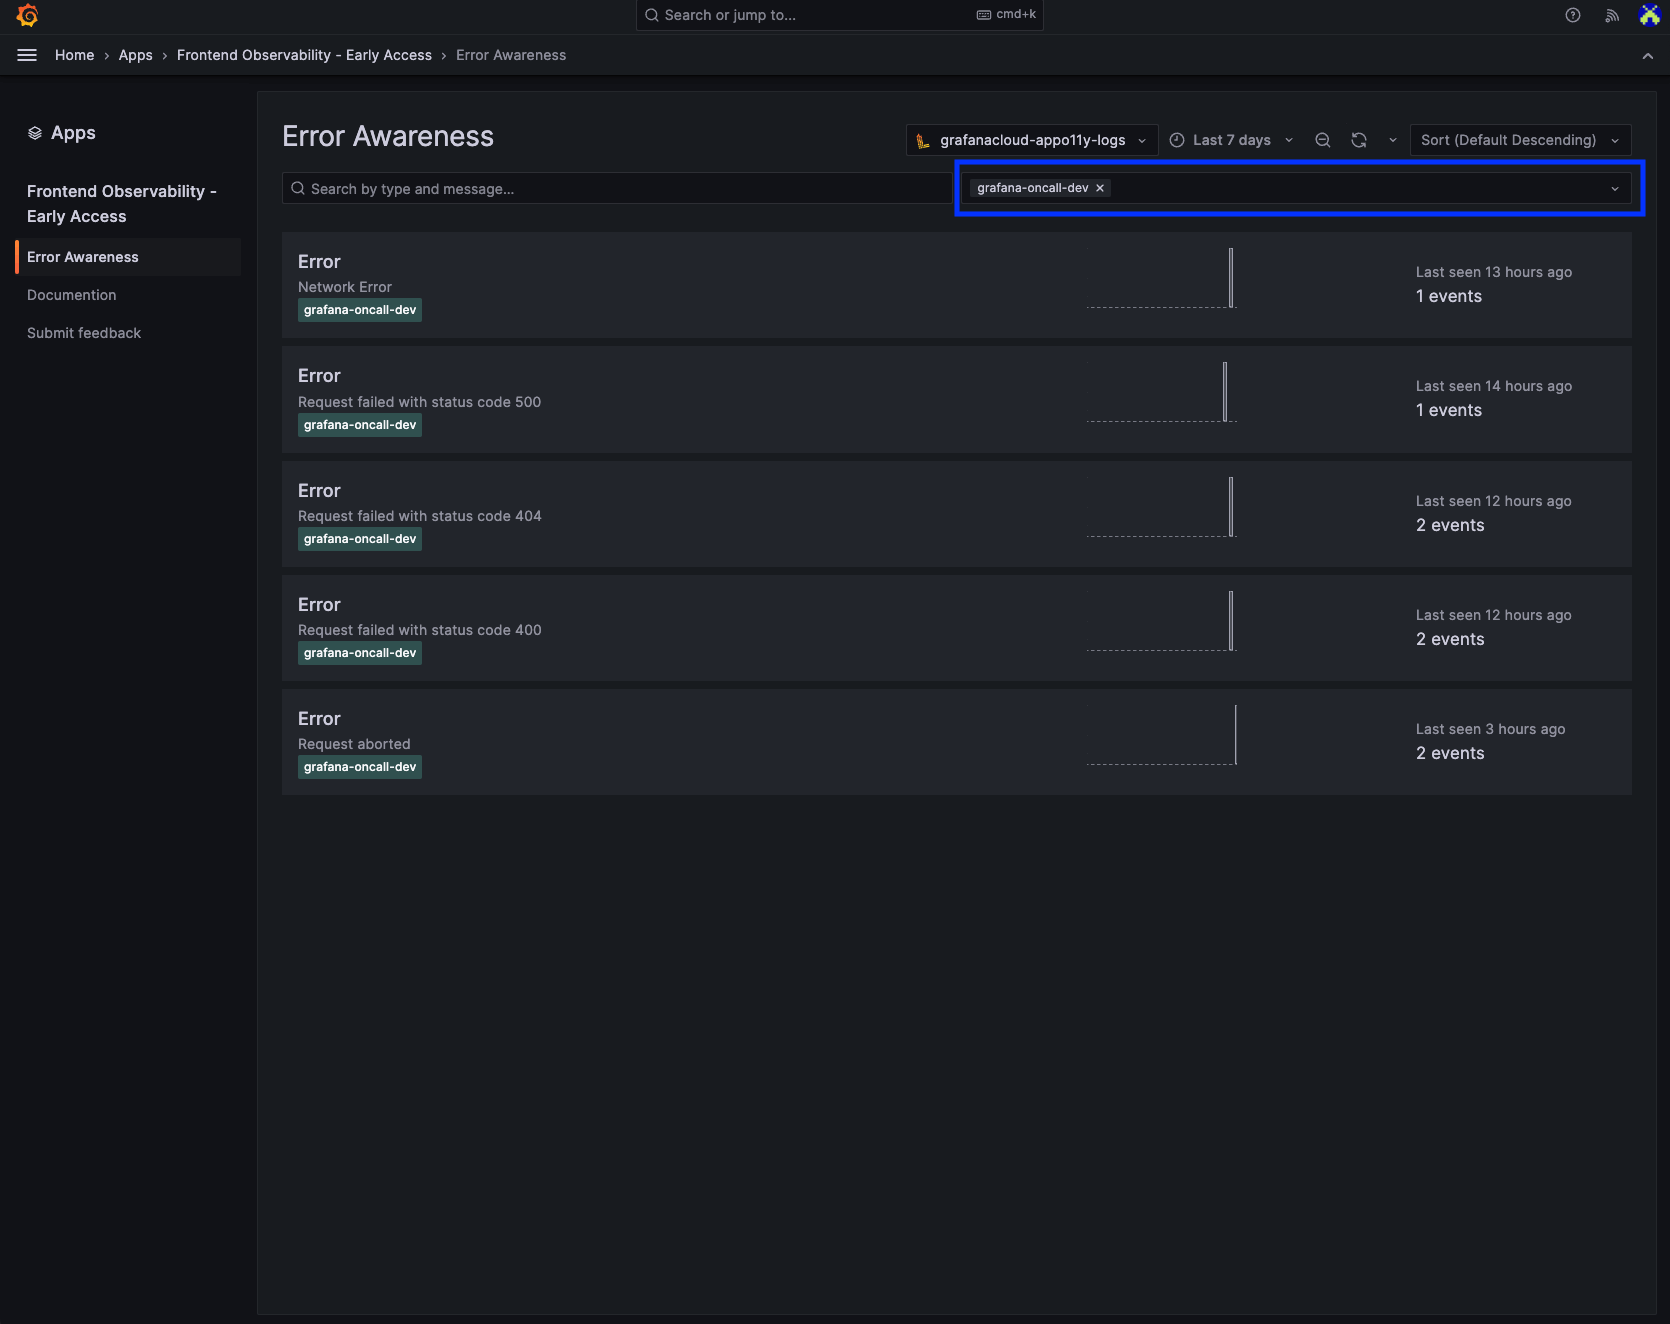
In the following example, the Error Awareness functionality is used to identify and resolve an error in the “grafana-oncall-dev” application.
After selecting the application name “grafana-oncall-dev” in the filter, you immediately get a list of all unhandled Javascript errors that happened in the particular application. Errors are automatically aggregated into a view where they are deduplicated and then weighed by number of occurrences.
Clicking into one of the errors, such as Request failed with status code 500, gets you more details about that specific error event, including on which page and in what type of browser the error occurred.

Scrolling down further gets you the stack trace so you know where in your code to start investigating. Frontend Observability will turn a minified stack trace into a readable one by reaching out to the origin and using the sourcemap to reconstruct the original stack trace. The result? You are able to quickly pinpoint the root cause of an error and resolve the error faster.

Analyze frontend errors
Another way to start the troubleshooting workflow and access similar insights is through the Errors page, which provides high-level data about all the errors that occurred in the “grafana-oncall-dev” application, such as errors over time, top errors, top URLs, and top browsers. This helps you easily identify important errors and reduce noise.

Build custom Grafana dashboards with frontend data
Frontend Observability data is stored in Grafana Cloud Logs, a highly scalable logging solution that is powered by Grafana Loki and uses LogQL for queries. As a result, you can build custom Grafana dashboards with your frontend data for more flexible and comprehensive reporting and analysis.
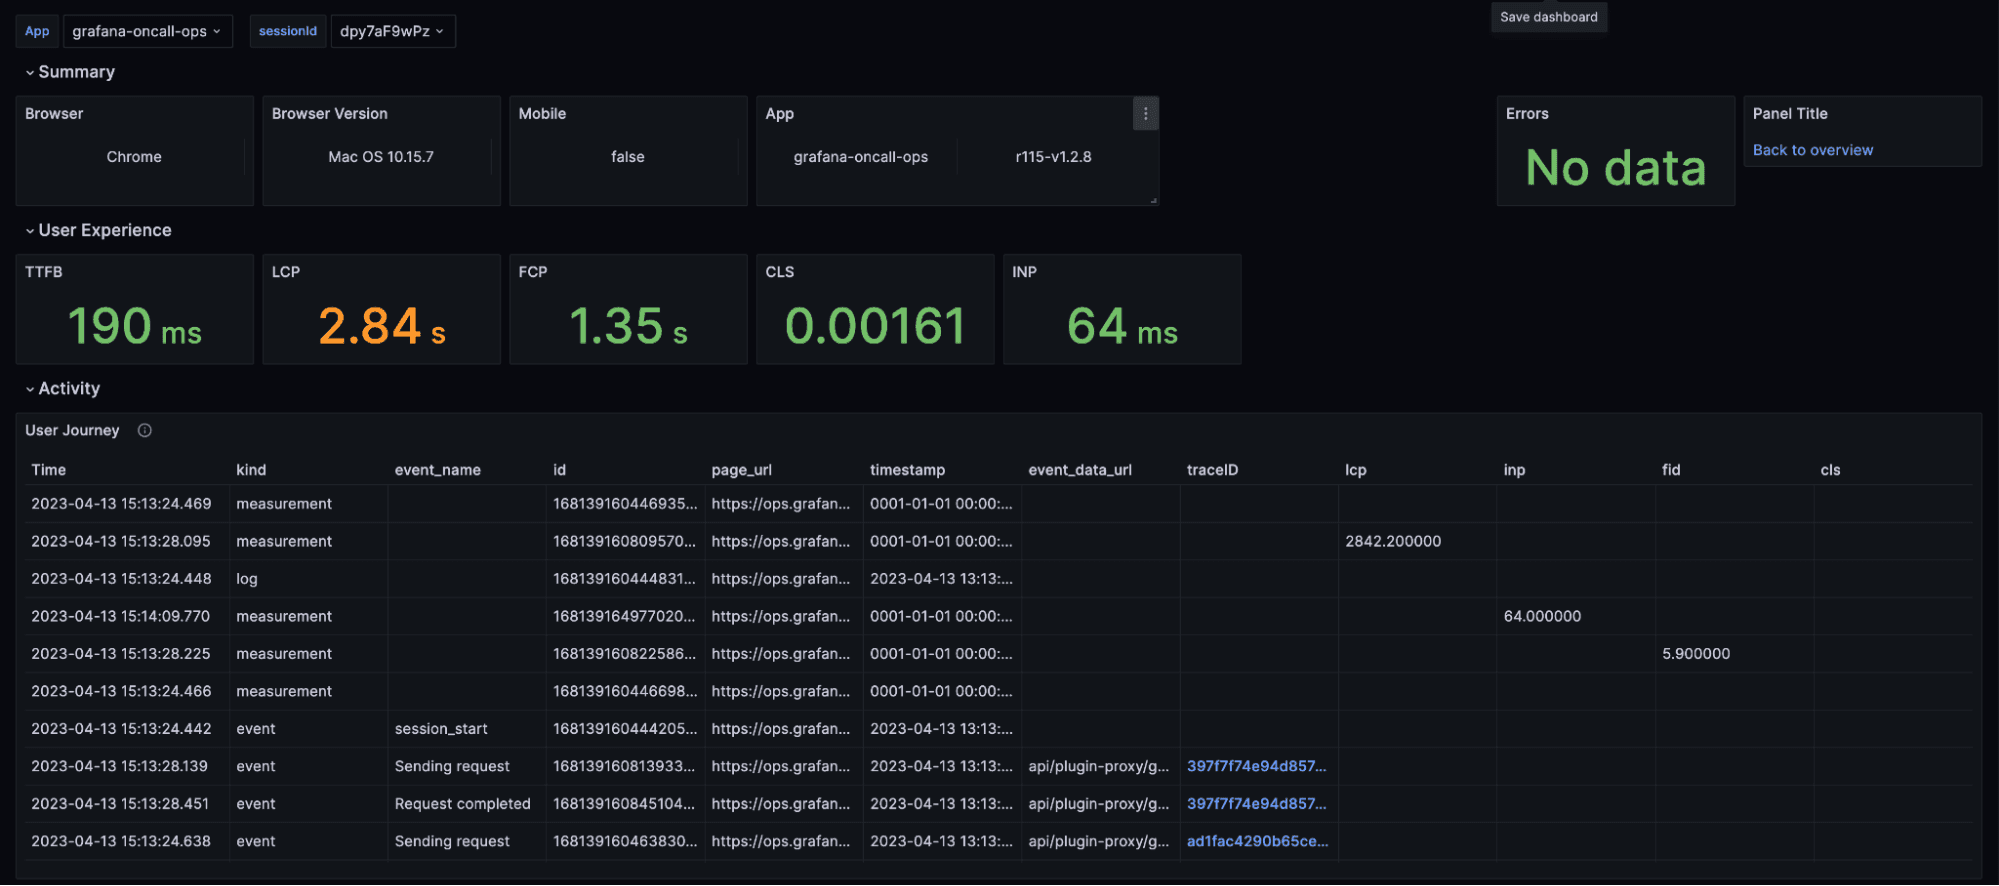
Below is an example of a Grafana dashboard that’s built on top of the raw data to summarize information of a specific user session on a website.
Try Grafana Cloud Frontend Observability today
Frontend Observability is now available for all Grafana Cloud customers, including those in our generous free-forever tier, in public preview and getting started is easy:
- Simply go and look for Frontend under Apps in the vertical left-hand navigation in Grafana Cloud.
- Register your application URLs through the web interface.
- Follow the instructions to add the Grafana Faro Web SDK to your application.
- Enjoy out-of-box insights into the behavior and performance of your frontend applications!
For full implementation details and best practices, see our Frontend Observability documentation.
We are excited to add more features to Frontend Observability as we prepare to make this feature generally available to all Grafana Cloud users. Until then, we’d love to hear what you think of Frontend Observability and what features you would like to see next. Come talk to us directly in the #Faro channel in the Grafana Labs Community Slack.
Not a Grafana Cloud user yet? You can sign up for a free account that includes 10k metrics, 50GB logs, 50GB traces, and more.

